NON-LINEAR SEISMIC ANALYSIS OF BATTERY ASSEMBLIES
MOUNTED ON RACK SUPPORT
Sohrab Esfandiari1), Farzin Faili1), William Horstman2)
1) ENOVA Engineering Services, Walnut Creek, California, USA 2) Pacific Gas & Electric Company, San Francisco, California, USA
ABSTRACT
As part of plant maintenance and upkeep, commercial nuclear plants routinely perform walkdowns of various structures and equipment to identify and correct any potential anomalies associated with installation and/or maintenance. One of the objectives of such walkdowns is to look for findings associated with the as-installed conditions, which may be different from intended design. The intent of these walkdowns is to increase the reliability of the plant.
A typical finding associated with these walkdowns, is identification of excessive gaps for equipment and support structures. For example, one such finding is identification of minor gaps at either end of battery assemblies with respect to supporting racks, making it slightly different than their design basis configuration for seismic qualification. As such, the battery assembly is liable to rattle inside the battery rack causing sliding and impact loads onto the batteries and the supporting rack members.
For the as-found condition, non-linear seismic analyses were performed to obtain realistic reaction loads and determine the extent of sliding and separation (uplift) of the battery assembly with respect to the supporting racks. These analyses properly modelled the exact gaps found on either end of the assembly, as well as non-linear base interface conditions for the possibility of sliding and uplift of the batteries, before the supporting racks were engaged. Another objective of the analysis was to develop In-Equipment Response Spectra (IERS) for comparison of the as-designed condition (no gaps) with as-found condition (with gaps), in order to determine the impact of gaps on IERS, and thus the battery seismic qualification.
INTRODUCTION
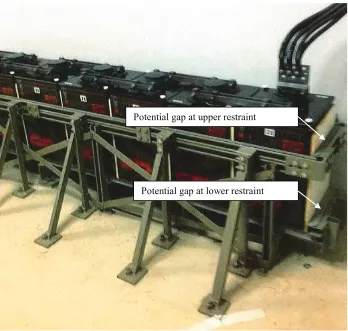
During a plant walkdown, it was discovered that a number of battery assemblies supported inside battery racks have some gaps at either end, and were not snug tight against the battery rack supporting members. These gaps were identified at both the upper and the lower battery rack support members (unistrut members that hold the battery assembly in-place). Figure 1 shows a typical one-tier battery assembly with some of the as-found gaps at upper and lower rack restraints. The seismic qualification of these batteries and battery racks were based on a snug-tight configuration with no gaps present. As such, under design basis seismic loads, the battery assembly is liable to rattle inside the battery rack causing sliding and impact loads onto the supporting battery rack members.
It was determined that the seismic response of the battery assembly in its as-found condition needed to be studied in order to compare the critical seismic response parameters vs. the as-designed condition (based on snug tight configuration). As such, a non-linear model of the battery assembly was created with appropriate gap-elements for seismic response analysis of the as-installed condition.
with respect to the battery rack. Another objective of the analysis was to develop In-Equipment Response Spectra (IERS) for comparison between the base case (no gaps) with as-found condition (with gaps), in order to determine the impact of gaps on IERS.
Figure 1: Typical Battery and Rack Configuration with Potential as-found Gaps
TECHNICAL APPROACH
A non-linear model was developed to properly represent the as-found condition. The model represented a battery assembly consisting of 12 battery cells inside a battery rack. The as-found gap conditions were modeled by gap elements and the base of the model was allowed to slide and rock, or go into free-flight mode if the seismic demand causes it to do so.
The battery assembly was modeled using simple rigid stick representation with the mass concentrated at the CG location. Rigid links were used to model the entire assembly since the design basis test report had found the assembly to be rigid in all directions. The focus of this study was to evaluate the effects of as-found condition (with gaps), vs. as-tested condition (no gaps). Non-linear gap elements were used to model the potential gap at upper and lower rack restraints. Non-linear friction/gap element was used at the base to allow the model to slide once friction resistance is overcome, and uplift in case of potential rocking and/or free-flight mode of response. A local vertical damper element at each end was introduced to allow for energy dissipation associated with the impact of the two surfaces, in case of vertical separation. The model was 2-D, where X axis represents the long dimension of the battery assembly (Side to Side) and Z represents vertical.
Potential gap at upper restraint
All analyses were performed using the SAP2000 Non-linear computer program, using the Fast Nonlinear Analysis (FNA) Approach (Ref. 1). To comply with SRP 3.7.1 (Ref. 2) for performing non-linear analysis, once the controlling gap configuration was found, 5 analyses cases were performed subject to the 5 sets of independent time histories representing the broadened floor spectra for this location. Per SRP guidelines (Ref. 2), the results from these 5 sets were then averaged to arrive at the realistic demand loads for both the battery assembly (IERS) as well as impact loads onto the rack restraint members for rack qualification. Analyses were performed for 2 sets of coefficients of friction of 0.2 and 0.4 at the base in order to find the controlling case. It was found that the case with coefficient of friction of 0.2 was the controlling case, with respect to both maximizing the sliding at the base, as well as impact loads after gaps were closed.
Per walkdown from the plant personnel, a number of different gap configurations were found for various battery assemblies. Table 1 below shows the different gap configurations that were required to be analyzed in order to find the controlling cases. Figure 2 shows the model schematically.
Table 1: Various Gap Configurations Studied
Case No. Location/Gap Size (in.)
GTL GBL GTR GBR
1 (Base case) 0 0 0 0
2 0 0 1/8 1/8
3 0 0 1/8 1/2
4 0 0 1/4 1/4
5 0 0 3/8 3/8
6 0 0 3/8 1/8
7 0 0 0 3/8
Notations:
GTL = Gap at Top Left Location of Model GBL = Gap at Bottom Left Location of Model GTR = Gap at Top Right Location of Model GBR = Gap at Bottom Right Location of Model
Case 1 (with zero gaps) represents the base case or the as-tested condition. All other cases were compared to case 1, to determine the effect of having gaps present in the as-found condition, compared to design basis condition (with no gaps).
Figure 2: Non-linear Model of Battery Assembly
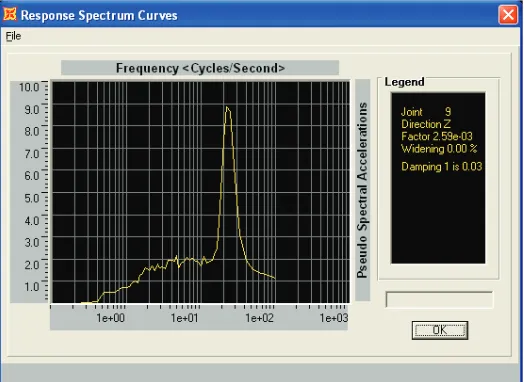
Figure 3: RRS (TH1) – N-S plotted at 3% Damping
RESULTS
All together 7 cases were analyzed as shown in Table 1. Case 1 (or Base Case) represented the no gap condition which was the as-tested and as qualified configuration of these battery assemblies and their respective battery racks. Cases 2 through 7 represented various combinations of gaps at lower and upper restraint locations that were the as-found conditions. The response parameters of interest were:
! Gap element impact forces – Represents the lateral impact load when gaps are closed that should be used for qualification of the battery rack
! Base element friction resistance – Measure of how much of the imposed inertia is resisted by friction before gaps are closed and lateral restraints are engaged
! Base element vertical impact load – Represents the load imposed onto the battery rack bottom surface as a result of separation of the battery assemblies from the rack due to either rocking or free-flight mode
! IERS at top of battery cell – Represent the response of the battery cell. Comparison of this to the base case (no gaps) represents whether the presence of various gaps has any impact on IERS
! Sliding displacements – Represents how far the battery assembly will slide to close a gap, or in some instances a measure of travel limit if the gaps are never closed
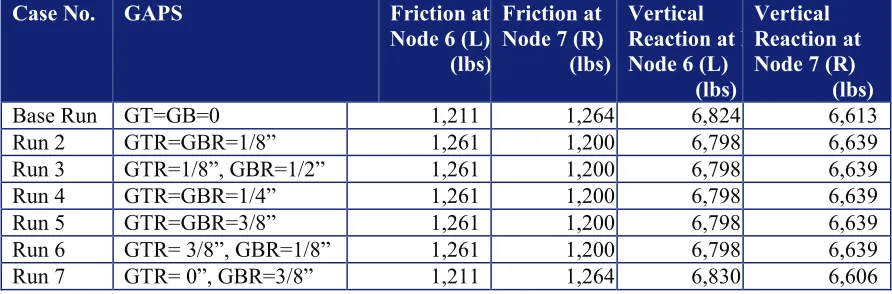
Table 2 below provides a summary of impact forces for when gap-elements close. Table 3 summarizes the friction resistance forces as well as vertical impact forces at the base of the assembly.
Table 2: Comparison of Horizontal Impact Loads at Gap Elements
Case No. GAPS GTR
(lbs) GBR (lbs) GTL (lbs) GBL (lbs)
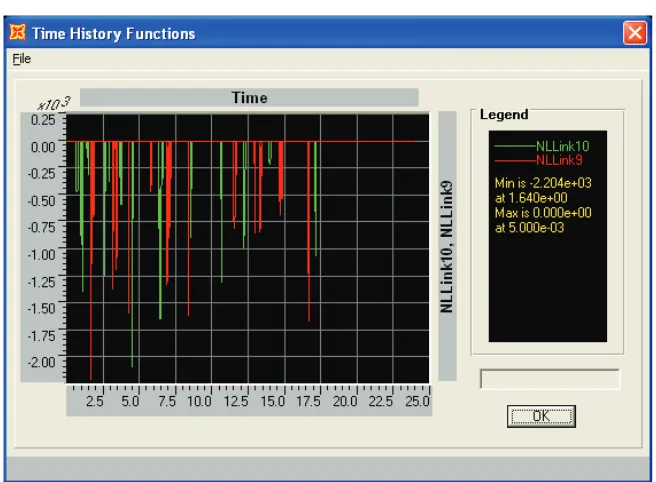
Base Run GT=GB=0 2,385 2,377 2,409 2,403 Run 2 GTR=GBR=1/8” 2,212 2,204 2,092 2,087 Run 3 GTR=1/8”, GBR=1/2” 3,009 0 2,006 1,997 Run 4 GTR=GBR=1/4” 1,678 1,893 1,668 1,887 Run 5 GTR=GBR=3/8” 0 0 1,406 1,397 Run 6 GTR= 3/8”, GBR=1/8” 0 3,006 1,999 1,991 Run 7 GTR= 0”, GBR=3/8” 4,129 0 2,440 2,430
Table 3: Comparison of Base Friction and Vertical Impact Loads
Case No. GAPS Friction at
Node 6 (L) (lbs)
Friction at Node 7 (R)
(lbs)
Vertical Reaction at N Node 6 (L)
(lbs)
Vertical Reaction at Node 7 (R)
(lbs)
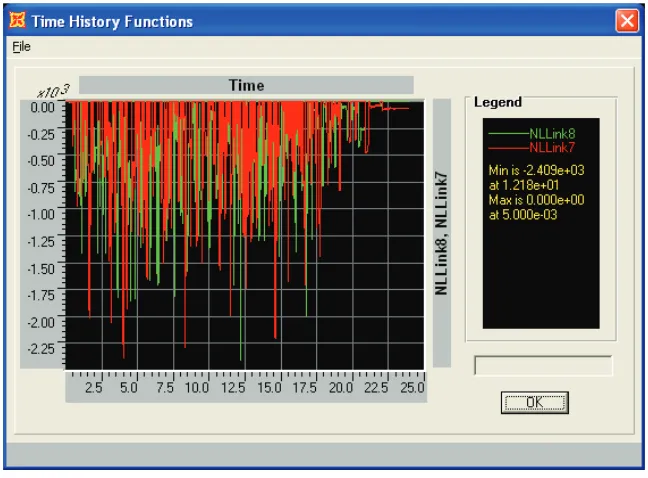
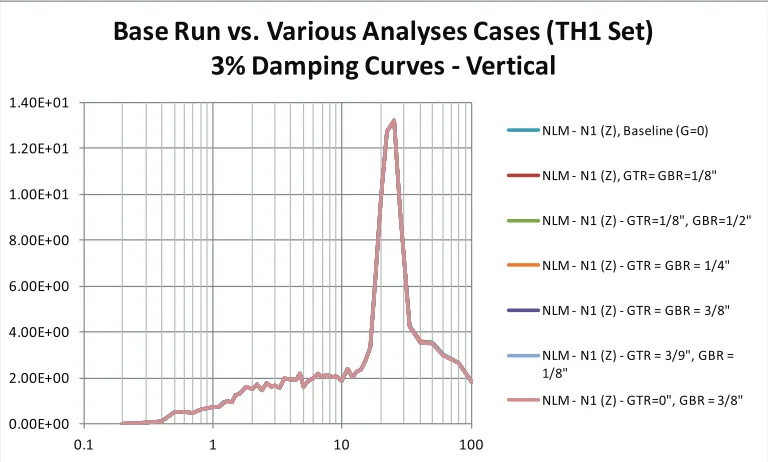
Figure 5 shows the impact forces for the base case (no gaps), whereas Figure 6 shows the impact forces for the top gap elements for one of the cases (Run 2), and Figure 7 shows the impact forces for the bottom gap elements for one of the cases (Run 2), as a sample run. Figures 8, 9 and 10 show max. sliding displacement at the base of the model for the base run and Runs 2 and 3 respectively. Figures 11 & 12 show the comparison of base case IERS vs. the various cases with as-found gap conditions for the horizontal and the vertical directions respectively for one of the time history runs (TH1).
Figure 6: Peak Top Gap Element Forces (Green = left, Red = Right) –Run 2
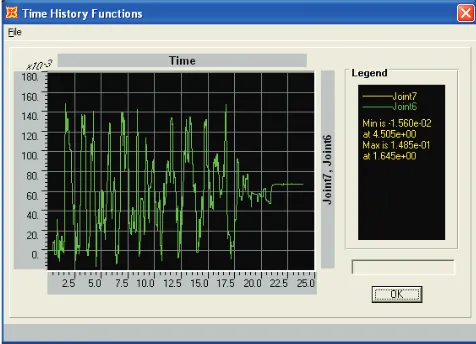
Figure 8: Max. Sliding Displacement at nodes 6 & 7 = 0.019” (Base run)
Figure 9: Max. Sliding Displacement at nodes 6 & 7 = 0.142” (Run 2)
0.00E+00 1.00E+00 2.00E+00 3.00E+00 4.00E+00 5.00E+00 6.00E+00
0.1 1 10 100
Base Run vs. Various Analyses Cases (TH1 Set)
3% Damping Curves - Horizontal
NLM - N1 (X) - Baseline (G=0) NLM - N1 (X) - GTR= GBR=1/8" NLM - N1 (X) - GTR=1/8", GBR=1/2" NLM - N1 (X) - GTR = GBR = 1/4" NLM - N1 (X) - GTR = GBR = 3/8" NLM - N1 (X) - GTR = 3/8", GBR = 1/8" NLM - N1 (X) - GTR = 0, GBR = 3/8"
Figure 11: Comparison of Horizontal IERS at Node 1 for various cases vs. Base Run
0.00E+00 2.00E+00 4.00E+00 6.00E+00 8.00E+00 1.00E+01 1.20E+01 1.40E+01
0.1 1 10 100
Base Run vs. Various Analyses Cases (TH1 Set)
3% Damping Curves - Vertical
NLM - N1 (Z), Baseline (G=0)
NLM - N1 (Z), GTR= GBR=1/8"
NLM - N1 (Z) - GTR=1/8", GBR=1/2"
NLM - N1 (Z) - GTR = GBR = 1/4"
NLM - N1 (Z) - GTR = GBR = 3/8"
NLM - N1 (Z) - GTR = 3/9", GBR = 1/8"
NLM - N1 (Z) - GTR=0", GBR = 3/8"
CONCLUSIONS
The following conclusions were arrived at regarding the as-found condition assessment of these Battery Assemblies:
! All analyses cases seem to have minimal impact on horizontal spectra when compared to base case of no gaps. There is not enough inertia to cause anything visible. Small changes at high frequency are noted, most likely due to gaps closing and opening (rattling), but the main peak generally experiences a reduction in amplitude. As such the seismic test qualification of the battery assemblies is not affected by the presence of the gaps
! Vertical spectra do not change from case to case, as horizontal gaps do not affect vertical spectra.
! Generally gap forces reduce compared to base case reactions, because of friction at the base, except for unequal gaps when one gap takes all the reaction
! When there are unequal gaps (top restraint vs. bottom), once the smaller gap closes, all reaction loads are taken by that restraint, and the larger gap does not close because of the high lateral stiffness associated with these restraints.
! The limiting travel was > ¼”, but < 3/8”. The 3/8” gap never closes.
PRACTICAL APPLICATIONS
By performing non-linear seismic analysis of the as-found condition of these battery assemblies with some gaps allowing for rattling of batteries inside the racks, one can show that the design basis qualification is not invalidated, as such potential past operability issues can be addressed and resolved.
REFERENCES