Quantitative Estimation of Purified Turmeric
Extract Components using TLC and HPLC
Divya Sharad Kasarle
1Scientist, DSK Nutrition Research Centre Pvt. Ltd, Mumbai-400092, Maharashtra, India1
ABSTRACT:Purified turmeric extract, obtained from turmeric rhizomes, contains curcumin as a principle pigment that constitutes upto 50-60% of the total content. Curcumin is commercially available as a nutrition supplement as it exhibits various medicinal and nutritional properties. Its essential oil is present upto 7%; with high content of bisabolane derivatives. Other minor constituents include Demethoxycurcumin, bisdemethoxycurcumin, di-hydro curcumin, common phytosterols, fatty acids and polysaccharides. This paper focuses on the quantitative estimation of curcumin, demethoxycurcumin and bisdemethoxycurcumin, in purified turmeric extract, using TLC and HPLC techniques
KEYWORDS:Quantitative,purified turmeric extract, TLC, HPLC
I. INTRODUCTION
Curcuma longa or turmeric plant is commonly cultivated in almost all states of India, such as Bihar, Coimbatore,
Cochin, Bengal etc. Turmeric is also known as Haldi and it is derived from the root or rhizome of Curcuma longa plant. The central or primary rhizome has a macroscopic ovate, oblong, round or cylindrical structure. Its length varies from 2-8 cm and its diameter varies from 1-3 cm. Purified turmeric extract is obtained from turmeric rhizome processing. Phytochemical components of purified turmeric extract include curcumin, which is the main pigment of turmeric, demethoxycurcumin, bisdemethoxycurcumin, common phytosterols, fatty acids, polysaccharides and volatile oils such as turmerone, atlantone and zingiberene [2], [4], [5]
There are various medicinal properties of curcumin. Curcumin is known for its anti-inflammatory effect. It acts on upregulation of PPAR-gamma and suppression of proinflammatory cytokines. It is known for its anti-oxidant activity as it destroys free radicals and reactive oxygen species (ROS) Curcumin acts as a memory booster, supporting brain health, functioning and is mainly used as an immune booster. It has been studied that a decoction of basil leaves with curcumin is best known to boost our immune system. Consuming 1-2 teaspoons of curcumin per day helps to fight with cough cold and recurrent infections. Other properties of curcumin include cancer, diabetic, ageing, anti-hypertensive, anti-microbial and digestive health benefits. Curcumin with turmeric extract is commercially available as a nutritional health supplement, in various brands. Our aim is to estimate the curcumin content of turmeric [2], [3], [4] This paper focuses on the quantitative estimation of Curcumin, Demethoxycurcumin and Bisdemethoxycurcumin using thin layer chromatography (TLC) and high performance liquid chromatography (HPLC). Main purpose of quantitative estimation is to check the relative abundance of curcumin, present in the sample.
II. LITERATUREREVIEW
Curcumin, bisdemethoxycurcumin and demethoxycurcumin belong to the class of curcuminoids. Curcuminoids have bright yellow-orange colouration, and hence are used as food colourants. Curcuminoids have low solubility in water, at acidic and physiological PH. Hence their bioavailability and absorption is often increased by adding Piperin derivatives, in the formulation. Curcumin is a keto-enol tautomeric compound, acting as a chelator of metal ions. It has been found that the antioxidant activity of curcumin is greater than that of bisdemethoxycurcumin and demethoxycurcumin [2]
using identity tests such as thin layer chromatography. It is often used in separation of non-volatile mixtures. It has two main phases, stationary and mobile phase. Stationary phase is the thin layer of adsorbent whereas mobile phase is the solvent mixture. It is performed on a glass plate or a plastic or aluminium foil coated with a thin layer of adsorbent such as silica gel. A solvent or solvent mixture is drawn upwards via capillary action. The spots are then visualized using projection of UV light. The results are quantified using following formula for retention factor (Rf):
Rf= Distance travelled by substance (turmeric extract) Total distance travelled by Mobile phase
Low Rf value substance is defined as a substance with its Rfvalue resembling stationary phase whereas high Rf value
substance is defined as a substance with its Rf value resembling mobile phase. Advantage of using thin layer
chromatography is that it helps to determine purity of the sample and is quite economical. For more accurate analysis, high performance liquid chromatography (HPLC) is used [1]
High performance liquid chromatography or HPLC is a technique used in analytical sciences to separate, identify and quantify each component in a mixture. It is a type of column chromatography with the concept of mobile and stationary phases, as similar to TLC. However, HPLC has a facility that pumps a sample mixture into a solvent (mobile phase) at high pressure through a column with chromatographic packing material (stationary phase), carried through gas stream of helium or nitrogen. Retention time is based on the interaction between stationary phase, mobile phase and the sample to be analysed [1]
III. METHODOLOGY
Purified turmeric powder was obtained from DSK Nutrition Research Centre Pvt. Ltd, Mumbai, for analysis purpose. Preparation of turmeric extracts was done using Soxhlet Extraction process. In this process, 50 g of purified turmeric powder was extracted using Soxhlet apparatus. We have used ethyl acetate as the solvent. Soxhlet apparatus consist of a flask, Soxhlet extractor, a side tube, a siphon tube and a condenser.
Procedure of soxhlet extraction:
Purified turmeric powder was packed in filter paper cylinder and was placed in the body of soxhlet extractor. The solvent, ethyl acetate was placed in the flask. Then the apparatus was fitted accordingly. Ethyl acetate was allowed to boil for few minutes, for converting it into the vapour state. These vapours entered into the condenser through side tube and got condensed into hot liquid, which fell onto the column of turmeric powder. The level of siphon tube raised upto its top, when the extractor was filled with the solvent. This solvent, containing the active constituents in siphon tube ran into the flask, thereby emptying the body of the extractor. This process continued, till the turmeric powder got exhausted. The soluble active constituent remained in the flask. The extract was concentrated under reduced pressure and later on was air dried [9]
Identity Test of Curcumin using Thin Layer Chromatography
Test solution was prepared by using purified turmeric powder. 1 g of purified turmeric powder was mixed with methanol. The solution was kept on a rotatory shaker for 10 minutes, followed by slight warming using a gas burner. The solution was filtered and the filtrate was used for further analysis. Reference solution was prepared by dissolving 1 mg curcumin and 1 ml methanol. Chloroform: ethanol: glacial acetic acid (94:5:1) was used as solvent system.
A precoated silica gel plate of 5x15 cm and of uniform thickness was used to apply 5 microlitres of test solution and reference solution, respectively. The plate was developed in the solvent system to a distance of 12.5 cm, as suggested in standard textbooks. Then it was scanned densitometrically at 366nm. The fingerprint profiles were recorded [1], [8]
Estimation of curcumin by HPLC:
HPLC system consisting of rheodyne injector, photodiode array detector, 510 chromatographic pump and millennium software version 2.1 was used for analysis of the sample. The following system was selected for analysis:
Fig1: Methodology involves sample collection, preparation of turmeric extract using soxhlet extraction process, Identity test of curcumin using TLC, estimation of curcumin using HPLC, estimation of quantitative standards and analysis of results
extract using HPLC, estimation of quantitative standards, followed by result analysis such as visualization of spots in TLC, scanning densitometrically and estimating retention time factors using HPLC chromatogram.
IV.EXPERIMENTALRESULTS
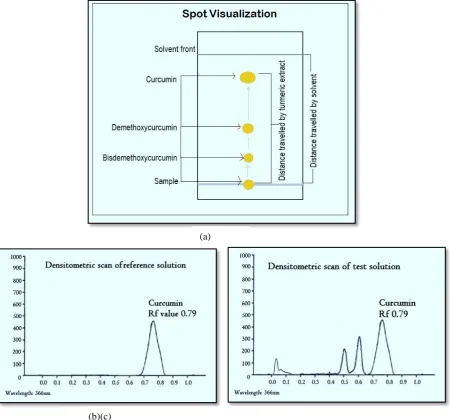
Quantitative standards: Foreign organic matter was found to be less than 2%, total ash value was estimated to be 9%, acid insoluble ash was found to be 1%, water soluble extract was upto 12% and essential oil was found to be 5% Thin Layer Chromatography: Spots were visualized under UV 366nm light. Reference solution exhibited bright yellow fluorescent spot. In test solution track, three bright yellow fluorescent spots were visible and one of which corresponded to curcumin, as shown in figure 2 (a).Densitometric scan was conducted for test and reference solutions and graphs were generated based on the results, as shown in the figure 2 (b) and (c)
Fig 2: Thin layer chromatography- (a) Spot visualization; (b) Densitometric scan of reference solution at 366 nm, (c) Densitometric scan of test solution at 366 nm
(b)(c)
Fig. 2 (a) represents spot visualization for purified turmeric extract using TLC. Total three spots were visualized labelled as curcumin, demethoxycurcumin and bisdemethoxycurcumin, respectively. The direction of travel is from bottom to top. The figure also reveals distance travelled by solvent and distance travelled by the sample. Figure2(b) and (c) represent a graph for densitometric scan of reference solution and test solution respectively,with wavelength on Y-axis and Rf values on X-Y-axis. Valley peaks were observed in the scan. The Densitometric scan was carried out at a wavelength of 366nm. The scan of reference solution revealed the Rf value of 0.79 for curcumin, whereas the scan of test solution revealed three peaks representing Rf values of curcumin (0.79), bisdemethoxycurcumin (0.60) and demethoxycurcumin (0.50)
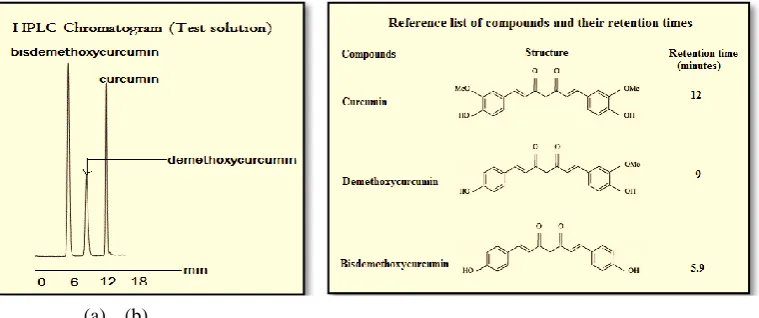
High Performance Liquid Chromatography: The chromatogram revealed three curcuminoids namely, Curcumin,
Demethoxy-curcumin and Bisdemethoxycurcumin, as separated on a nucleosil NH2 using fluorescence detection. The
retention time of curcumin, demethoxycurcumin and bisdemethoxycurcumin is shown in figure 3.
Fig 3:(a) HPLC Chromatogram with peaks for bisdemethoxycurcumin, demethoxycurcumin and curcumin; wavelength 254 nm (b) Reference list of compounds and their retention time in minutes
Figure 3 (a) represents chromatogram for test solution. The X-axis denotes retention time in minutes, whereas the peaks represent components present in the sample, based on the detector response. Three peaks were observed for bisdemethoxycurcumin, demethoxycurcumin and curcumin, respectively. Figure 3 (b) represents compounds present in the sample, their chemical structure and retention time observed from the HPLC chromatogram. The retention time for Curcumin, bisdemethoxycurcumin and demethoxycurcumin was found to be 12, 9 and 5.9 minutes, respectively.
V. CONCLUSION
Curcuminoids are being used since ancient times, due to their potential therapeutic effects such as neuroprotective, hepatoprotective, anti-microbial, anti-tumour and anti-oxidant activities.A simple quantitative estimation of curcuminoids, mainly, Curcumin, demethoxycurcumin and bisdemethoxycurcumin, was carried out using Thin Layer Chromatography (TLC) and High Performance Liquid Chromatography (HPLC). The validation parameters of curcuminoids were studied, and the chromatograms were analysed. Based on the chromatogram results, retention time for curcumin, bisdemethoxycurcumin and demethoxycurcumin were calculated accordingly. Method was found to be simple and accurate for routine analysis of curcumin content in turmeric samples. It is also useful to check adulterants or substitutes in the sample, to determine the purity of the sample.
REFERENCES
[1] A. Kumar, “Curcuma longa”, Indian Herbal Pharmacopoeia, vol. 1, pp 169-180, 2002
[2] Mario, George, Cezar, “Review: Curcumin and Health”, Molecules Journal, vol 21, pp 1-22, 2016
[3] M Akram, “Curcuma Longa And Curcumin: A Review Article”, Roman Journal of Biology – Plant Biology, Volume 55, pp 65–70, 2010
[4] N. Mehdi, “Isolation and characterization of curcumin from powdered rhizomes of turmeric plant marketed in Maragheh city of Iran with soxhlet technique”, Iranian. Chemical. Communion, vol2, pp. 236-243, 2014
[5] SoniHimesh, “Qualitative and quantitative profile of curcumin from ethanolic extract of curcuma longa”, International Research Journal of Pharmacy, Vol 2, pp 180-184, 2011
[6] S.C. Verma, “Simple and Rapid Method for Identification of Curcuma Longa Rhizomes by Physicochemical and HPTLC Fingerprint
Analysis”, Chemical Science Transactions, volume 1(3), pp. 709-715, 2016
[7] J. Kandasamy, “Validated Method For Estimation Of Curcumin From Different Varieties Of Curcuma Longa”, International Journal of
Pharma BioScience, vol 4, pp 1004 – 1010, 2013
[8] Mohamad Rafi, “differentiation of curcuma longa, curcuma xanthorrhiza and zingibercassumunar by thin layer chromatography fingerprint
analysis”, Indonesian. Journal of Chemistry, vol11 (1), pp 71 – 74, 2011
[9] S. Revathy, “Isolation, Purification and Identification of Curcuminoids from Turmeric (Curcuma longa L.) by Column Chromatography”,