Impact of Significant Variables On
Customer Relationship Management, Specific
to Sheet Metal Industry
Dr.Hemanth Kumar. S1, Dr.Prabha Kiran2, Nagendra B.M3
Associate Professor, CMS Business School Jain University, Bangalore, India1
Assistant Professor, CMS Business School Jain University, Bangalore, India2
Assistant Professor, ASC Degree College, Bangalore, India 3
ABSTRACT: In India, today there is a mounting competition in sheet metal industry, as the majority of the industries uses metal sheet for their business activities. Customer Relationship Management (CRM) in sheet metal industries can be a serious factor for the triumph in maintaining decent relationship with the patrons. The primary objective of this research paper focuses on impact of significant variables on CRM in sheet metal industry. The CRM variables under consideration are communication and product & service quality. The primary data is collected through structured questionnaire specific for company associates and the customers with the sample size of 120.The reliability of data was verified using Cronbach’s Alpha. The study highlights the fact that the overall company’s performance is good with respect to the stated variablesalthough steel companies should focus on their communication with the customer located in remote location and works towards improving it significantly.
KEYWORDS: Customer Relationship Management, Communication, Product and Service Quality.
I. INTRODUCTION
The metal sheet creation reminisces the Egyptian jewellery’s by utilizing common metals & ancient procedures.From a blend of naturally found metals and ancient techniques and procedures, gold & silver and other precious gems and jewellery are being able to craft a form of fabrication that aided the basic foundation of techniques which are used today.In a survey statistics of U.S department of labour in the year 2014 it has been found that Sheet metal employment is projected to grow 7 percentage from 2014 to 2024, which is equal to the average rate for all occupations. This means there will be about 9,400 job openings in a decade as highlighted by a study (2014,HighBeamBusiness, IBIS World, the Bureau of Labor Statistics of the U.S. Department of Labor, and the U.S. Census Bureau’s Annual Survey of Manufacturers).
India was the world’s third-largest steel producer in 2016 with productions reaching 96 million tonnes in the year 2016 (IBEF Report, 2017). Steel sector in India contributes 2% to the GDP of the nation and provides 20 lakhs jobs in the country. The growth in the Indian steel sector has been driven by domestic availability of raw materials such as iron ore and cost-effective labour. Consequently, the steel sector has been a major contributor to India’s manufacturing output. Indian steel industries are classified into three categories such as major producers, main producers and secondary producers. Hence it becomes imperative to study this growing sector in detail. There for there is a need to study the growing customer base and the way CRM is perceived in terms of Communication and service quality.
CRM is important as it helps in harnessing customer service excellence. Give your customer the confidence that organisation is well sorted out and they can find solutions to their inquiries rapidly and dependably. The organisations must monitor any guarantee, repair, or service related issues of consumers to build their confidence. CRM helps in boosting deals and also draw in a client or prospect on another open door. Social occasion the client necessities across the board place will ensure that everybody included has a reasonable thought of what's required and what the challenges may be. Then it becomes easier to work with the consumers to create an answer for their queries. Over a period of time organisations can have a background marked by consumer’s necessities that will give them bits of knowledge into both specific consumers, and the whole consumer base. This is the profitable data that can be caught in the CRM framework. CRM helps in extending the market. requirements from existing organizations, yet propelling new items, moving into new domains, or focusing on various enterprises requires that the business endeavours are exceptionally overseen and powerful. CRM framework will help in focusing on prospects and dealing with those interchanges. It will gauge the organisations against the objectives set for them. Being sorted out and industrious, in mix with some great showcasing, will mean the contrast amongst progress and disappointment with your new activity. The offering procedure will be unique and track that procedure. Figure 2 provides the sector snapshot of Steel Industry, Total Crude steel production (million tonnes).
Fig 2 Sector snapshot of Steel Industry, Total Crude steel production (million tonnes)
Source: www.ibef.org
CRM prompts fulfilment and maintenance of patrons and in conclusion prevalent benefits aimed at firm, as time goes on. CRM advances the connection among the association and clients. Such exercises fortify the promise between the organization and clients. Comprehend all varied factors that affect CRM and how the examination of information can be utilized to improve the CRM.
The importance of CRM in Sheet metal industry hence needs to be studied. The scant research on variables impacting the different stakeholders in the industry needs to be explored and the present study aims at addressing this strikingly underdeveloped research area. The proposed article highlights the broad overview of the sheet metal industry with specific attention given to Indian subcontinent. CRM in sheet metal industries can be a serious factor for the triumph in maintaining decent association with the patrons.
Though there is great marketing efforts in sheet metal industries it’s surprising to see that around is a noteworthy lagging behind in research literature in patron relationship in sheet metal industries. Henceforth here is a big investigation gap in researching in the ground of CRM particularly in sheet metal industry. The learning on the significant variables that impact the CRM in the sheet metal industry can add value to company’s offering and can improve the inexpensive advantage.
II. CRM AND ITS IMPORTANCE FOR THE ORGANISATION
CRM is a mixture of individuals, procedures and novelty that appearances to comprehend an organization’s client. It is coordinated means to contract with overseeing connections by focused on client care and relationship advancement. CRM has developed from advances in data innovation and hierarchical fluctuations in patron driven forms[3]. Chen and Popvich in the study have also stated Organizations that effectively actualize CRM will receive the aids in patron dedication what's more, extensive path productivity. Be that by way of it may, fruitful usage is slippery to many organizations, for maximum part since they don't comprehend that CRM requires far reaching, cross utilitarian, client centred business prepare re-designing. Even though a substantial part of CRM is innovation, seeing CRM by way of an innovation just arrangement is probably going to come up short. Dealing through an actual CRM execution needs a coordinated and adjusted means to transaction with innovation, process, and individuals[3]. [1] BoseIn his paper has coordinated towards data innovation (IT) and showcasing administrators considering usage of a CRM procedure. The goal of this research paper does not give an all- inclusive instructional exercise on CRM, but instead to offer a state thoughtful of important standards behind CRM then basic portions of IT advancement prepare. The paper depicts an IT director's presentation into important CRM corporate and showcasing standards. The article proposes a framework for improvement of lifecycle that highlights the angles special or basic to CRM. The current study hence will be conscious of real issues essential for achievement and be equipped to talk about essential improvement matters with sellers, supervise and administration. CRM (client relationship administration) has remained progressively perceived as commercial methodology to viably comprehend, oversee, and preserve patron association with good data and correspondence advancements [6]. Quick upgrading of patron relationship administration applications have understood the pattern that more SMEs (little and medium-sized undertakings) are trying to accomplish CRM keeping in mind end goal to survive and struggle on planet. In this review, the mechanisms impacting the execution of patron association management at little and medium-sized science and modernization stop of Iran were broke down. The discoveries of exploration demonstrate that communication distribution framework, business elements, patron relationships and expansion quality elements influence CRM. Business elements assume a particularly basic part in patron relations[6].
Further ithas inspected how three market orientation components influence industrial/ manufacturers’ CRM outcomes in a business to business context. In linking market alignment workings and their association outcomes, the authors examined the moderating effect of inter-functional coordination. The model was tested using data collected from 279 manufacturing firms in the USA. Results – While customer orientation and competitor orientation both influence customer relationship outcomes, inter-functional coordination does not. The study has revealed that inter-functional coordination lessens the positive relationships between customer orientation and customer retention as well as between competitor orientation and customer satisfaction. Although competitor orientation has a slightly stronger impact on customer satisfaction than customer orientation does, it only has an indirect relationship with customer retention through customer satisfaction. The findings illustrated the effects of the three components of market orientation on customer relationship outcomes within manufacturing-centred firms, and provided managerial implications to industrial manufacturers on market orientation implementation strategies in regard to successful B2B customer relationship management.
Another study has reviewed to explore the impacts of client relationship administration (CRM) rehearses on consumer loyalty and firm execution in business-to business (B2B) markets. A model is proposed and experimentally tried through study information acquired from 113 Turkish B2B organizations. The outcomes demonstrate that CRM reception has a huge beneficial outcome on both consumer loyalty and hierarchical execution in B2B settings. CRM reception is likewise found to impact hierarchical promoting execution fundamentally, yet not money related execution. Also, the comes about uncover that upgraded buyer loyalty prompts better hierarchical execution in B2B association. Ecological dynamism and rivalry was found to have a negative directing impact on connection between buyer loyalty and hierarchical execution [20]
paper talks about only few factors have implements CRM strategy [9].There are lots of structured and unstructured data available in the company and how it must be used. This helps in the integration of the various types of data. The decisions are also affected due to the lack of use of data properly. The paper talks about the integrated research technique to solve the problem in CRM ([5]. There exists a problem of thedepletion of the customer trust and how they perceive themselves. Fairness, honesty and transparency are considered important for the better CRM use and to avoid misuse of CRM. These problems can countered by implementing strategic CRM techniques. Assessing the benefits of introducing Customer Relationship Management concept in banking sector, by defining strategies, adjustment of organizational structure, culture and internal processes with help of modern technology [12]. In today's business environment, organisations have to identify customers and to adjust their offering to meet customer`s needs, in order to maximize profits. Using modern technologies, Customer Relationship Management is becoming a method to maintain existing structure and development of high quality customer base. It involves development of marketing strategy through a better understanding of the entire customer base, understanding needs and attitudes of customers, as well as more efficient consideration of profitability and added value that each customer have for the organisation. CRM allows organisations to identify, segment, communicate and build long-term relationships with customers on individual basis. The paper presents methods of measuring success of Customer Relationship Management concept and problems which banks have when implementing a new business philosophy.
SERVICE QUALITY: AN ENTITY FOR AN ORGANISATION
[7]recommended that the view of service quality by clients amid benefit conveyance will be impacted for the most part by two elements: technical quality (what the provider conveys); and functional quality (how the provider conveys). Technical quality mirrors the result of the administration demonstration, or what clients encounter amid the administration experience, while functional quality is characterized as the clien ts' impression of the collaborations occurring amid the conveyance of the service. Parasuraman et.al [15] expressed that service quality ought to be assessed while giving the service, and that service quality is the level of pleasure the client encounters amid the utilization procedure. They advance contended that purchasers assess service quality utilizing comparable criteria, which can be assembled into five measurements: tangibility; reliability; responsiveness; assurance; and empathy. These five measurements, alongside 22 benefit things, yield the SERVQUAL scale for measuring service quality, and numerous past investigations on benefit quality have been created around this scale [11]; [19]. Rust and Richard [14] offered three dimensions – the service product (i.e. technical quality), the service delivery (i.e. functional quality), and the service environment components of service quality. Brady and Cronin proposed thatservicequality estimation comprises ofinteraction quality, physical environment quality, and outcome quality. All the more particularly, connection quality comprises of state of mind, conduct, and mastery; physical environment quality includes surrounding conditions, outline, an d social elements; and result quality is made out of holding up time, effects, and valence[21].
In spite of the fact that the basic variables for upgrading service quality have been recognized in past examinations, few have particularly investigated KMC regardless of the way that it dramatically affects service quality. Fathoming the fundamentals for improving service quality present study can give valuable service bits of knowledge into creating successful procedures that enable organisations to hold customers[10].
COMMUNICATION AND ITS EFFECT ON CRM
spending more time on the internet (12.2 hours per week) than watching television (10.6 hours per week) a trend that has continued.
Technological Advancements in Communication
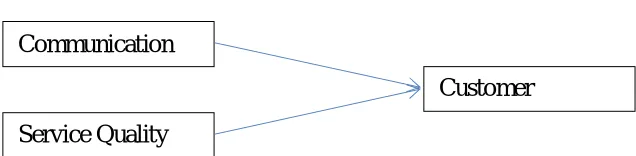
Google assumed a noteworthy part in the change of the customer by its democratization of data. The capacity to utilize a uninhibitedly accessible device to look several millions to billions of recorded pages in under a moment wiped out the requirement for what had been costly inquiry items whose cost was well past the range of the common customer. Anybody approached unbelievable measures of data whenever readily available in a configuration that, while not attractive, was straightforward. The exponential development of web look, with Google alone has achieved almost 500 million one of a kind guests in simply the long stretch of November 2007, was a huge marker of exactly how much this change had influenced an amazingly extensive piece of the populace. Nicholas Carr, in The Atlantic of July/August 2008, rewording Marshall McLuhan, properly calls attention to that while the web is turning into an all-inclusive medium for data gathering, it isn't only an inactive channel of thought, yet in addition shapes the procedure of thought [2]. Its impact on customer was to make more intelligent customers with simple access to data that inevitably could – and would – be shared. Figure 2 shows the proposed model by the author.
a. PROPOSED MODEL
Fig 2. Authors Model
III. RESEARCH METHODOLOGY
STATEMENT OF THE PROBLEM:
In today’s growing competition in sheet metal industry, there is excessive requirement for the CRM. Often it is seen that there will be a traditional marketing team which is handling CRM which never gives a deep insight in the CRM, which can become a problematic to the corporation to hold and to preserve a good connection with the customers. CRM in sheet metal industries can be a serious factor for the triumph in maintaining decentassociation with the patrons. Though there are great marketing efforts in sheet metal industries, it’s surprising to see that around is a noteworthy lagging behind in research literature in patronrelationship in sheet metal industries. Henceforth here is a big investigation gap in researching in the ground of CRM particularly insheet metal industry. The learning on the significant variables that impact the CRM in the sheet metal industry canadd value to company’s offering and can improve the inexpensive advantage.
SCOPE OF THE STUDY
It comprises of studying the effect of significant variables on CRM. In this study we have chosen communication and product and service quality as two variables. This study is being done to comprehend how the industry people ponder about the influence of CRM with respect to two variables considered. The study is also analyses how the clients of the company think about the impact of the above considered variables.
Communication
Service Quality
OBJECTIVES OF THE STUDY
To understand the overview of sheet metal industry
To study the impact of variables on CRM of different stake holder
HYPOTHESES
HYPOTHESES STATEMENT FOR THE COMPANY POINT OF VIEW.
H0: There is no impact of significant variables on CRM.
H1: There is impact of significant variables on CRM.
HYPOTHESES STATEMENT FOR THE CUSTOMER POINT OF VIEW.
H0: There is no impact of significant variables on CRM.
H1: There is impact of significant variables on CRM.
SAMPLING
Here the sampling population is specific to manufacturers, suppliers of sheet metal components, the significant variables which has an impact on CRM is selected. It is proposed to approach 120 respondents belonging to the above categories of firm, which would be representative of the population
DATA COLLECTION
Primary data has been collected using a structured and focused questionnaire; which covered various dimensions of the research questions. Convenient sampling technique was used to collect data for the research. While, secondary data has been collected from books, internet, literature and other relevant documents. Magazines, Journals, and Web resources, online libraries and websites are other sources.
DATA ANALYSIS &SOFTWARE USED.
Hypothesis are made using the data and data analysis is being done using the statistical methods such as KMO measure of sampling adequacy and Bartlett’s Test of Sphericityhas been conducted to identify the Communalities of the items used in the variable. ANOVA analysis, which is performed to study the Communication and service quality related specific to company as well as customers. Pearson Correlation analysis was conducted between Communication and Product and Service Quality to assess the relationship between the study variables.
IV. STATISTICAL TECHNIQUES
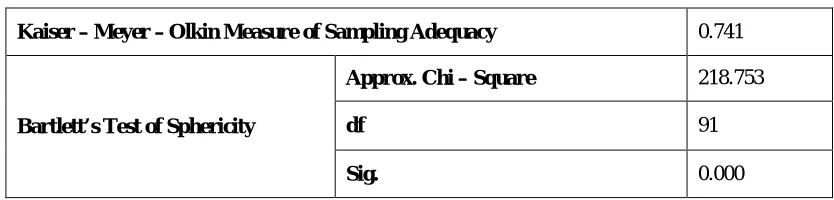
Table 1 KMO Measure of Sampling Adequacy and Bartlett’s Test of Sphericity for Company Survey
Kaiser – Meyer – Olkin Measure of Sampling Adequacy 0.741
Bartlett’s Test of Sphericity
Approx. Chi – Square 218.753
df 91
Sig. 0.000
From table 1, KMO value is 0.741 which is above 0.6 making the data sample suitable for ‘Factor Analysis’. Also, significance level (p) is 0.000 which is less than 0.05, making the factor analysis valid. As p < 0.05, we reject null hypothesis (H0) and accept the alternate hypothesis (H1) that there may be statistically significant interrelationship
As per the ‘Principal Component Analysis’ 5 questions out of 14 which have an Eigen value of more than 1 which indicates that the 5 questions explain 66.7% of variance.
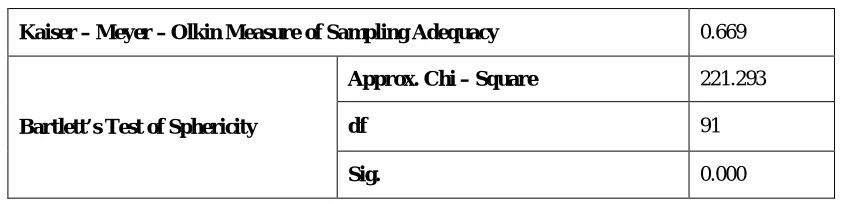
Table 2 KMO Measure of Sampling Adequacy and Bartlett’s Test of Sphericity for Customer Survey
Kaiser – Meyer – Olkin Measure of Sampling Adequacy 0.669
Bartlett’s Test of Sphericity
Approx. Chi – Square 221.293
df 91
Sig. 0.000
From table 2 KMO value is 0.669 which is above .6 making the data sample suitable for the ‘Factor Analysis’. Also, the significance level (p) is .000 which is less than 0.05, making the factor analysis valid. As p < 0.05, we reject the null hypothesis (H0) and accept the alternate hypothesis (H1) that there may be statistically significant interrelationship
between the variables.
Communalities for Company Survey Initial Extraction
1. The company divides customers into distinct segments and provides communication to
meet the needs of each segment. 1.000 0.585 2. The communication with the customers is done such that it provides them with all relevant
information they need. 1.000 0.6200 3. As a result of constant and consistent communication with customers, customer
relationships are managed effectively. 1.000 0.588
4. The company treats communication as a strategic tool. 1.000 0.703
5. The company ensures that all its strategies are designed to maximise effective
communication to retain the customer. 1.000 0.714 6. The company treats product and service quality as an important tool for Customer
Relationship Management. 1.000 0.637 7. Product and service quality is measured through feedback from customers. 1.000 0.802 8. Results of the product and service quality surveys are communicated to all staff.
1.000 0.687
9. The company takes steps to address problems identified through product and service
related feedbacks. 1.000 0.765 10. The company focusses on product and service quality to retain customers. 1.000 0.654 11. Performance of Sales and Account Representatives is measured based on how satisfied
the customers are rather than purely on achieving sales target. 1.000 0.497 12. Training staff for improving product and service quality is an important priority for the
company 1.000 0.758
13. The company website communicates all the information needed by the customers 1.000 0.732
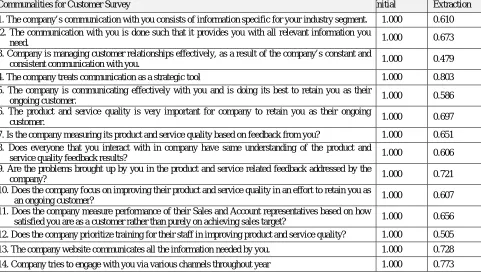
As per the ‘Principal Component Analysis’ 5 questions out of 14 which have an Eigen value of more than 1 which indicate that the 5 questions explain 64.9% of the variance.
The one-way analysis of variance (ANOVA) is used to determine whether there are any statistically significant differences between the means of three or more independent (unrelated) groups.
Here ANOVA analysis is done to understand whether there is statistically significant difference between our group means.
Table 3 One-Way ANOVA of Communication Variable by Employee Category
Sl. No. Null Hypothesis Level of Significance F – value P – Value Accepted/ Rejected
01
Communication response and employee category are independent
5% 75.892 0.000
Null hypothesis is rejected & Alternate hypothesis is Accepted
H0: Communication response and employee category are independent.
H1: Communication response and employee category are dependent.
Thus we reject the null hypothesis and accept alternate hypothesis that communication response and employee category are dependent on each other.
To know more in detail on which specific groups differed, Turkey Post Hoc test was done and it indicates that there is significantly more difference between Worker and Management groups than Worker and Supervisor groups and Supervisor and Management groups.
Thus it can be said that Management’s reponses show that company is using communication as a tool for improving CRM which is significantly different than worker’s responses.
Communalities for Customer Survey Initial Extraction
1. The company’s communication with you consists of information specific for your industry segment. 1.000 0.610 2. The communication with you is done such that it provides you with all relevant information you
need. 1.000 0.673
3. Company is managing customer relationships effectively, as a result of the company’s constant and
consistent communication with you. 1.000 0.479
4. The company treats communication as a strategic tool 1.000 0.803 5. The company is communicating effectively with you and is doing its best to retain you as their
ongoing customer. 1.000 0.586
6. The product and service quality is very important for company to retain you as their ongoing
customer. 1.000 0.697
7. Is the company measuring its product and service quality based on feedback from you? 1.000 0.651 8. Does everyone that you interact with in company have same understanding of the product and
service quality feedback results? 1.000 0.606
9. Are the problems brought up by you in the product and service related feedback addressed by the
company? 1.000 0.721
10. Does the company focus on improving their product and service quality in an effort to retain you as
an ongoing customer? 1.000 0.607
11. Does the company measure performance of their Sales and Account representatives based on how
satisfied you are as a customer rather than purely on achieving sales target? 1.000 0.656 12. Does the company prioritize training for their staff in improving product and service quality? 1.000 0.505
13. The company website communicates all the information needed by you. 1.000 0.728
Table 4One-Way ANOVA of Communication Variable by Customer Category
Table 5 One-Way ANOVA of Product and Service Quality Variable by Employee Category
Sl. No. Null Hypothesis Level of Significance F – value P – Value Accepted/ Rejected
02
Communication response and customer location are independent
5% 47.231 0.000
Null hypothesis is rejected & Alternate hypothesis is Accepted
H0: Communication response and customer category are independent.
H1: Communication response and customer category are dependent.
From table 3 We can see that significance value is 0.000 (i.e., p = .000), which is below 0.05, therefore, there is a statistically significant difference in the mean value of communication between the various types of customers based on proximity. Thus, we reject the null hypothesis and accept the alternate hypothesis that communication response and customer location are dependent on each other. Turkey Post Hoc test results depicted that the company is doing a good job of using communication as a tool for improving CRM which is significantly different than customers who are located in states outside Karnataka.
Sl. No. Null Hypothesis Level of Significance F – value P – Value Accepted/ Rejected
03
Product and service quality response and employee category are independent
5% 31.259 0.000
Null hypothesis is rejected & Alternate hypothesis is Accepted
H0: Product and service quality response and employee category are independent
H1: Product and service quality response and employee category are dependent
From the above table 4 we can infer that there is a statistically significant difference in the mean value of communication between the various types of employee category. Turkey Post Hoc test results depicted that the company’s product and service quality are great which in turn helps at improving CRM which is significantly different than workers’ responses.
Sl. No. Null Hypothesis Level of Significance F – value P – Value Accepted/ Rejected
04
Product and service quality response and customer category are
independent
5% 52.487 0.000
Null hypothesis is rejected & Alternate hypothesis is Accepted
H0: Product and service quality response and customer category are independent
H1: Product and service quality response and customer category are dependent
One-Way ANOVA of Product and Service Quality Variable by Customer Category
Table 6 Independent Samples Test (Employee Categories) - t-test for Equality of Means
Sl. No. Null Hypothesis Category Level of
Significance t – value Df
Sig. (2 - tailed)
01
Communication
response and employee category are independent
Supervisor and Worker
5% 8.217 38 0.000
02
Supervisor and
Management
5% 2.697 38 0.100
03 Worker and
Management 5% 12.849 38 0.000
From table 6, it is seen that Independent T-Test confirms that One-Way ANOVA analysis that we can reject null hypothesis and accept the alternate hypothesis that communication response and employee category are dependent on each other. The t-value confirms that there is significant difference between Worker’s response and Management’s response (12.8) than Management and Supervisor groups (2.6) or Workers and Supervisors groups (8.2).
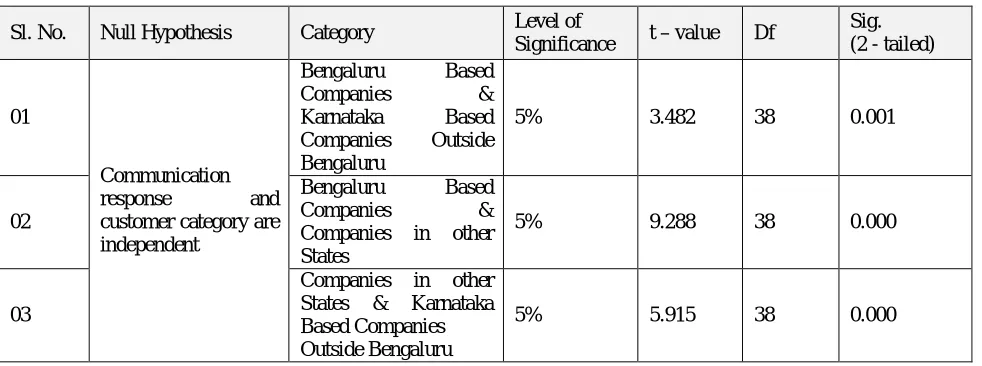
Table 7 Independent Samples Test (Customer Categories) - t-test for Equality of Means
Sl. No. Null Hypothesis Category Level of
Significance t – value Df
Sig. (2 - tailed)
01
Communication response and customer category are independent
Bengaluru Based Companies & Karnataka Based Companies Outside Bengaluru
5% 3.482 38 0.001
02
Bengaluru Based Companies & Companies in other States
5% 9.288 38 0.000
03
Companies in other States & Karnataka Based Companies Outside Bengaluru
5% 5.915 38 0.000
Table 8 Independent Samples Test (Employee Categories) - t-test for Equality of Means
Sl. No. Null Hypothesis Category Level of
Significance t – value Df
Sig. (2 - tailed)
01
Product and service quality response and employee category are independent
Supervisor and Worker
5% 5.119 38 0.000
02
Supervisor and
Management
5% 2.340 38 0.025
03 Worker and
Management 5% 7.516 38 0.000
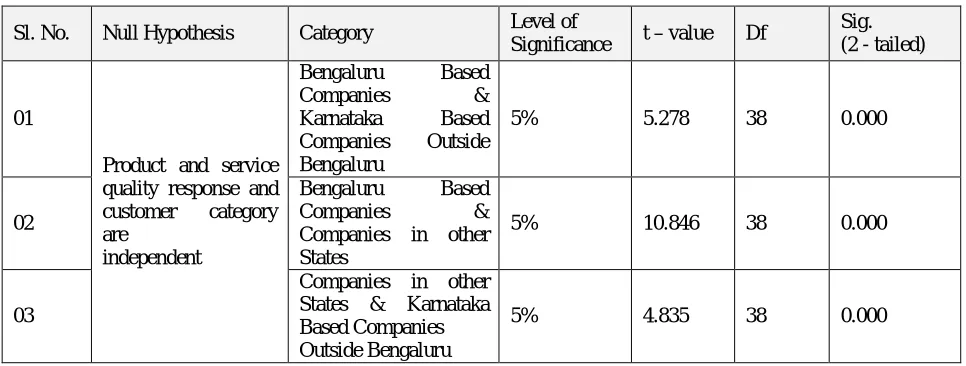
Table 8 represents Independent T-Test confirms that One-Way ANOVA analysis that we can reject the null hypothesis and accept the alternate hypothesis that product and service quality response and employee category are dependent on each other. The t value confirms that there is significant difference between the Worker’s response and Management’s response (7.5) than Management and Supervisor groups (2.3) or Workers and Supervisors groups (5.1).
Table 9 Independent Samples Test (Customer Categories) - t-test for Equality of Means
Sl. No. Null Hypothesis Category Level of
Significance t – value Df
Sig. (2 - tailed)
01
Product and service quality response and customer category are
independent
Bengaluru Based Companies & Karnataka Based Companies Outside Bengaluru
5% 5.278 38 0.000
02
Bengaluru Based Companies & Companies in other States
5% 10.846 38 0.000
03
Companies in other States & Karnataka Based Companies Outside Bengaluru
5% 4.835 38 0.000
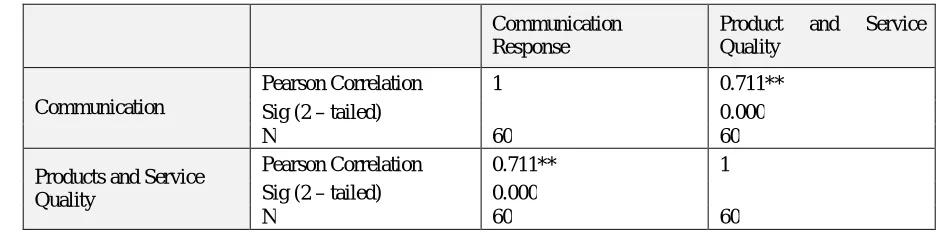
Table 10 Pearson Correlation between Communication and Product and Service Quality
Communication Response
Product and Service Quality
Communication
Pearson Correlation 1 0.711** Sig (2 – tailed) 0.000
N 60 60
Products and Service Quality
Pearson Correlation 0.711** 1 Sig (2 – tailed) 0.000
N 60 60
**. Correlation is significant at the 0.01 level (2-tailed).
From Table 10 It can be inferred that the Pearson Correlation is 0.711 which is statistically significant. It can also be seen that the Communication increases with Product and Service Quality and vice versa. Since value of Pearson Correlation is positive it means that as one the value of one variable increases value of the other variable also increases. It can be inferred that communication is better with increased product and service quality and that product and service quality is better with improved communication.
V. FINDINGS OF THE STUDY
1. The customers and company employees both agree that company is doing a good job in communicating to customers, information which is specific to industry segment they belong it.
2. Majority of the employees and customers agree that communication with customers is done in such a way that it includes all relevant information needed by them.
3. Company and customers are completely aligned when it comes to communication being used as a strategic tool. One of the reasons that the communication of company is rated well might be because of them having communication in their company strategy itself.
4. Most of company employees and the customers feel that company is communicating effectively with customers and is doing their best to retain them as an ongoing customer, but there is still a scope for improvement.
5. There is a discrepancy between customers’ response and employees’ response. The customers feel more positively about product and service quality and its importance for of the customer in order to improve the customer relation management and to retain customers.
6. The company strongly believes that they focus on product and service quality to help retain the customer whereas customers’ feedback falls more into the agree-neutral bucket. This means that although the company is doing a good job on this, it still has scope for improvement.
7. The company and customers believe that the company prioritizes training for their staff in improving product and service quality.
8. One-Way ANOVA helped clearly identify that more significant difference between workers and management group’s response thanks workers and supervisors group or the supervisors and management group.
9. Similarly One-Way ANOVA also helped determine that there is a significant differencebetween response of a Bengaluru based company and a company based outside ofKarnataka state than a Bengaluru based company and a Karnataka based company or aKarnataka based company and a company based outside Karnataka.
VI. CONCLUSIONS
In most of the communication and product and service quality responses the company and the customers have the same or similar viewpoint. As the study focused on Customer Relationship Management, the survey questionnaire helped the company to understand the strength and area of customer perception toward the company.
The analysis of the results helped to realise the gap betweenthe different types of employees and different types of companies as well. This study also facilitated the company an eye-opening insight into details around communication and product and service quality. There is a vast difference in the perception of different stake holder across the state and nationwide when it comes to communication. The customer’s viewpoints discovered as part of this study can be converted into strategicgoals leading to a better satisfied and engaged customer and eventually leading to morerevenue. Word of mouth marketing will also improve as and when we have more engaged and satisfied customer.
REFERENCES
[1]. Bose, R. (2002). Customer relationship management: key components for IT success. Industrial management & Data systems, 102(2), 89-97.
[2]. Carr, N. G. (2008). The big switch: Rewiring the world, from Edison to Google. WW Norton & Company.
[3]. Chen, I. J., &Popovich, K. (2003). Understanding customer relationship management (CRM) People, process and technology. Business process management journal, 9(5), 672-688.
[4]. Dimitriadis, S., & Stevens, E. (2008). Integrated customer relationship management for service activities: an internal/external gap model. Managing Service Quality: An International Journal, 18(5), 496-511.
[5]. Fatudimu, I. T., Uwadia, C. O., & Ayo, C. K. (2012). Improving Customer Relationship Management through Integrated Mining of Heterogeneous Data. International Journal of Computer Theory and Engineering, 4(4), 518.
[6]. Fazlzadeh, A., Tabrizi, M. M., &Mahboobi, K. (2011). Customer relationship management in small-medium enterprises: The case of science and technology parks of Iran. African Journal of Business Management, 5(15), 6159.
[7]. Grönroos, C. (1994). From scientific management to service management: a management perspective for the age of service competition. International Journal of Service Industry Management, 5(1), 5-20.
[8]. HighBeamBusiness, IBIS World, the Bureau of Labor Statistics of the U.S. Department of Labor, and the U.S. Census Bureau’s Annual Survey of Manufacturers, 2014,.
[9]. Kenyon, J., &Vakola, M. (2003). Customer relationship management: a viable strategy for the retail industry. International Journal of Organization Theory and Behavior, 6(3), 329.
[10]. Knowledge management capability, customer relationship management, and service quality Shu-Mei TsengJournal of Enterprise Information Management 2016 29:2, 202-221
[11]. Kuo, Y. F., Wu, C. M., & Deng, W. J. (2009). The relationships among service quality, perceived value, customer satisfaction, and post-purchase intention in mobile value-added services. Computers in human behavior, 25(4), 887-896.
[12]. Marko Laketa, DusicaSanader, Luka Laketa, and ZvonimirMisic. 2015. Customer Relationship Management: Concept and Importance for Banking Sector. UTMS Journal of Economics 6 (2): 241–254
[13]. Nguyen, B., &Mutum, D. S. (2012). A review of customer relationship management: successes, advances, pitfalls and futures. Business Process Management Journal, 18(3), 400419.
[14]. Oliver, R. L., & Rust, R. T. (Eds.). (1994). Service quality: New directions in theory and practice. Sage.
[15]. Parasuraman, A., Zeithaml, V. A., & Berry, L. L. (1985). A conceptual model of service quality and its implications for future research. the Journal of Marketing, 41-50.
[16]. Ryals, L., & Knox, S. (2001). Cross-functional issues in the implementation of relationship marketing through customer relationship management. European management journal, 19(5),534-542.
[17]. Tseng, S. M. (2016). The effect of knowledge management capability and customer knowledge gaps on corporate performance. Journal of Enterprise Information Management, 29(1), 51-71.
[18]. Wang, Y., Po Lo, H., Chi, R., & Yang, Y. (2004). An integrated framework for customer value and customer-relationship-management performance: a customer-based perspective from China. Managing Service Quality: An International Journal, 14(2/3), 169-182. [19]. Yee, R. W., Yeung, A. C., & Cheng, T. E. (2010). An empirical study of employee loyalty, service quality and firm performance in the
service industry. International Journal of Production Economics, 124(1), 109-120.
[20]. Zeynep Ata, U., &Toker, A. (2012). The effect of customer relationship management adoption in business-to-business markets. Journal of Business & Industrial Marketing, 27(6), 497-507.
[21]. Cronin, J. J., Brady, M. K., &Hult, G. T. M. (2000). Assessing the effects of quality, value, and customer satisfaction on consumer behavioral intentions in service environments. Journal of retailing, 76(2), 193-218.