ABSTRACT
SHAHARIAR, HASAN. Process Engineering & Materials Characterization for Printing Flexible and Durable Passive Electronic Devices on Nonwoven. (Under the direction of Dr. Jesse S. Jur).
This thesis has focused on processing of conductive materials to printing passive electronics on porous fibrous substrates. The fundamental structure-property relationship and process-property relationship are analyzed to define the three-dimensional resolution of the conductive ink in the fibrous nonwoven structure. Two fundamentally very different types of printing process have been adopted for this research. A contact-based screen-printing and drop-on-demand based direct-write process are studied thoroughly to define the ink microstructure embedded in the fiber mats. Inkjet printing of conducive metal inks on fibrous substrates has been compared as a very different form of DoD direct-write process with low viscosity ink (below 10cps).
We have first established the process of selecting a nonwoven substrate for printing high-resolution device like a co-planar waveguide. Then, the screen-printing process parameters (screen openness) has been optimized to fabricate printed patterns with high resolution (~150 microns) and conformal ink thickness. The device performance has been correlated with the 3-D print resolution. Additionally, we have also presented a novel structure and packaging of a screen-printed porous patch antenna with enhanced air-permeability, flexibility, and durability.
Next, to that, this work describes the customized direct-write printing process for printing traces on porous, rough substrates with very high throughput. A detailed correlation of ink viscosity, fluid pressure, dispensing speed has been established and correlated with the 3D ink micro-structures. This structures on different substrates conform differently which significantly affect the durability of devices. We have found that the through-plane flow of conductive ink (viscosity ~ 15000 cps) for calendared PET needle-punched nonwoven is very strong due to strong capillary flow. The porous fibers structure and the absorbed ink layer make a stable composite and conductive structure which enhance the device performance significantly.
the fiber diameter was larger than the ink droplet size (65 microns). For the substrates with small fibers, the ink concentrates on the edge and junction of the fibers. At last, we have developed an ink-receptive coating, which can be easily applied on any porous textile, plastic, and paper substrates for inkjet printing particle free reactive silver ink on inkjet printing process.
© Copyright 2018 Hasan Shahariar
Process Engineering & Materials Characterization for Printing Flexible and Durable Passive Electronic Devices on Nonwoven
by Hasan Shahariar
A dissertation submitted to the Graduate Faculty of North Carolina State University
in partial fulfillment of the requirements for the degree of
Doctor of Philosophy
Fiber and Polymer Science
Raleigh, North Carolina
2018
APPROVED BY:
_______________________________ _______________________________ Jesse S. Jur Behnam Pourdeyhimi
Committee Chair
ii DEDICATION
iii BIOGRAPHY
Hasan Shahariar was born on November 25, 1988, in Bangladesh He has been brought up at the capital of Bangladesh Dhaka. After completing higher secondary school education with a background in science, he joined at the Bangladesh University of Textiles to pursue Bachelor of Science in Textile Engineering. He finished the degree in 2011. He was involved in research during this senior year in the field of mechanics of fabric structure to define the dimensional stability. He joined as a lecturer in Southeast University in Bangladesh in Faculty of Engineering. After a year of service, he came to the United States to peruse higher education in the field soft materials. In Spring 2013, he joined the Textile Engineering, Chemistry and Science (TECS) department in the world’s best-known textile college, the NC State College of Textiles. He
researched the "Fabrication of Ceramic Micro-fibers utilizing in situ Photo-crosslinking of Reactive Siloxane Polymers" in the Master’s program in Textile Engineering under the direction
of Dr. Saad A. Khan and Dr. Russel Gorga. He also did the internship in International ThermoDyne, LLC and worked on fabricating organic thermoelectric device during the MS program. Having research interests in the field of soft-materials and printed electronics, he had the chance to join Dr. Jesse Jur’s group to pursue Ph.D. in Fiber and Polymer Science in the same
department. He started working in printed electronics field to build up novel printing system and device of fibrous substrates. He also interned in Mann+Hummel, USA for developing chipless RFID tag sensor for monitoring the health of air-filter.
iv ACKNOWLEDGMENTS
First of All, I would like to admire the Almighty for the blessing to get the opportunity to continue my education with good health. I also would like to convey my gratitude to my advisor, Dr. Jesse Jur for his constant support. He has been very generous in giving me time, invaluable guidance and many precious recommendations. Many thanks to my committee members who were also my teachers: Dr. Behnam Pourdeyhimi, Dr. Jacob Admas, and Dr. Minyoung Suh. All of them have been very generous in providing me valuable advice on my research work and letting me use their laboratories.
I would like to send my appreciation to The Nonwoven Institute for providing intellectual and financial support throughout my journey in this research. Additionally, I owe special thanks to my industrial advisor, Andreas Scope, for his encouraging support.
The staffs and researchers at College of Textiles and AIF have helped me during my study. My special thanks go to Judy Elson and Birgit Andersen for many pieces of training and assistance they provided me. Thanks to Mr. Charles Mooney in AIF for training me on SEM analytical system.
I would like to thank from the heart to all my colleagues at Dr. Jesse Jur's lab. Special thanks to Henry Soewardiman and Raj Bhakta for their continuous help in many of my experiments. I would also like to thank Inhwan Kim for his help in bending test and thoughtful suggestion.
I appreciate the continuous support of my wife during my degree program. She has been with me with all ups and downs and taking care my little son. Without her support, I would not even think about continuing my research and education.
v TABLE OF CONTENTS
LIST OF TABLES ... xi
LIST OF FIGURES ... xii
Motivation of research ... 1
Literature review ... 2
Manufacturing processes of nonwoven materials ... 4
Advantage of printing process over other metallization techniques ... 6
Screen printing and the state-of-the-art ... 7
Characteristic of ink or paste required for screen printing process ... 11
Screen printing conductive patterns on textile and nonwoven fabrics ... 11
General ink-jet printing process ... 13
Ink-jet printing on porous substrate ... 15
Ink-jet printing on non- porous substrate ... 17
Ink-jet printing on textured surface ... 19
Preparation of conductive ink for inkjet printing ... 20
Sintering process of inkjet-printed conductive ink ... 24
Direct-write printing process ... 26
Properties of ink in direct-writing printing ... 27
Contact printing processes ... 28
Gravure printing ... 29
Flexographic printing ... 29
Research Methodology ... 31
vi
Abstract ... 42
Research highlights ... 42
Keywords ... 42
Introduction ... 43
CPW Design ... 45
Simulation and Experimental Process ... 47
Materials characterization of printed CPWs ... 48
Electrical & RF characterization of printed CPWs ... 48
Result and discussion ... 49
Printing resolution ... 49
Analysis of RF characteristic of CPW ... 53
Return loss and Insertion loss of CPWs ... 56
Conclusion ... 58
Acknowledgements ... 59
References ... 60
Abstract ... 62
Keywords ... 63
Introduction ... 63
Experimental ... 65
Antenna Measurement ... 66
Result and discussion ... 66
vii
Simulated Antenna Bending ... 70
Antennas tested on-body ... 73
Effect of washing on antenna performance ... 74
Antenna responses after wetting ... 76
Conclusion ... 78
Acknowledgement ... 79
References ... 80
Supplementary Document ... 84
Weight loss % of wet antennas during air-drying process ... 84
Washing test of solid antenna without encapsulation ... 85
Abstract ... 87
Keywords ... 87
Introduction ... 88
Principles of direct-write printing ... 91
Ink Rheology ... 92
Ink-to-Textile Interaction ... 93
Optimization of the Direct-write Process ... 94
Experimental Methods ... 95
Substrate ... 95
Printing Process ... 96
SEM Characterization ... 98
Sheet Resistance Measurement ... 98
viii
Results and discussion ... 98
Parameter definition for direct-write of electronic patterns ... 98
Ink penetration and spreading on the textile ... 99
Durability ... 103
Applications ... 104
Printed Heater ... 104
Meshed patch antenna on textiles ... 106
Conclusion ... 108
Acknowledgment ... 109
References ... 110
Abstract ... 113
Keywords ... 113
Introduction ... 113
Materials and experimental details ... 115
Surface properties of the substrates ... 115
Direct-write printing and packaging of printed heaters ... 116
Characterization of heating performance and durability of printed heaters ... 116
Result and discussion ... 117
Conductive ink-to-substrate interaction ... 117
Thermal response of printed heater ... 118
Durability analysis of printed heater ... 120
Wearable on-body application ... 123
ix
Acknowledgement ... 126
References ... 127
Abstract ... 129
Introduction ... 129
Experimental Procedure ... 130
Result and Discussion ... 132
Conclusion ... 134
Reference ... 135
Abstract ... 136
Keywords ... 136
Introduction ... 137
Experimental ... 138
Substrates ... 138
Reactive Silver Ink ... 139
Inkjet printing process ... 139
Characterizations ... 140
Result and Discussion ... 140
Sheet Resistances ... 145
Conclusion ... 145
Acknowledgement ... 146
x
Abstract ... 150
Keywords ... 150
Introduction ... 150
Materials ... 151
Substrates ... 151
Ink ... 152
Experimental ... 152
Coating formulation for reactive particle free silver ink ... 152
Inkjet printing process ... 154
Characterization ... 155
Result and Discussion ... 155
Summary ... 158
Acknowledgement ... 158
References ... 160
Appendix A ... 165
Effect of nonwoven surface profile on the 3D resolution analysis of screen printed conductive pattern ... 165
Appendix B ... 176
xi LIST OF TABLES
Table 1-1: Proposed design of experiments to answer the research question Q1. ... 32
Table 1-2: Proposed design of experiments to answer research question Q2. ... 33
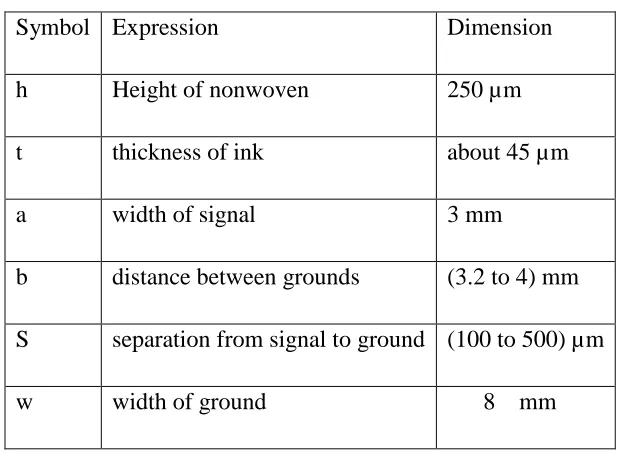
Table 2-1: Dimensions of printed CPWs ... 47
Table 3-1: Stiffness and air-permeability of textile antennas ... 70
Table 4-1: Process variables for the direct-write process on textile. ... 97
Table 4-2: Effect of process parameters on printing properties. ... 103
Table 4-3: Line resolution and electrical properties of the printed heaters. ... 105
Table 5-1: Surface characteristic of the substrates used for printing. ... 119
Table 6-1: Surface profile of needle-punched PET nonwoven laminated fabrics ... 130
Table 7-1: Characteristics of reactive Ag ink used for inkjet printing ... 139
xii LIST OF FIGURES
Figure 1-1: Drylaid process of manufacturing nonwoven fabric.
(https://www.edana.org/discover-nonwovens/how-they're-made/formation) ... 5
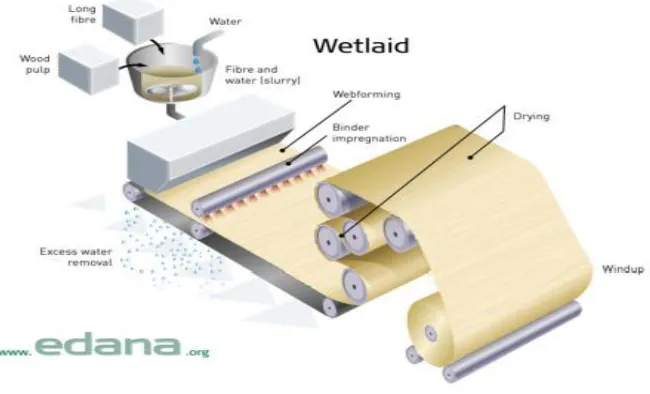
Figure 1-2: Wetlaid process of manufacturing nonwoven fabric.
(https://www.edana.org/discover-nonwovens/how-they're-made/formation) ... 5
Figure 1-3: Spunlaid process of manufacturing nonwoven fabric.
(https://www.edana.org/discover-nonwovens/how-they're-made/formation) ... 6
Figure 1-4: General classification of common printing procedures; redrawn from ref: 25. .... 7
Figure 1-5: Screen printing process (http://www.gwent.org/gem_screen_printing.html) ... 8
Figure 1-6: Maximum value of the product ƞ V as function of snap-off distance at (screen fabric: 325 mesh, 0.0011 in wire diameter).28 ... 10
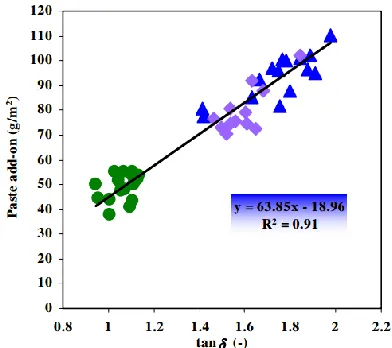
Figure 1-7: Shows the paste add-on percentage of screen-printing process with different values of viscoelastic loss tangent of the pastes.33 ... 11
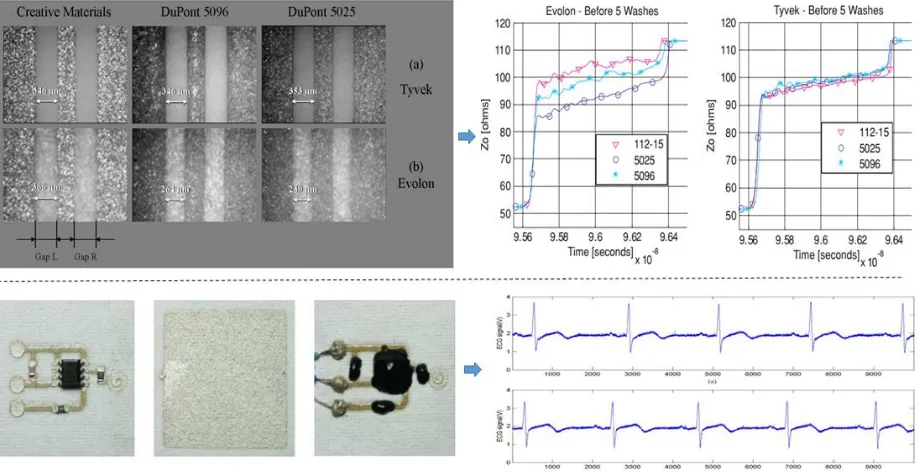
Figure 1-8: Screen printed coplanar wave guideline on different nonwoven with different conductive inks (Top left); the time scale variation of characteristic impedance of printed CPWs (Top right); 36 printed ECG electrodes on nonwoven
fabric (Bottom left); generated ECG signals by the printed sensors
(Bottom right) . 37 ... 13
Figure 1-9: Contact angle (θ_e) of a liquid (l) on solid (s) surface.38 ... 14
Figure 1-10: Water droplet (d = 80 μm) on SVF = 10, ca = 0, (a) df = 4 μm , t = 331.43 μs, (b) df = 8 μm , t = 194.06 µs, where df is denoted as fiber diameter. 40 ... 15
Figure 1-11: Images of drops of aqueous suspensions of nanoparticles impacting onto: (a) hydrophobic PTFE membrane, and (b) hydrophilic glass fiber membrane. The drops were issued from a 14G needle at the height of 180 cm, and had the
xiii Figure 1-12: Inkjet printed droplets of aqueous suspensions of silica particles on high
surface energy substrates (a), cleaned glass slides (b), and low energy
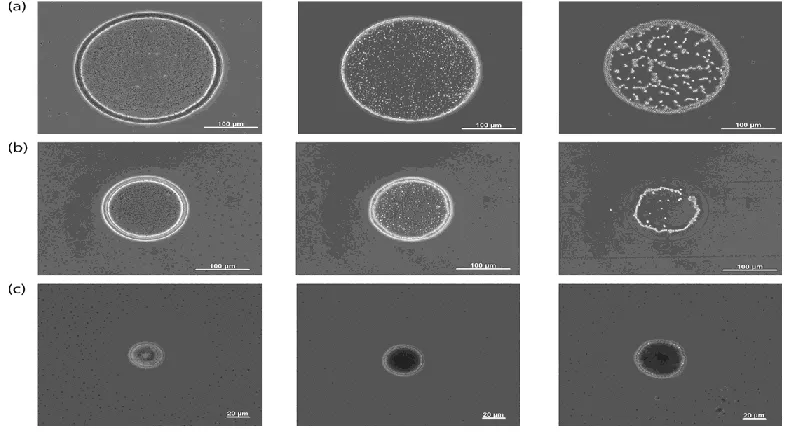
substrates (c). Each row shows, from left to right, a particle size of 0.33 mm, 1 mm and 3 mm, respective48 ... 18
Figure 1-13: (a) Set of depositions from dried water drops containing 0.5 wt % PS particles (d = 1330 nm) and different concentrations of SDS (indicated under
the pictures). The drops were evaporated on a hydrophilic microscope slide; the initial drop volume was ab49 ... 19
Figure 1-14: Sketch illustrating the details of 2Rm (jet spreading), 2Rs (lamella spreading), and Z-height for the spreading drop (left); the influence of We on the variation of the fractional liquid volume entrapped inside the grooves of the textured
substrate. 50 ... 20
Figure 1-15: Flow diagram and schematic illustration of Polyacrylic acid-capped Ag microparticle synthesis and surface modification by amidation reaction using 3-morpholinopropylamine (MPA) (Left ); and optical images of Ag
microparticle inks (6 wt%) in different solvents. (a) Polyacrylic acid-capped Ag microparticles before amidation and (b-c) amphiphilic Ag microparticles after amidation using initial ratios [NH2]/[COOH] of 0.1 and 1.0,
respectively (right) .62 ... 21
Figure 1-16: The mechanism for the dispersion and aggregation of the Ag
nanoparticles-based ink. This test was carried out to determine the proper
pH value of silver nanoparticle-based ink. 63 ... 22
Figure 1-17: Scheme of silver deposition on pre-heated textiles using inkjet printing. 66 ... 23
Figure 1-18: The left picture shows the test patterns printed on the different substrates with the same printing parameters.Best results were achieved on the stretchable latex substrate (with 6 layers); the right-side picture shows the photograph of printed conducting paths with Arduino Lili pad onto the
xiv Figure 1-19: Schematic of intense pulse light (left); SEM images of the surfaces of the
silver nanoink patterns: (a) before IPL applied (b) two consecutive pulses and (c) three consecutive pulses at 50 J/cm2, and (d) thermally sintered at
2000 C(right). 79 ... 25
Figure 1-20: This shows a schematic of the direct-write process with continuous pressure and drop on demand mode on the textile substrate. ... 26
Figure 1-21: (A) Schematic diagram illustrating omnidirectional printing and optical image of apparatus used (inset). (B) Transmission electron microscopy image of the synthesized silver nanoparticles and optical image of the concentrated ink (inset). (C) Shear elastic modulus as a function of shear
stress for silver nanoparticle inks of varying solids loading.87 ... 28
Figure 1-22: Schematic of roll to roll printing (A) Gravure Printing (B) Flexographic
printing (C) Rotary Screen Printing. 94 ... 29
Figure 1-23: Graphs showing maximum values reported for speed of printing and print
resolution from literature. 25 ... 30
Figure 2-1: Cross section illustration of a CPW; B) CPW designed in the HFSS
simulation environment; C) CPW fabricated on nonwoven under torsion; D) Complete fabricated CPW with an SMA connector at each end of the CPW. ... 45
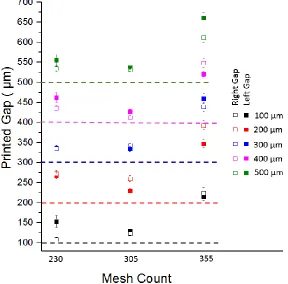
Figure 2-2: Optical microscope images of gaps between signal and ground of a CPW with 200 µm target gap widths made using A) 230, B) 305, and
C) 355 mesh count screens. ... 49
Figure 2-3: Analysis of gap widths of printed CPWs for different resolutions (100µm to 500µm). Legends colored as black, red, blue, magenta and green represent the measured printed gap targeted for 100 µm, 200 µm, 300 µm, 400 µm and 500 µm gap width, respectively. The filled legends represent left gap and the empty legends represent the right gap of the printed coplanar
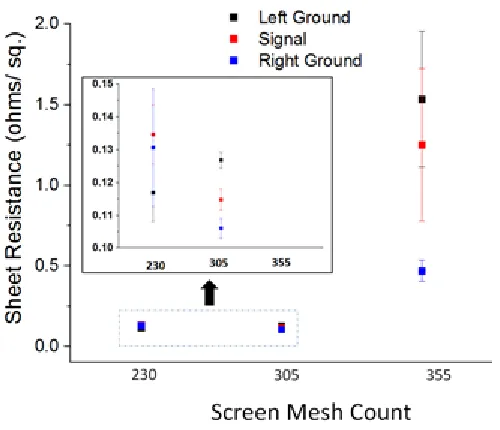
xv Figure 2-4: Average DC resistance and standard deviation of CPW signal lines for
samples printed with screens of 230, 305 and 355 mesh counts. ... 51
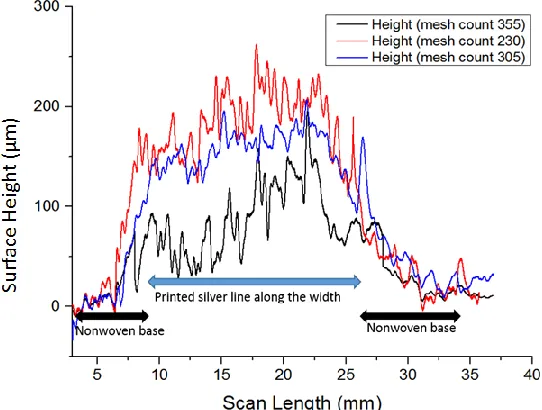
Figure 2-5: Surface roughness analysis of CPWs printed with screens of different mesh counts ... 52
Figure 2-6: SEM cross-section images of CPW lines printed with (A) 230 mesh count
(B) 305 mesh count and (C) 355 mesh count screens ... 53
Figure 2-7: Simulated characteristic impedances of printed CPWs with varying
signal-to-ground gap widths. ... 54
Figure 2-8: Tunneling points for current flow from signal to ground indicates bleeding
of inks after printing... 55
Figure 2-9: TDR measurements shows the variation of characteristic impedance (Z0)
of CPWs with the change of gap width when printed with screens of
mesh count (A) 230; (B) 305 & (C) 355 respectively. ... 56
Figure 2-10: (A-D) Return loss or reflection coefficient of printed CPWs with different values of signal to ground gap (simulation & experimental results
are compared)... 57
Figure 2-11: Shows both simulation and experimental data on the insertion losses of
printed CPWs ... 59
Figure 3-1: Measurements (in mm) of the (a) solid patch and (b) porous patch antennas. (c) Layers of the screen printed porous patch antenna (the solid patch
antenna does not have holes in the conductive layers). ... 67
Figure 3-2: Simulated and measured reflection coefficient of (a) solid patch antennas
and (b) porous patch antennas in the ISM band. ... 68
Figure 3-3: Measured gain (scaled in dB) pattern in E-plane for (a) solid patch and
xvi Figure 3-4: Simulated antenna bending under radii of curvature of R1 = 21.16 mm, R2 =
17.52 mm, and R3 = 13.85 mm. A) Bending along the width direction. B)
Bending along the length direction. ... 70
Figure 3-5: Simulated reflection coefficient of solid patch antenna with -10 dB
bandwidth for (a) width bending and (b) length bending. ... 71
Figure 3-6: Measured reflection coefficient for solid patch antennas at -10 dB
bandwidth in (a) width bending and (b) length bending. ... 72
Figure 3-7: Measured reflection coefficient for porous patch antennas at -10 dB bandwidth in (a) width bending and (b) length bending & (c) cross-section
SEM image of printed-antenna encapsulated with PU-web. ... 73
Figure 3-8: Measured reflection coefficient for (a) solid and (b) porous patch
antennas worn on human arm. ... 74
Figure 3-9: Measured reflection coefficient for (a) solid and (b) porous patch
antennas after 5, 10 & 15 laundry (washing & drying) cycles. ... 75
Figure 3-10: In-situ observation of the shifting of reflection coefficient of (a) solid and (b) porous patch antennas during the evaporation of water out of the antenna body at room temperature; (c) illustrates the water evaporation path through different layers in porous patch antenna. ... 76
Figure 3-11: Robustness of the (a) and (b) solid patch antenna, (c) porous patch antenna, and (d) attachment of the SMA connector with low melt temperature solder and acrylic encapsulation resin. ... 79
xvii onto a polyester-spandex knitted textile for aplication in smart garments
D) heat laminated interconnects in a meandering pattern and an electrocardiogram shirt as concepts for wearable devices for health
monitoring E) The direct-write process enables a vision to achieve automated printing of textile electronics for multi-modal sensing
and/or energy harvesting in a garment. ... 89
Figure 4-2: A) Shows the viscosity vs. shear rate of inks prepared with three different viscosities. Ink viscosity (0/10), (0.5/10) and (1/10) refers to the dilution of as purchased Ag/AgCl ink with 0 ml, 0.5 ml and 1.0 ml of thinner (2-butoxyethyl acetate) with 10 gm of the native ink,
respectively. As the concentration of solvent increases, the viscosity decreases showing the shear thinning beahvior of the inks B) Shows elastic modulus vs. shear stress of the inks indicating the critical values of shear stress termed as yield stresses for each viscosity of the ink. Below the yield stress point, the elastic modulus of the ink does not change with shearing and acts like a solid mateiral. A minimum yield stress must be exerted to allow for the non-newtonian
thixotropic conductive inks to flow and thus allow for printability. ... 93
Figure 4-3: A) These chronological images show the flowability and viscoelastic
behavior of the ink ... 94
Figure 4-4: A) Shows SEM image of the surface of Evolon® and the yellow arrow shows a non-split fiber; B) the cross-sectional image of Evolon®. The red arrows show the splitting of single fibers into multiple fibers at the polyester and polyamide interface via a process known as hydroentangling. ... 96
xviii It can also be observed that as the dispense velocity increases, the line
width decreases when the ink is diluted. ... 99
Figure 4-6: Illustrates the SEM micrographs showing the penetration of the inks with different viscosities under low and high fluid pressures. As the fluid pressure increases from 36 psi to 54 psi (A & D), the ink thickness increases for ink viscosity (0/10). Due to having high ink viscosity, the penetration is not as high as that of the lower viscosity ink samples because the higher solid loading of the ink allows it to stay on top of the fabric surface and retain the wire-like structure as observed. Images B) and E) show the ink penetration and ink thickness of viscosity (0.5/10). It can be observed that this ink spreads much more than the undiluted ink. There are also many more cracks in the cross-sectional interface of the ink and fabric composite structure as the fluid pressure is increased from 13 psi to 22 psi. Images C) and F) show the penetration of least viscous (1/10) ink sample. It can be observed that the highest spreading of the ink occurred in this sample and this can be confirmed through line width data in figure 4 and figure 7. As the fluid pressure is increased from 13 psi to 22 psi the ink spreads in a non-uniform structure through the fiber bulk as evidenced by image c which results in many cracks. This observation indicates that when ink with lower viscosities undergo a high fluid pressure, there will be more non-uniform spreading into
the fiber bulk, resulting in higher ink penetration and resolution. ... 101
Figure 4-7: Images A – C shows a schematic of the particle-flake loaded ink
penetration phenomena with respect to different ink viscosities. ... 102
Figure 4-8: Images A – F show the optical images of the different ink viscocities under low and high pressures, corresponding to the SEM images provided in
figure 5. ... 102
xix resistance and B) accelerated wash cycles following AATCC standard
61-2a. The sample with the least change in electric resistance was
viscosity (0/10) and the sample with the most was viscosity (0.5/10). ... 104
Figure 4-10: This figure shows the SEM cross-section of the printed conductive line for heater 1 (A) and heater 2 (B) shown in table 3 above. In figure, 8A there is a higher observed ink height due to the higher viscosity (0/10) and higher fluid pressure (42 psi) depositing more material. In figure 8B, the fluid pressure (6 psi) and the viscosity (1/10) are both much lower leading to a significantly lower ink height. This flexibility in process variables and material properties can allow for two devices with very different electrical properties as shown in the wearable heater application. Table 3 shows the three-dimensional resolution of the printed heaters. As can be seen in table 3, the flexibility in our process parameters (ink viscosity, ink height) results in heaters with different line resolution and sheet resistance comparable with screen-printing 25. Using the direct-write process, conductive patterns can be printed with much higher ink-height than that of screen-printed structures while keeping similar line resolution that enables ultra-low sheet-resistance of large area printed structures. By varying the ink height of the printed line, we can alter the heating performance of the direct-write printed heaters. This application utilizes the variation of differential ink-height effect on sheet resistance discussed previously. As shown in table 3, heater 1 has a lower resistance and a higher ink height, shown in SEM cross-sectional image at figure 10 which lead to dissipate higher amount of energy in the form of heat than that of heater 2 (figure 10). This thermal response of the heaters in relation to the differential voltage applied can be summarized in figure
11 and figure 12. ... 105
Figure 4-11: A) The direct-write printed heater and its thermal image with ink
viscosity (0/10) and B) ink viscosity (1/10) with an applied voltage 9 V; B) shows the corresponding IR images & C) demonstrates the wearable
xx Figure 4-12: This graph shows the positive thermal coefficient property of the
direct-write printed heaters. For viscosity (0/10), the maximum
temperature is around 50º C as voltage is increased from 3 V to 12 V. As the viscosity decreases, the resistance of the printed heater increases,
resulting in an increase in maximum temperature. ... 107
Figure 4-13: A) The picture shows the bendability of the textile meshed patch antenna. The inset shows the needle tip printing lines via direct-write method. B) The graph shows the resonance frequency shift for the different line- widths. It can be observed that an increase in line width results in the
shifting of resonance frequency. ... 108
Figure 5-1: Illustrate the complete fabrication (printing, packaging & characterization)
process of 3D printed heaters on nonwoven materials. ... 115
Figure 5-2: As the surface roughness increases, the contact angle decreases resulting
in increased wetting. ... 118
Figure 5-3: (a) Temperature profile of printed heaters on different substrates with an applied voltage of 12 V; (b) Sheet resistance of the printed heaters with corresponding optical images showing the printed line resolution for each substrate; (c), (d) & (e) show the thermal images of heaters printed on
TPU, Evolon® and PET nonwoven, respectively . ... 121
Figure 5-4: Shows the ink penetration and ink height from the SEM cross-sectional image of the printed line (heaters) on (a) Evolon® (b) PET nonwoven and (c ) TPU-laminate. The scale bar (red) in the images is 500 µm.
(d) shows the correlation of ink-penetration with fabric porosity. ... 122
Figure 5-5: (a) Shows the procedure of clamping the flexible heating device between the clamps of the mechanical tester (Instron); (b) Shows the change of resistance after 1000 bending cycles of printed heaters on different
xxi Figure 5-6: Difference in the cyclic heating and cooling profile of the printed heaters
on a) TPU-laminate b) Evolon® & c ) PET nonwoven after 1000 cycles of bending. Each cycle consists of applying DC voltage for 5 minutes on
and off, respectively. ... 124
Figure 5-7: Shows the change of resistance after 25 cycles of washing and drying for printed heaters on different samples. (Note that the heaters are washed
and dried after 1000 bending cycles). ... 125
Figure 5-8: Shows the lower back wrap wearable device made with the direct-write printed PET heater increasing in temperature after a) 0 min heating and b)
1 min heating... 125
Figure 6-1: Illustrate the nozzle set up for printing the VIAs and interconnects on both
side of the NPPET nonwoven. ... 131
Figure 6-2: The real time image of printing (a) VIAs and (b), (c) interconnects
connecting the VIAs. ... 131
Figure 6-3: a) Shows the structure of the device with VIAs and connected interconnects on both side of the nonwoven; b) shows the fully packages printed patterns; c) shows the electrical resistance (7.88 Ω) from end-to-end of the printed
pattern s) shows the flexibility and the thickness (1.2 mm ) of the
nonwoven. ... 132
Figure 6-4: The SEM cross-sectional images of printed VIAs on fabric with
thickness ~1.2mm (a); 0.9mm (b); and 0.35mm (c). ... 133
Figure 6-5: a) Shows the method of bending the NPPET with printed conductive VIAs using a mechanical compression device (80% compression in the length direction) & b) shows the change of resistance of the printed
flexible VIAs over 1000 cycling of bending... 134
xxii on knit, Evolon and woven fabric (face & back side) for in situ and
ex situ heart curing process. ... 138
Figure 7-2: Transmission optical microscopy at 10X resolution of (a,c,e,g) Ex situ heat curing and (b,d,f,h) in situ heat curing of Liquid X silver reactive ink on (a,b) PET knit, (c,d) PET woven, and (e,f) Evolon®
nonwoven substrates. ... 141
Figure 7-3: Shows the SEM images (a) native knit fabric (b) knit fabric with ex situ heat curing (c) knit fabric with in situ heat curing and (d), (e) , (f) are the
corresponding images with EDS mapping showing the silver coated areas. ... 143
Figure 7-4: Shows the SEM images (a) native Evolon® fabric (b) Evolon® with ex situ heat curing (c) Evolon® with in situ heat curing and (d), (e) , (f) are the corresponding images with EDS mapping showing the silver
coated areas. ... 143
Figure 7-5: Shows the SEM images (a) native Woven fabric (b) Woven with ex situ heat curing and (c), (d) are the corresponding images with EDS mapping
showing the silver-coated areas. ... 144
Figure 7-6: Measured sheet resistances corresponding to the number of layers of reactive silver reactive ink printed on various substrates (Knit PET, Woven PET & Evolon®) with the comparison of in-situ and
ex situ heat curing. ... 144
Figure 8-1: Illustrates the formulated coating with Printrite DP 336:
UROTUFE 300-w-49 (70:30) wt%. ... 153
Figure 8-2: Roll-to-roll application process of coating substrates like textiles,
paper or plastic films. ... 154
Figure 8-3: Systematic inkjet printing process on coated textiles with
reactive silver ink ... 155
xxiii Figure 8-5: Contact angle measurement on coated-woven cotton fabric for (a) water,
(b) n-dodecane & (c) dichloromethane. ... 156
Figure 8-6: Optical images showing the line resistance of printed pattern on (a) coated woven fabric and on (b) coated paper; (c) shows the SEM
images of the microstructure of the applied coating. ... 157
Figure 8-7: SEM images shows the coverage of ink layer on (a) coated paper and
(b) coated woven fabric ... 157
Figure 8-8: The variation of sheet resistance with respect to the number of print
layers applied on the paper and woven fabric. ... 158
Figure 10-1 : Optical profilometer images of heat-pressed needle-punched PET
nonwoven fabric... 166
Figure 10-2: Optical profilometer images of heat-pressed polyamide-6 (PA-6)
nonwoven fabric... 167
Figure 10-3: Optical profilometer images of heat-pressed Evolon® nonwoven fabric ... 168
Figure 10-4: Contact angles of Ag/AgCl conductive ink (viscosity) heat-pressed PA-6
nonwovens ... 169
Figure 10-5: Contact angles of Ag/AgCl conductive ink (viscosity) heat-pressed
needle-punched PET nonwovens ... 170
Figure 10-6: Contact angles of Ag/AgCl conductive ink (viscosity) heat-pressed
Evolon® nonwovens ... 171
Figure 10-7: Ink penetration on native and heat-pressed needle-punched PET nonwoven, PA-6 nonwoven and Evolon nonwoven after screen
printing conductive tracks with constant process parameters. ... 172
Figure 10-8: Surface resolution of screen printed parallel conductive lines with 200µm seperation (gap ) on on native and heat-pressed needle-punched
xxiv Figure 10-9: Surface roughness, surface area of native and heat-pressed
needle-punched PET nonwoven, PA-6 nonwoven and Evolon nonwoven with their corresponding sheet resistance& mass gain values after
screen printing conductive patterns on them ... 174
Figure 10-10: Test setup showing the water flow on the simulated sweat-bed and
the positioning of test antenna on it ... 176
Figure 10-11: In situ frequency response of antenna on a simulated sweat bed ... 177
Figure 10-12: Responses of the S11 of porous and solid antenna seating on a sweat-bed pumping 10 ml/hr of water flow simulating the sweating of a healthy
human during running ... 178
Figure 10-13: Responses of the S11 of porous and solid antenna seating on a sweat-bed pumping 3 ml/hr of water flow simulating the sweating of a healthy
human during walking ... 179
Figure 10-14: Change of resonant frequencies of porous and solid antenna at different water flow rate of the sweat bed ; a) for water flow rate of 10 ml/hr & b)
1 : Introduction
Motivation of research
The application of conductive materials to textiles is observed as means for producing high-value-added materials in applications ranging from filtration to wearable electronics. However, the cost of the conductive inks necessitates the need to understanding the ink-to-fabric interaction as well as the development of new compatible routes toward the application of conductive materials to textiles. Nonwovens in particular offer the ability to be tailored in such a way to make the surface topology and web construction amenable to conductive coatings. This research aims to examine the efficiency of use for commercial inks that would be applied to nonwovens by existing printing methods as well as the exploration of novel solution-based methods for inorganic/metallic based material applications. These processes are chosen as they can be translated to traditional roll-to-roll nonwoven modification processes.
This work leverages the existing techniques to impart conductive materials onto nonwovens, including screen printing, direct-jet printing and ink-jet printing process. The following sets of questions, related to the processing conditions, materials characteristics for conductive printing can significantly improve and improvise the current applications of engineered nonwoven materials, excite us to motivate in this particular research:
I. What is the relative efficacy of conductive materials application methods? For example, what is the impact of conductive ink ‘soak-in/bleed-through’ within the nonwoven on the
electrical resistance? What effect does the nonwoven surface energy, surface roughness, web porosity, basis weight, fiber orientation have on this efficiency?
II. What are the process limitations (i.e. annealing, surface alteration) to solution-based processing methods (i.e. direct application of metallic particles, solution gelation). For example, what is the capability to apply photonic sintering of solution deposited metallic particles on nonwoven substrates?
2 printed line resolutions vary with different printing techniques and how does the resolution change the characteristics of radio frequency devices printed on nonwovens?
IV. Can we leverage the three dimensional, flexible and air permeable structure of nonwoven materials to impart smart features to the printed devices? For example, if a printed RF-ID antenna on nonwoven structure can maintain the good flexibility and air-permeability while maintaining the same or acceptable device performance. Can we also utilize new features (high surface area & air-permeability) of nonwoven-RF devices for developing better performing gas sensors?
Literature review
3 flexibility/durability for a given thickness of material as well as a breathability that is not observed in planar film like materials or even woven materials. These features enable a wide range of applications not permissible in other materials. Still, fundamental roadblocks exist that limit the economic feasibility of conductive materials application to nonwovens. The primary issue is that the materials are expensive and that efficient use of the material is necessary to reduce margins on the final product. The efficiency of the process is dictated by interaction between the application method and the fabric properties. This is most easily exemplified by screen printing of the conductive inks on fabrics, resulting in bleed-through of the ink. This phenomenon results in a low use efficiency of the ink. Understanding the strategy for ink selection for use on a particular nonwoven is critical to lowering cost. Other processes, such as those based on solution processing, also have similar use barriers. The next most critical issue is the functional impact that the conductive material may have on the end use application of the nonwoven. Some methods for applying the conductive material may result in surface coating (such as ink-jet), while some methods may result in conformal coatings on the fibers within the nonwoven. These structures will impact the air flow permeability, wetting, mechanical behavior, and durability of the nonwoven in different ways. Understanding the impact that the deposition of the conductive coating has on the nonwoven properties is critical to understanding its use in an end-point application. Finally, as with any nonwoven material modification, a scalable and high-throughput process is a pre-requisite. With the advancements in roll-to-roll manufacturing on flexible film substrates, many of the processes exist that are able to be marketed for film-based devices. An economic assessment of the film-based processes is still required to translate to the effort to nonwoven applications. To address these roadblocks, this research aims to expand the current knowledge of conductive materials processing methods on films to that on nonwoven substrates and understand the impact of material use efficiency, impact on nonwoven properties, and efficiency and economics of the end-use application.
4 defined nonwoven as “sheet or web structures bonded together by entangling fibers or filaments,
by various mechanical, thermal and/or chemical processes. These are made directly from separate fibers or from molten plastic or plastic film”.
Manufacturing processes of nonwoven materials
5 Figure 1-1: Drylaid process of manufacturing nonwoven fabric.
(https://www.edana.org/discover-nonwovens/how-they're-made/formation)
Figure 1-2: Wetlaid process of manufacturing nonwoven fabric.
6 Figure 1-3: Spunlaid process of manufacturing nonwoven fabric.
(https://www.edana.org/discover-nonwovens/how-they're-made/formation)
Nonwoven fabrics can be manufactured in a single processing unit, thus it has become a very ubiquitous material for many different applications. Moreover, the properties of raw materials, and the processing parameters can be controlled to manufacture nonwovens with a wide range of properties. Tunable surface and bulk properties of nonwoven materials are utilized in numerous applications such as hygiene care 14, filtration 15, insulation 16, automotive interiors 17 , reinforcing composite 18 , packaging 19 etc. Fabricating flexible devices on nonwoven can potentially create
new areas of engineered product space for existing industries. Thus, this research work focuses on efficient and high throughput conductive printing process on nonwoven fabrics.
Advantage of printing process over other metallization techniques
7 process; rather it creates new area of use cases and material platforms for numerous applications such as solar cells, 20 arrays of light emitting diodes 21 on flexible substrates, pressure sensors 22,
radio frequency identification tags on papers 23, passive electronics, flexible circuit boards and interconnects on textiles 24 etc. One of the major requirements of printing electronics on textile is to meet the speed of large area manufacturing processing in the industries. Therefore, this research aims to optimize processing conditions for high throughput printing process on nonwoven. Generally, printing process can be divided in to two major categories as 1) contact printing and 2) noncontact printing. The figure (figure 1.4 ) below shows different types of printing under the umbrella of non-contact and contact printing process. Among them, the most popular printing processes that have been adopted by various industries are highlighted. Screen-printing has been the most common for printing large area circuit boards. It is also used in textile industry very extensively. This research will focus on the fundamental study on processing conditions and materials characterization of screen printing and direct jet (inkjet and direct-write) printing passive devices on nonwovens. Additionally, gravure and flexographic printing processes will be tried to address the possible challenges of those printing processes on rough, porous fibrous substrates like nonwovens.
Figure 1-4: General classification of common printing procedures; redrawn from ref: 25.
Screen printing and the state-of-the-art
8 war for the necessity to build circuit boards very quickly. The method is well adopted for the commercial manufacturing processes for its simplicity and being less expense. A screen, made with woven polyester or steel fabric mounted on a frame is used for screen printing process. The screen is coated with UV curable emulsifier and burned with patterns. The patterned areas are clean and open as woven fabric to pass the ink though. The pattern is developed by transferring thick paste ink through the designed open areas of screens made of a polyester or stainless steel fabric. The applied thick ink is flooded on the screen and pressed against the substrate underneath the screen by a squeeze traveling across the length or width of the screen. Therefore, the ink goes through the patterned areas of screen and deposited onto the substrate. The total process is shown in the following figure below.
Figure 1-5: Screen printing process (http://www.gwent.org/gem_screen_printing.html)
three-9 dimensional hydrostatic pressure. The following three equations derived by the authors give a huge insight on the crucial variables in screen printing process
Flift = ∫0RqPsqueeze dr = f(α)f( Q)ƞ V ………. ( 1 )
f(α) = [2 α sinα/(α2− sin2α)
where, Flift is the pressure of the squeeze on its surface, f(α) is the constant factor depends on the angle of the squeeze (α), f( Q) is the factor increases with ink quantity, ƞ is the viscosity of the and V is the velocity of the squeeze. Equation (1) is the numerical equation to find out the applied pressure of a squeeze when during a single stroke of operation. It is shown the squeeze force is directly correlated with velocity of squeeze, viscosity of the paste or ink and inversely proportional to the angle of squeeze. Understanding the force applied by a squeeze, it is also very important to know the conditions of the printing parameters to successfully transfer the ink through the mesh of the screen. Equation (2) given below shows the relationship to set the ideal process conditions to transfer the ink or paste through the screen mesh;
ƞ V ≤ ( 1 128) (
D2 dw) (S −
B
a)pa ……….. (2)
where, S is the screen size, B is the length of the printed pattern, a= snap off distance, D is the diameter of the mesh opening, dw is the wire diameter of the mesh. The value of multiple of ink-viscosity and squeeze velocity must be lower than the right-hand side portion of equation (2) which is function of the diameter of the mesh opening, wire diameter, screen size and the length of the printed design, to transfer the ink through the mesh. While ink being transferred on the substrate, there is generation drag force (frictional force) to cling the screen to the fabric. This phenomenon can create damage to the resolution of the edge of printed pattern. The value of right hand side of the equation (3) has to be greater than the value of ƞ V in the equation (3) to lift-off the screen right after squeeze stroke. The force applied on the squeeze to create screen tension has to strong enough to pull the screen fabric without clinging to the substrate. Equation (3) is shown below;
ƞ V > ( π 256) (
a
lsr ) mσs− ( lsr
10 where, m is the wire pitch, lsr is the distance from the squeeze edge to screen frame, pa is the atmospheric pressure, σs is the screen tension applied by the vertical pressure of the squeeze. 28
The following graph has been drawn from equation (2) and (3) by D.E. Riemer, which shows the values of ƞ V (N/m) with the change of snap off distance according to equation (2) and (3). For successful printing execution, the value of ƞ V must be below graphed the lines from both equations. Thus, the highlighted area is identified in the graph to show the range of acceptable rang of values of ƞ V for successful printing. (Ref: The theoretical fundamentals of the screen printing process).
Figure 1-6: Maximum value of the product ƞ V as function of snap-off distance at (screen fabric: 325 mesh, 0.0011 in wire diameter).28
The above discussion is made from the theoretical model of reference 28, which has considered the important parameters in the screen printing process. We can get the insight that multiple of ink viscosity and squeeze velocity value creates the boundaries for other related variable in the screen-printed process. The follow-up models have also been demonstrated by other groups to understand the screen printing process. 29 However, the authors did not show their theoretical analogy with
11 flow of ink during screen printing process, where as in practice inks or pastes used in screen printing process are Non-Newtonian fluids.
Characteristic of ink or paste required for screen printing process
Screen printing pastes are composed of high weight percentage of solid suspended in solvent with binder and dispersing agents. The paste behaves like a viscoelastic fluid. Note that the shear thinning behavior of the paste is beneficial for screen printing process. 31. Thus, it is required to characterize the rheological flow behavior of the pastes formulated for screen printing applications
32. Rebeka analyzed the viscoelastic behavior of screen printing inks with various thickeners. She
found that the flow behavior of the inks depends most significantly on content of polymers in the ink composition. Very interestingly, the author showed that the elastic properties of the ink govern the paste or ink add-on percentage of a cotton substrate. The add-on percentage increases linearly with increase of the value of viscoelastic loss tangent (the ratio of viscous modulus and elastic modulus) of the paste. 33
Figure 1-7: Shows the paste add-on percentage of screen-printing process with different values of viscoelastic loss tangent of the pastes.33
Screen printing conductive patterns on textile and nonwoven fabrics
13 Figure 1-8: Screen printed coplanar wave guideline on different nonwoven with different conductive inks (Top left); the time scale variation of characteristic impedance of printed CPWs (Top right); 36 printed ECG electrodes on nonwoven fabric (Bottom left); generated ECG signals by the printed sensors (Bottom right) . 37
General ink-jet printing process
14 ``
Figure 1-9: Contact angle (θ_e) of a liquid (l) on solid (s) surface.38
The correlating equation of contact angle ( θe) and interfacial energies is given below.
γSV− γSL− γLV cosθe = 0 ……….. (1)
Where, cosθe , γSV, γSL, γLV are expressed as the contact angle and interfacial energy in between solid to gas, solid to liquid and liquid to gas , respectively. 38
However, this straightforward equation does not help that much if the printing media or the surface is rough and porous. The final shape of a droplet is not symmetric on a rough surface. It depends on roughness, contact angle of the drop and the size of the printing drop. 39 A very important factor that determines the dimension of a printed drop and the print quality is the kinetic energy of an ink droplet. It is directly correlated with the velocity of a droplet striking on a substrate. The kinetic energy carried by a droplet is working against the viscosity and surface tension of the liquid drop. Two dimensionless numbers express these force factors in ratios and those are Weber number and Reynold number.
Weber number (We) =
ρ∗v2∗d
σ ……….. (4)
Reynold number (Re) =
ρ∗v∗d
μ ………. (5)
15 Ink-jet printing on porous substrate
Research on analyzing the droplet impaction of nonporous solid surface has been investigated for several decades, but it is very limited in the case of rough porous substrate, specifically textiles. Unevenness and porosity, these two factors individually affects a lot on the behavior of droplet impaction on a surface. A combined effect of unevenness and porosity makes the problem very complex to understand due to the tremendous increase of governing variables in the scenario. In case of porous substrate, the capillary force of the fluid mainly governs the jet spreading of a droplet.
Burcek has described a fundamental study on the penetration of liquid droplet on different nonwoven in both theoretical and experimental set-up. According to her experiments, densely pack nonwoven with high solid volume fraction (SVF), the equilibrium shape of droplet is determined by the contact angle of the droplet, fiber orientation and droplet size. The simulation study shows that the in-plane distribution of the ink decreases as the fiber size increase and the trough plane penetration increases with the increase of fiber diameter for substrate with same SVF. The reason of this phenomenon was explained by the fact that nonwoven with larger fiber has fewer pathway to distribute laterally and more room to travel through-plane direction.
Figure 1-10: Water droplet (d = 80 μm) on SVF = 10, ca = 0, (a) df = 4 μm , t = 331.43 μs, (b) df = 8 μm , t = 194.06 µs, where df is denoted as fiber diameter. 40
16 of the drop smaller. Burcek along with other researchers found that the higher velocity of impacting liquid droplet helps in penetration of the drop instantaneously for both hydrophobic and hydrophilic fiber whereas droplet with lower impacting velocity penetrate by surface driven force interactions.40 Although there has been some excellent outcome demonstrated by this relevant research, it lacks the factual judgement from experimental perspective. Additionally the influence of gravitational force of solid particle in the case of inkjet printing liquid with suspended solid particle has not been brought into the consideration in this research, which is very closely related with practical application. A more practically reliable experiment has been done in 41 by observing a single droplet of liquid by an inkjet print head where the authors created a model of liquid drop imbibition process by considering Darcy’s law along with molecular kinetic theory 42. Although
the model shows a good matching with experimental data on absorption time of liquids with both low and high surface energy, this model did not put any light on the imbibition process of colloidal solution. 41
The study of dynamic penetration of nanoparticle in porous nonwoven mat during the impaction of a titanium nanoparticle loaded water droplet has been reported very recently. 43 In this work, the author demonstrated the penetration of particle loaded droplet on hydrophobic nonwoven (water contact angle 1600) mat is possible when the droplet achieved a specific velocity during
17 Figure 1-11: Images of drops of aqueous suspensions of nanoparticles impacting onto: (a) hydrophobic PTFE membrane, and (b) hydrophilic glass fiber membrane. The drops were issued from a 14G needle at the height of 180 cm, and had the impact velocity of 5.32 m/s 43
Ink-jet printing on non- porous substrate
18 In case of filled system, such as colloidal suspension, the coffee ring effect is influenced by the size of particles as well as the contact angle of the solvent with the print media. It is observed that for monodispersed silica particle suspension, the diameter of a drop on glass deposited by ink-jet printed head is higher for smaller particle size than that of larger. The coffee ring effect is eliminated by lowering the surface energy of the substrate, which results in smaller diameter of dried droplet for smaller particles. 48 The lower surface energy alter the flow of solvent outer wards radially due to being a hydrophobic surface for water based colloidal system. The alternative method of eliminating the coffee ring effect is to change the surface tension of liquid by adding ionic surfactant. This phenomena is also proved in literature where the author added SDS surfactant in colloidal suspension of polystyrene microparticle to alter the coffee-ring effect to coffee tree effect. 49
19 Figure 1-13: (a) Set of depositions from dried water drops containing 0.5 wt % PS particles (d = 1330 nm) and different concentrations of SDS (indicated under the pictures). The drops were evaporated on a hydrophilic microscope slide; the initial drop volume was ab49
Ink-jet printing on textured surface
20 Figure 1-14: Sketch illustrating the details of 2Rm (jet spreading), 2Rs (lamella spreading), and Z-height for the spreading drop (left); the influence of We on the variation of the fractional liquid volume entrapped inside the grooves of the textured substrate. 50
Ink-jet printing on textile and nonwoven is much critical, as the substrates are not only rough but also porous. Therefore, an extra dominating effect (capillary force) is to be added to consider in case of ink-jet printing on textiles.
Preparation of conductive ink for inkjet printing
Developing printed conductive traces by inkjet printing is simply done by transforming the regular dye or pigment based colored ink with conductive ink. However, the conductive ink for inkjet process must possess the required characteristic in order to be ejected through inkjet nozzles without clogging and forming very tiny droplets (approximately 10-40 pico-liter) achieving good resolution. The required range of viscosity of inkjet printed ink is very low (4-40 c.ps) compared to screen printing pastes. The density, surface tension and flow behavior of the ink has to satisfy the reproducible drop formation of the ink. 51
21 patterns. 58,59 A range of sizes of metal nanoparticles have been used in literatures 56 which showed
variations in achievable conductivity. Metal nanoparticles are primarily prepared by the chemical reduction process of metal salts. The selection of metal salt, reducing agent and catalysis is very crucial for the growth of nanoparticles. The control of the growth of the particles is usually done by the incorporation of the polymeric capping agents. The conformation of capping polymers around the nanoparticle can be utilized to grow asymmetric growth of nanoparticles which is essentially adopted to fabricate metal nanowires. 60,61 Solubility and adhesion of metal nanoparticle ink to substrate can be enhanced by the addition of different ligands with selected chemical functional groups. Bok has shown that the modification of Ag-nanopartciles with amphiphilic ligands can improve the solubility of the particles with a range of solvents. 62
Figure 1-15: Flow diagram and schematic illustration of Polyacrylic acid-capped Ag microparticle synthesis and surface modification by amidation reaction using 3-morpholinopropylamine (MPA) (Left ); and optical images of Ag microparticle inks (6 wt%) in different solvents. (a) Polyacrylic acid-capped Ag microparticles before amidation and (b-c) amphiphilic Ag microparticles after amidation using initial ratios [NH2]/[COOH] of 0.1 and 1.0, respectively (right) .62
22 AgNP solution, the adhesion mechanism of nanoparticles onto the printing media (photo-paper) was not discussed well.
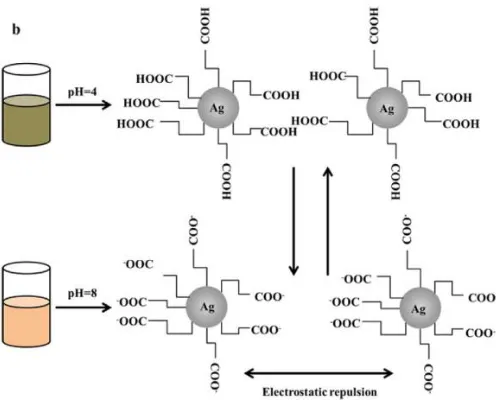
Figure 1-16: The mechanism for the dispersion and aggregation of the Ag nanoparticles-based ink. This test was carried out to determine the proper pH value of silver nanoparticle-based ink. 63
On the contrary, Yanyan has demonstrated the modification AgNP ink with acrylic based resin in the ink formulation process for the better adhesion to the print media (paper). Thus, the mechanical stability of the printed pattern on paper improves, although it decreased the conductivity an order of magnitude. Overall, ink-jet printing is a very complicated process that involves the rheological properties of inks, the dynamics droplet formation through the nozzle, flight of droplets, striking behavior of droplet on the surface, interaction of surface energy of droplet and the substrate and drying mechanism. 64 Recent development and practice of using reactive metal precursor ink for inkjet application has drawn attention in academic research. Using reactive ink has the advantage of being sintered in lower temperature than that of the nanoparticle-based inks. Additionally, particle free reactive ink eliminate the possibility of clogging the printing nozzle, which is a big advantage for low cost facile inkjet printing process. 65
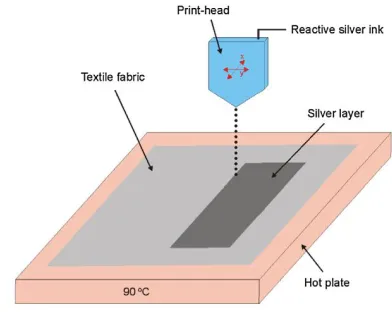
23 very porous (more than paper), inkjet printing with conductive ink to achieve reasonable conductivity is really a difficult task to accomplish. A very limited research has been done so far in this field. Seyed experimented successfully for the first time of printing conductive patterns by inkjet process on regular textile fabrics. In his process, the authors used two different printing solutions to print onto the same pattern. A solution of different metal salts and associated reducing agents are printed layer by layer on the pre-treated textile fabrics.51 In situ heating process during printing conductive ink helps to minimize the wicking process of the ink and leads the conductive particle to stay on the top layer of the substrates. Thus, printing on heated surface has been introduced as an effective technique of inkjet printing conductive pattern on textiles. 66,67
Figure 1-17: Scheme of silver deposition on pre-heated textiles using inkjet printing. 66
However, to achieve considerable conductivity, number of layers of silver ink in the form of either reactive silver solution or nanoparticle solution, is needed to be printed to agglomerate enough materials. This is a massive drawback for low cost, high resolution and mass production process. Recent development of reactive silver ink 68-72 can be modified to amenable ink-jet printing process shows promising result while printing on latex finished wood-cellulose based fabric (TENCEL®).73 However, the textile surfaces do need some extent of coating to adhere the reactive
24 Figure 1-18: The left picture shows the test patterns printed on the different substrates with the same printing parameters.Best results were achieved on the stretchable latex substrate (with 6 layers); the right-side picture shows the photograph of printed conducting paths with Arduino Lili pad onto the textile (100% TENCEL®). 73
Sintering process of inkjet-printed conductive ink
25 nanoparticles decreases with particle size. The following equation show the relationship of particle radius, crystal thickness to its melting temperature. 76
Tm ( r)
Tm( ∞) = exp[ −(α − 1 )( r
3h − 1 )
−1 ]……….. (6)
, where Tm ( r), Tm( ∞), α, r,h are respectively the melting temperature of metal nanoparticles,
melting temperature of bulk silver, empirical parameter for each metal type and system, radius of nanoparticle, and height of monolayer of atom in the crystal.
Recently, several other sintering techniques other than thermal sintering have been utilized popularly as a means of room temperature sintering process. Sinter metal particles with laser light, microwave energy have been studied thoroughly. Laser light sintering process have one big drawback that the sintering process is dependent with area. The sintering can be so long if the printing area is large. Similarly, microwave sintering is also limited by the thickness of printed lines. 77,78. On the other hand, flash light sintering or photonic sintering can overcome those problems and leverage sintering process at shorter amount of time in room temperature. Photonic sintering is capable of sinter nanoparticle in milliseconds of time with generating high energy light pulse (approx. 1000 J). 79
26 Direct-write printing process
Direct-write printing is very similar to 3D process where the solution of conductive ink is ejected through a nozzle motioned by programmed robotic hand. Unlike inkjet printing process, the nozzle can do in linear, diagonal and rotational movement to print complex patterns on the substrate. Direct writing is described in the literature as a “fabrication methods that employ a
computer-controlled translation stage, which moves a pattern-generating device, e.g. ink deposition nozzle or laser writing optics, to create materials with controlled architecture and composition”. 80 Usually direct-write printing is used to build two dimensional patterns on a substrate, some modification of materials and processing condition can help developing patterns also in z-direction. 81 The ejection pattern of conductive ink can be applied in two different modes; droplet jetting (similar to inkjet) and continuous filament writing (similar to 3D printing). In droplet jetting (similar as ink-jet printing) the ink is deposited in a series of droplets onto the substrate to make a linear structure.
Figure 1-20: This shows a schematic of the direct-write process with continuous pressure and drop on demand mode on the textile substrate.
With inkjet printing, the advantages lie in printing on flexible substrates with precise control of line-width and film thickness, however, with textile substrates inkjet printing has proved to be a difficult process. As described before, inkjet printing also requires low viscosity inks whose solvents and ink particles are absorbed by the textile substrate’s fiber bulk, prohibiting conductive
27 surface.66,82 On the other hand, in continuous filament writing the ink is deposited in a continuous
filament structure onto the substrate. This technique allows fabrication with computer-controlled pressure driven ink-suspension nozzle, permitting control of design and line dimensions on the substrate. Typically highly concentrated nanoparticle loaded conductive inks are usually used for direct writing technology. In this process the dispenser needle loaded with highly concentrated metallic ink needs to come very close to the substrate in order to make continuous lines of patterns. This direct write printing method is suitable and widely used for printing high resolution circuits and passive electronics on glass, films, and ceramic materials which have smooth surfaces compared to textiles. However, on textiles it is difficult due to the high surface roughness and because the needle has to be far enough from the textile substrate to avoid friction with the protruding fibers. 83,84
Previous work has demonstrated the process of direct-write on textiles 84,85 , however, it required up to 5 print passes to achieve respectable conductivity (0.2 Ohms/3cm) and thickness (110µm). It is very important to achieve respectable conductivity and thickness with only one print pass to minimize the cost of the processing. There is not enough studies accomplished on the developed the printing process, characterizing the ink rheology, to validate validated ink selection with the process parameters (fluid pressure), and printed devices to validate the process. Therefore, there is a need to demonstrate direct-write capabilities for conformal coating system on textile materials in a high-throughput, low-cost, and high-performance fashion to prove the competence of this technology in electronic-textiles manufacturing process.
Properties of ink in direct-writing printing
28 work progress in developing functional inks with such a property. The inks are made of high solid weight percentage nanoparticles with modified suspension energy, capable of flowing through submicron size nozzles under high shear stress. As soon as the inks ejected and pressure released the ink solidifies readily and capable of building free forming 3D structures.87
Figure 1-21: (A) Schematic diagram illustrating omnidirectional printing and optical image of apparatus used (inset). (B) Transmission electron microscopy image of the synthesized silver nanoparticles and optical image of the concentrated ink (inset). (C) Shear elastic modulus as a function of shear stress for silver nanoparticle inks of varying solids loading.87
However, it needs to be notated that the throughput of direct write process is found very low in the literatures. Although, throughput is not a machine or software constraint, the process requires printing in optimized speed to have connected and continuous conductive track. On the top of that, direct writing conductive track on rough surfaces like textiles requires low dispensing speed88-90, multiple passes85 and sometime interface layers83,85,91 to achieve high conductivity. Thus, literatures show that a significant improvement of the material development and process evaluation is required to achieve a high throughput direct-write process for printing conductive tracks on textiles. This is one of research objectives of this current study.
Contact printing processes
29 Gravure printing
The functional is transferred by direct contact of engraved structure of pattern with the substrate. The patterned cylinder of the gravure printing machine is electroplated with copper and engraved with tiny little cells to hold the ink. The ink is carried in the reservoir while the engraved roller soaking the ink. A doctor blade wipe out the extra ink from the surface. The print media is carried out and compressed in between the engraved cylinder and pressure cylinder. During this process, the ink is transferred from the engraved cylinder grooves to the substrate (figure A). The process is the capillary action of fluid transferring from the micron size reservoirs on the engraved roller to the roller substrate. The surface energy of the substrate, ink surface tension, viscoelastic properties of the ink, cell width and depth in the reservoirs, speed of rollers, and pressure imparted by the pressure cylinder play vital roles in determining successful ink transfer process to determine the resolution of the printed line. 25,92,93
Figure 1-22: Schematic of roll to roll printing (A) Gravure Printing (B) Flexographic printing (C) Rotary Screen Printing. 94
Flexographic printing