by Harvey J. Gold
Institute of Statistics Mimoo Series #2249 BMA Series
#
41I
I
I
l
1
,I
Ii
~~~ES
;L' PETROLEUM TANKS: REVIEW & MODEL
(
ING FRAMEVIORK FOR DECISION-RELATEERISK ASSESSMENT w_\NAME DAte II
"
-RlSKS FROM
UNDERGROUND PETROLEUM TANKS
REVIEW AND MODELING FRAMEWORK FOR
DECISION-RELATED RlSK ASSESSMENT
Harvey
J.
Gold
Biomathematics Graduate Program, Dept. of Statistics Campus Box 8203, North Carolina State University
Raleigh, NC 27695 April,1993 Ph: 919-515-2271
FAX: 919-515-7591 email: [email protected]
DRAFT.
Please do not cite without permission.
Comments would be most welcome.
,..
..
SECTIONS:
1. INTRODUCTION
2. DESCRIPTION OF THE PHYSICAL SYSTEM
3. TOXICOKINETICS: ABSORPTION OF THE "BTEX" COMPOUNDS 4. POPULATION DEVELOPMENT, LAND USE,
AND CATEGORIES OF WATER USE.
5. EXPOSURE FROM WATER USE - EMPIRICAL INVESTIGATIONS 6. TOXICOKINETICS AND THE DOSE-RESPONSE RELATIONSHIP. 7. SOME CALCULATIONS ON THE RISK OF AML
FROM BENZENE IN HOUSEHOLD WATER 8. A BRIEF REVIEW OF RISK ASSESSMENT THEORY 9. VALUES AND ETHICAL ISSUES
10. SOME QUESTIONS TO BE ANSWERED 11. CONCLUDING REMARKS
2 4 15
19 20
24
38
40
45
47
DRAFT
1. INTRODUCTION
2
The .peci/ic focus of this review is on the evaluation and management of health risks related to the contamination of groundwater from leaking underground petroleum storage tanks. More generally, this example is used to illustrate the complexity of environmental risk management, and to indicate needed interplay between knowledge and expertise &om a variety of different disciplines.
A brief statement of the specific problem is that leaking underground tanks, in most cases designed to store petroleum fuels, are a maJor source of groundwater contamination. In N:orth
Carolina, for example, during the period of 1988-1989,75% of the groundwater contamination incidents were due to leaking underground storagetanks, most of these involving petroleum products. Taylor (1989)quotes an EPA estimate that puts the number of underground tanksusedto store petroleum and other hazardous substances between 2.5 and 3 million nationwide. He also quotes surveys which indicate that "up to 30% of the existingtanksleak."1 The proportion of such tanks that are leaking is unfortunately subject to considerable uncertainty; Kostecki and Calabrese (1989) put the proportion at "up to" 60% . The likelihood of an existing tank leaking increases, of course, as the tank gets older. The overwhelming maJority of these leaks involve petroleum fuels of some type.
When petroleum materials are introduced to the soU, they travel downward, eventually reaching the saturated or groundwater zone. The materials may subsequently be discovered to be contaminating well water (Figure 1). The petroleum components of most concern are benzene, ethyl-benzene, toluene and the xylenes (m-,0-, andpo). These are sometimes collectively referred to as the BTEX compounds. The compound of greatest concern from a health perspective is benzene, which has been shown to be a human carcinogen (see the report of Oak Ridge Nat'l Lab., 1989). The health risks discussed in this report will focus on the BTEX compounds, and in particular, on benzene.
Unfortunately, in many cases, by the time the leak has been discovered, the groundwater is already contaminated, and cleanup - if it is at all possible - is costly, uncertain, and takes many years. It has been argued by Bauman (1989), that in some cases it is doubtful if the cleanup can be completed before the offending materials would have been degraded by naturally occurring bacteria.
Evaluation of the health risk associated with a given leak is often subject to considerable uncertainty. A partial list of the uncertainties includes uncertainty as to: amount, spatial distribution and timing of the leak; rate of flow first through the unsaturated zone and then through the
groundwater zone; amount, duration and type of groundwater use, which leads to human exposure; the toxicological dose-response relationship. In addition, there are uncertainties connected with the
lUDJ'onUD&&ely, Taylorneithercit. the1OUJ'Cenor explaiuwhat "upto~" meana.
..
TANK
t
Unsaturated
soil
zone
W
E
L
L
Water for
use
HUMAN
EXPOSURE
Saturated zone
...~ ._
_
-
_
_
_ _
_
..
...•..._
_
_
_ _
_
_-.-.-
_
_---_
_._
...•...
DRAFT
efficacy and cost of remediation methods, as well as with evaluation of the health risksassociatedwith those methods.
The coet of remediation of a given site may run into the hundreds of thousands of dollars. This certainly warrants a careful consideration of the uncertainties sunounding the remediation decision 80 as to ensure, as best as we are able, that the money is being spent wisely. Even more pressing is that policies that mandate certain standards and procedures involve expenditure of billions of dollars nationwide. Critical questions are:
3
• Are the money and other resources beingused as effectively as possible, given the uncertainties?
• Could these resources, or a portion of them, be more effective in protecting public health and the environment ifused elsewhere - or, altematively, are we not spending enough on this problem?
• What new information (which isused to reduceuncertainty) might most effectively increase the quality of decisions on these issues.
This report is intended to develop a framework for probabilistic risk assessment applied to this problem, and for using such an usessment as a basis for decision making, within a decision analytic framework. We begin by describing, in general terms, the physical/biological system suggested by Figure 1, and considering the approaches used to model each of the subsystems and processes. In doing so, we highlight factors which are candidates for ml\ior 80urces of uncertainty in the health risk
evaluation. We then describe the idea of probabilistic risk asaessment in general terms, and examine how the approaches might usefullybe applied to the LST (leaking ,torage tank) problem. It becomes necessary to carefully examine the concept of ncenaint" how to formulate it in different contexts, and how to combine uncertainties that are traceable to variability in the receptor population, to lack of knowledge of parameter values or to lack of knowledge of underlying mechanisms. In considering how best to use information to deal with the uncertainties, it is necessary to examine approaches for combining information that arises from statistical data sets, from models of underlying physical and biological processes, and from subjective expert evaluation.
..
petroleum
precipitation
groundwater {low
,
•
~
off-site
migration
GROUNDWATER
WATER FOR
-
-IN WELL ZONE
...
HUMAN USE
-I
off-site
migration
HUMAN
RECEPTORS
HEALTH
EFFECT
outputs of iratere,t are the health effects, principally cancer initiations, traceable to the petroleum constituents.
Figure 3 shows an infl.erace diagram perspective, which will be uaed to guide the modeling of probabilistic relations. Eachof the rounded boxes in this diagram represents a random variable or vector of random variables. We may have some knowledge about each of these variables2, but lack completely definitive information. We may express our knowledge (or uncertainty) about their values through the uae of probability distributions. Anarrow into a random variable implies that the
variable at the head of the arrow is stochastically dependent upon the variable at thetail. That is, any knowledge of the variable at the tail will affect the probability distribution 888igned to the variable at the head of the arrow.
AB indicated in the lower right of the diagram, management decisions will be made on the basis of projected effects on cost as well as on the health effects. Monetary costs associated with health effects are treated separately from non-monetary considerations.
In addition to random variables, the diagram contains a rectangle with squared edges, which represents the decision taken as to remediation actions. AB shoWD, this decision influences both the total monetary costs and the health effects by means of effect on the concentration of contaminants in the water supply.
2. DESCRIPTION OF THE PHYSICAL SYSTEM
Figures 2 and 3 suggest that descriptions of relevant characteristics of the system depend on a variety of disciplines:
Engineering - tendency of tanks to leak.
Hydrogeology - aquifer structure and movement of water and contaminants.
Demography and population behavior - pattern of expected urban/industrial development and of water uae and consequent exposure to contaminants.
Toxicology - relation between individual exposure and health effects.
Exposure
pathway and
amount
UTILITY
FUNCTION
POPULATION
EXPOSED
\
Pattern .of
water use
INDIVIDUAL
HEALTH
EFFECT
Monetary
costs
Population
Health
Effect
Location
and depth
of well
Concentration
in
Well-Water
Remediation
Actions
Leak characteristics.
time. and location
Concentration
profile in
vicinity of well
Aquifer
characteristics
Figure
3.
Aggregated influence
2.1.
IIIlk
fAi1m _
leakye. Some relevant questions are:• Where are leab likely to occur (pipe connections,tankseams, top vs. bottom or side)? • What is the likelihood of many smallieab va. a few large ones?
• What are the likelihoods of various types of leab as function of time and age of tank?
The answen to these questionswilldepend upon tankconstruction, soil redox potential and pH, moisture conditions. The answen are important for two reasons. First, in making risk based "run/replace" decisions in individual situations. Second, for the consideration of risk from an actual or suspected leak, the position and type of leak is important in determining the amount and spatial distribution of material leaked from thetank. Since amount and distribution of the leaked material is not readily observable with accuracy, consideration of these likelihoods is valuable input for formation of prior probability distributions which can increaae the power and usefulness of test observations.
O'Brien (1988) discusses the construction of detailedfaul~treeanalysis conducted by EPA, which should be helpful in addreeaing these questions. Figures given by Haney (1989) indicate that of 174 cases in Arizona for which cause of leak was identified, 54% were associated with the piping (mainly loose seals and faulty installation), 36% were associated withtank failure (mainly corrosion), and about 10% were due to spills or overflows.
2.2. Migration
AWl
distribution through~unsaturatedI2il
~Normally, the non-gaseous fluid component of soil is aqueous. Non-aqueous liquids are foreign to the normal soil environment. Petroleum introduced into the soil from the tank enters the soil as
nonaqueou. pla4.e liquid (NAPL).
Asthe petroleum enters the soil it tends to migrate downward through the unsaturated soil zone, under the combined influence of gravitational and capillary forces. In migrating through the soil pores, the NAPL will tend to displace loosely held pore water in the larger pores (but not the more tightly held water which wets the soil particles), andalsoto become sorbed to soil particles. The qualitative pattern of migration will depend upon: a) density of the NAPL; b) quantity and rate of introduction of the NAPL (large "instantaneous" spill ",. slow leak); and c) the soil pore structure (see, for example, Domenico and Schwartz, 1990; Dragon, 1988; Farmer, 1983). The following
The pattern will depend upon the existence of soil mGcropores or channels, which will allow the NAPL to migrate downward. Ifthey are available, the liquid will flow downward primarily through the macropores, po88ibly in a dendritic pattern (Figure 4),88long88sufficient liquid is available to
maintain a continuous flow. AsFarmer (1983) points out, however, when further source material is no longer available, the stream looses continuity and forms into discontinuous droplets, or "blobs", with insufficient energy to deform so88to pass through adjacent smaller pores (see Mayer and Miller, 1992
for a discussion of dependence of this phenomenon on pore characteristics). This mechanism appears to befar more important in retaining hydrocarbons than other mechanisms such88sorption: Dragun
(1988) points out that this reaiduGI,Gt.rGtion can remain in the soil in this state "for years". For small leaks taking place over a short period of time, all of the material willbeconverted into residual saturation. For somewhat larger quantities, the material will continue downward until encountering the capillary fringe. From there it may continue downward through larger pores not filled with water, and also spread laterally under the influence of capillary forces, until it is converted into residual saturation.
It is interesting that the lateral spread of NAPL near the top of the capillary fringe is expected to be faster than near the groundwater level because relGtive permeability is less near the groundwater level. Still larger amounts of oil will form a "pancake" layer at the top of the water table; &8 the amount of
material increases, the capillary fringe willbecollapsed, and the groundwater level will bedepressed under its weight (Figure 4).
In the absence of macropores, the NAPL willbegin to spread laterally, saturating an oval shaped volume of soil, until it finds macropores (or creates a network of macropores), at which time relatively rapid downward migration will occur. This pattern is shown in Figure 5.
Lateral migration of the "pancake" will in general bein the direction of the hydrostatic head gradient. The rate of migration willbeslowed by the capillary water, but will continue until a discharge area is reached or until all of the NAPL is converted to residual saturation or becomes dissolved in the groundwater.
Fluctuations in the water table have a substantial effect in allowing the floating NAPL in the "pancake layer" to come into contact with previously uncontaminated soil. Aspointed out by Farmer (1983) and also by Domenico and Schwartz (1990), fluctuations either up or down will lead to transfer of material from the liquid mobile phase to that trapped &8residual saturation. Fluctuations in the
water table would alsobeexpected to increase the amount dissolved in the ground water.
---water level
---water
-level
surfaQe.._....
2.3. Dissolution
sa
Petroleum Hydrocarbonsim2
~groundwater.Hydrocarbons are only sparingly BOluble in water. While this might at firat be regarded as a helpful circumstance, in fact it is the reverse for two reasons. Firat, even very small quantities of certain petroleum components will render water undrinkable either because of toxic effects or because of taste and odor. Second, the sparae solubility contributes to the persistence of petroleum contamination, once it is introduced to the soil environment.
Petroleum hydrocarbons may be introduced
to
the groundwater in lleveral ways, depending upon the state of the hydrocarbon:• Free NAPL.
This material may reach the groundwater alowly enough to go directly into solution in the groundwater. If a layer of free product is formed on top of the groundwater, then this material will dissolve from the NPAL-water interface. Farmer (1983) points out that since groundwater flt'" isaaaociated with very little vertical mixing, downward dispersion relies primarily on diffusion. As a result, groundwater contamination would beexpected tobe
greatest near the interface and to decrease downward.
• PH trapped in the vadose zone as residual saturation.
For hydrocarbons trapped&8residual saturation in the vadose zone, the primary
pathway is through displacement and dissolution by infiltrating precipitation, although this pathway might make limited contribution in urban situations, where the surfaceis paved.
A second pathway involves fluctuations in the water table. As the water table rises, this material is brought into direct contact with the water. As the water level fluctuates, material present&8a floating pancake layer will be swept (up or down) through the soil and contribute
A third mechanism, which has beenshownto make a surprisingly large contribution,is
vaporization and migration in the gas phase through the unsaturated zone (Mendoza and MeAlary 1990; see also the discussion in Domenico and Schwartz 1990, p. 604).
2.4. Modeline~movementgfPetroleum Hydrocarbons
ill
~S2il
The nature of the physical and chemical mechanisms that govern the process of transport of petroleum hydrocarbons (PH's) through the unsaturated lonetothe groundwater, and migration within the saturated zone are well understood, and a number of attemptstomodel these processes have been reported. A number of difficulties, however, interfere with attempts to model the process,
including the large number of parameters needed and the high degree of site-specific idiosyncracy. These problemswill be discussed later in this section, after discussing the way in which the physical mechanisms may be reflected in mathematical models.
2.4.1. Modeling the Migration of Pollutant through the URlaturated Zone.
Bonazountas (1988) distinguishes between modelsbasedon a "traditional" differential equation formulation ("TOE" models) and compartmental models. The model of Abriola and Pinder (1985a and b) is an example of the TOE type of model. Itrepresents each phase as a continuum. Within each phase, cl888ical microscopic m888 balance laws of continuum mechanics are used, and volume averaging techniques areusedfor describing behavior in a porous medium. Bonazountas discusses some of the drawbach of TOE models, which include limitation on the number and type of processes that can be conveniently considered, difficulty of experimental verification, and difficulty of numerical solution. In addition, heterogeneity of the soil is extremely difficult to handle within the TDE framework, requiring use of spatially varying parameter values. Randomly placed discontinuities, such as macropores, present even more formidable difficulties.
The POSSM model (Brown and Silvers, 1986; Shields and Brown, 1989) is an example of a compartmental model. The soil column is divided into layers, each layer being treated as a compartment, governed by an overall balance equation,
change
=
inflow - outflow - transformation/degradation.Parameters relating to moisture inflow and outflow are empirically determined, while
Bonazountu (1988) lists a number of well documentecl models for dynamics of contaminant transport, including models which deal with the unaaturateclzone. Itseems clear, however, in the light of the difficulties notecl above, that models at any reasonable and feasible level of detail cannot be expectedto yield precise descriptions of the dynamics of flow and distribution of PH's in the vadose zone. Itseemsfarmore realistic to make do with an imprecise prediction, to evaluate the degree of imprecision, and, within the paradigm of decisionanalysis, to estimate the value, in a given situation, of trying to makethe prediction more precise.
Another approach to modeling contaminant distribution in the vadose zone is discussed by Dragun (1988), who presents approximate formulaa for the volume of soil needed to immobilize a given volume of hydrocarbon and for maximum depth of penetration. Ifone can assume that the
distribution haa reached equilibrium or steady state, such a description may be just what is needed to estimate the "source strength" for resupplying the groundwater with solute.
2.4.2. Modelin, the diuol'dion of Pdroleam H,drocar6ou into the aqueotu phtUe.
Dissolution of soluble components of PH into the aqueous phase will take place either at the PH-water interface or, in the vadose zone, at the vapor phalMHqueous phase interface. Dissolution at the petroleum-water interface is discussed in detail by Pfannkuch (1984). He points out that four processes must be considered:
(1) diffusion of material dissolved in the NAPL phaseto the interface (whether the NAPLis
present aa bulk material, say, floating on the groundwater surface, or aa separated globules held aa residual saturation);
(2) the dissolution reaction, in which molecules are releasedfrom the petroleum phase to the aqueous phase;
(3) diffusive transport of the material from the interface into the water; (4) advective transport of water to the petroleum interface.
Pfannkuch points out however that some degree of simplification mayarise, since at the groundwater flow regimes normally encountered, the process is dominated by the equilibrium solubility, which presumably may be gauged by measures such as Kow' the octanol-water partition coefficient.
The problem of dependence on a largely unknown contact area remains, however.
Mendoza and McAlary (1990) have pointed out that for more volatile substances, the process of di880lution from the vapor phase may be important. Their sinlulation model for dissolution of trichloroethylenerequired the useof a number of context-dependent parameters, with regard to which the domain was 888umed to be homogeneous:
bulk water content (unsaturated zone) porosity (saturated and unsaturated zones)
effective diffusion coefficient (saturated and unsaturated zones) longitudinal and transverse diffusivity (both zones)
retardation factors (both zones) water table diffusion thickness.
It should be noted that Mendoza and McAlary do not appeartooffer their model as a basis for prediction or description in specificcases,but rather as a basis for demonstrating that this often neglected process has the potential of being very important.
2.4.3. Modeling migration in the groundwater.
Principles governing migration of dissolved materials in groundwater, and their mathematical description, are discU88ed in detail by Domenico and Schwartz (1990). At least two processes must be considered: advection and dispersion, although some authors appear to include sorption and the resulting chromatographic effect (seebelow) as an important contributing factor (e.g., Fried, Munster and Zilliox, 1980).
Normally, advection is the dominant process. In this process, the dissolved material is simply carried with the moving water, at the same velocity as the water. Flow of the solute would then be described in terms of movement of a "plug" of uniform concentration.
Mathematically, in one dimension, the flux of a particular solute through a volume of porous medium, is given by
J=vCn,
water through the pores. Velocity, v, is generally deacribed using Darcy's equation. The form suggested by Domenico and Schwartz includes a correction for effectiveporosity Re,
V -
- -fie
K 8hBT'
whereK is hydraulic conductivity, and8h/81is the hydraulic gradient.
Ifadvection were the only dispersive process, the boundary between contaminated water and uncontaminated water would be sharp. This boundary is made fuzzy by the process of diffusion. This processisresponsible for a widening of the solute plume in the horizontal and vertical directions, and also for presence of solute in advance of the front predicted by pure advection. Fundamentally, the process of diffusion is caueed by the random motion of solute molecules being superimposed on the moving frame of the solution. The random motion of the individual molecules leads to the net movement of molecules from regions of higher concentrationtoregions of lower concentration that is, to net movement down the concentration gradient.
Classically, in one dimension, solute mass flux in a liquid medium is given by Fick's law,
J -
- -
D8C&'
where D is the "diffusion coefficient", whoee magnitude depends upon mobility of the individual molecules in the solvent medium. In three dimensions, this becomes,
J
= -
Dgrad (C).In a porous medium, the situation is considerably more complex. Two corrections are called for. First, as for the cue of advective movement, we must correct for the fact that movement only takes place in the pores. Second, as demonstrated by Whitaker (1967), a correction is needed because in the irregular geometry of the porous medium, collision of solute molecules with pore walls hinders free diffusion. Whitaker refers to this as a ton.03it,effect. The tortuosity effect, based on the "microscopic" phenomenon of molecular collision with pore walls, must then be averaged over a macroscopic volume in order to arrive at a deacription of solute movement in termsof oheervable phenomena. The result, as diacusaed by Domenico and Schwartz, is that in practice, models must rely on empirically determined 6.1k or effectivediffusion coefficients.
The extent to which a given chemical willbe retarded will depend upon its relative solubility in water and the organic pha8e (which is related to the octanolJwater partition coefficient), and on the soil organic content. AA Dragon (1988) points out, the most common method for expressing the
distribution between soilsurfaee and water phase is the equilibrium ratio,
Kd
=
C./C
e,whereC.
and C e are concentrationsatthe soilsurfaee (per unit wt. of soil) and in the water phase, respectively. Experimentally it is found that variation between ofK dfor a given chemical between soils_can be reduced by normalizing for soil organic matter or soil organic carbon,Km Kc Kom
=
"'Jftr and Koc=
OC'where om and oc are soil organic content and soil carbon content, respectively. Dragon presents
experimentally determined values of these parameters for a variety of organic chemicals. Dragun (1988) and Domenico and Schwartz (1990) present mathematical formulations which relate the degree of retardation to soil porosity and the value ofK d' The approximate nature of such calculationsis, however, highlighted by Dragun's statement that the equation "has been usedsuccessfully to estimate the velocity of organic chemicals, such as PCBs, dioxin and pesticides within a factor of two to three in relatively unstratified soils". The retardation may lead to a separation of constituents of the oil product. The mechanism is similar to that which underlies the analytical method of chromatography, and is thought to lead to a significant separation of oil constituents (e.g., Fried et al., 1980).
2.4.4. Uncertainty and Variability in the Transport Process.
Inrecent yean, a number of worken havebegun to addreas theae problems through the construction of stochutic models (Kiefer, 1993; Zhang et al., 1993; McLaughlin et al., 1993). The question of uaing probability diatributiODa (the neult of IUch .toc:hutic models) as a basis for
management and decision making h.. been explicitly considered in a hydrogeologic context in a aeries of articles by Freese and c:o-workers (Freese et al., 1990; MUBID&DD et al., 1991). Anadvantage of explicitly considering the uncertainties, and describing them with probability distributions, is that one can then design measurement and monitoring procedurell that give the most valuable information for a specified level of effort. This point is elaborated on in detail by Freeze et ale (1992; see also Beven, 1993).
2.5. Biological Degradation.
A number of proceues operate in the soil and groundwater environment to remove or degrade petroleum hydrocarbons. Chief among theae is biodegradation. When petroleum hydrocarbons are introduced to a soil environment, there wilJ generally be marked stimulation of microbial activity, as naturally occurring microorganismsWIethe organic compounds .. an energy source. The oxidation
process must, of course, be coupled with reduction of oxygen or other electron source, leading to the alteration of the soil redox potential. The stimulation of this degradative process as a remediation procedure wilJ generally require resupplying the soil environment with oxygen as well as with other nutrients.
The process of biodegradation of organic chemicals in the soil is reviewed by Dragun (1988). Becker (1992) reviews biodegradation of gasoline components with particular referenceto use of iron(II1) as an electron acceptor.
The operation of these processes has lead to the auertion that motor fuels must be regarded as "nonpersistent" contaminants of soil (Bauman, 1989). Other research (for example, Barbaro et al., 1992) does not lead to so optimistic a conclusion. In any case, biodegradation of hydrocarbons is not an unmitigated blessing. While toxicity of the hydrocarbons may be reduced, the metabolic processes (see description of pathways in Dragun, 1988) produce products which may makeWIeof the water
Within reasonable ranges of concentration, the biodegradation of many organic chemicals seems to follow firat-order kinetics (Dragun, 1988).
where
C
is concentration. The problem in modeling biodegradation in a contaminated aquifer is thatk
depends upon a variety of factors, including:
• abeand composition of the microorganism population; • inhibitory effect of other chemicals present;
• acidity of the eoil;
• oxygen concentration and the redox potential.
Each of the factors in this list is itself changed by the process. Growth of the microbial population, in particular, is generally described by the Monod hyperbolic rate law,
V
=
VmaxCK+C'
where
V
is the specific growth rate of the microorganism population,C
is concentration of the organic material, and concentration of oxygen (or other electron acceptor) is implicitly assumed constant. A more general expression wasusedby Schafer and Kinzelbach (1992), assuming supplied oxygen to be the only electron acceptor,where DOP and DO stand for dissolved organic pollutant and disaolved oxygen, respectively.
Because of the difficulties involved, it is not uncommon to see models, such as that of Schafer and Kinzelbach, which are models of idealized prototype systems, intended for development of
understanding of relevant relationships, rather for direct prediction and management of individual leak sites. Some recent models have been developed with incorporate both transport and biodegradation processes (for example, Dhawan et al., 1993).
2.6. Concentration
m:
contamipantill
well-water.flow velocity distribution over the length of the wellacreeD. An exact IOlution to this problem is computationally formidable. A simplification (API, 1992) is to average the concentrations over a set of equally spaced vertical intervals.
3. TOXICOKINETICS: ABSORPTION OF THE "BTEX" COMPOUNDS
Following the eequence indicated in Figure 2, the next topic for discU88ion would seem tobean examination of patterns of water use,10that we might evaluate the ways in which water use leads to
exposure to the volatile organic compounds of petroleum. However, in order to understand the relevance of various possible exposure pathways, it is necessary to understand how the substances are ablOrbed into the body. The severity of exposure to a toxicant maybemeasured in terms of the concentration in water or air, together with the duration of exposure and such parameters as breathing rate or volume of water ingested. The actual dose received by the body isa1BO determined by the rate of penetration through the stomach and intestinal membranes for ingestion, through the lung for inhalation or through the skin for dermal ablOrption.
The general principles of the mechanisms by which toxic materials are abBOrbed and distributed through the body arediacUBBedby Guthrie and Hodgson (1987a). They discU88 four physical mechanisms whereby substances can cross membranes to enter the body:
• PtUaive tlilfuion which depends primarily on the miscibility of the xenobiotic with membrane lipid;
• Filtrationby which small molecules may passselectively through membrane pores;
• Facilitatedand active tranaport, which depend upon special carrier mechanisms;
• Endocytoail, inwhich the membrane flows around the xenobiotic, "capturing" it.
For the compounds we are discU88ing, passive diffusion is likely tobethe dominant
mechanism. The rate of diffusion of a IOlute from dilute IOlution across a membrane can generallybe
approximated by the linear relation of Fick's law,
J=K~C,
where J is the net flux acroes the membrane (mass/time per unit area), ~Cis the concentration difference across the membrane (mass per unit volume) and K isa proportionality constant
(permeability coutant) with dimensions of volumeper unit time per unit area. In computing toxicant uptake, it isgenerally assumed that ~Cisequal to the concentration in the exposing medium (say, water or air). The total abBOrbed dose received during anyperiodof time canbeexpressed as
D
=
Jx.A. xT,whereA is membrane area andT is exposure time. Taking /1C to beC,the concentration of the toxicant, we can then calculate the abeorbed dose as
D=KxCxAxT.
Ideally, one might hope to determine the permeability of a particular type of membrane from laboratory measurements, and perhaps to evaluateA from general physiological considerations. Then, using the exposure _ments discussed above to evaluateCand T, we would be able to estimate the total dose received. Indeed, such procedures are followed only in the cue of estimation of dose from dermal abeorption. The difficulties of estimating membrane permeability as well as area, and even exposure time to the relevant membranes, have lead to the practiceinsteadof using empirically determined abeorption efficiencies, as discussed below.
Note that the discussion in this section deals only with estimations of abeorption from contaminated water. Other considerations are brought into play when considering ingestion of
contaminated soil (deliberate or accidental) or dermal abeorption from contaminated soil. These routes may be of importance in considering risks to children, or to workers involved in remediation.
3.1. Ingestion.
Until a few years ago, ingestion was thought to be the principle route of entry for contaminants in water. For a given compound, the abeorbed dose is easily expressed, as
Do
=
EoxCwxVo'where Doisthe abeorbed oral dose, Eois abeorption efficiency, Cw the concentration in the water, and
V0 the volume consumed. The BTEX compounds are generally accepted as being easily absorbed
through the gastrointestinal tract. Shehata, for example, (1985) assumes 100% abeorption for benzene, toluene and xylene, based on earlier EPA documents. Similarly, Jo et al. (1990) assume 100%
absorption for ingested chloroform.
3.2. InhalatioQ.
In order for a volatile water contaminant tobeabsorbed through inhalation, it must first be
machines and especially showers. AsdilcU88ed below, bathroom environments provide confined spaces combined with conditions which lead to volatilisation.
The dOle abeorbed through respiration may beexpressedu (see, for example, Shehata, 1985),
whereEr is the efficiency of abeorption through the lung,
Co
is concentration in the air respired, Vr isthe volume ofair respired, generallyexpressedu volume ofairperunit time, andT is duration of exposure. Shehata quotes EPA documents indicating 50% abeorption for benaene, 93% for toluene and 64% for xylene. Clearly we might expect some degreeof individual variability in these figures. Such variations might conceivably be related to age and health state,u well88inherent, i.e., genetic
differences.
With respect toVr' the respiration rate, Shehata quotes National Academy of Sciences estimates of 8 m3/day for children and 20 for adults. This numbertoois easily seen to be subject not only to uncertainty, butalsoto very broad individual differences depending on age and health state, and temporal differences depending upon degree of physical activity.
3.3. Dermal A6,orption.
In the cue of oral and respiratory abeorption, the xenobiotic is abeorbed across a membrane "designed" for efficient absorption. Skin, on the other hand is normally thought of88a barrier.
Several routes however, are available for penetration, including movement through hair follicles and sweat ducts,88well diffusion through the stratum comeum (Guthrie and Hodgson, 1987a). Under
normal conditions, Guthrie and Hodgson point out that direct movement through the stratum corneum is the dominant pathway for lipid soluble xenobiotics. However, skin lesions will enhance abeorption.
Direct measurement of penetration efficiency is, for the most part, basedon work with experimental animals. However, there are substantial differences in the penetration efficiency for different animals, and it is far from clear what animals are the most appropriate models for humans; indeed, it may depend upon the type of substance. Data quoted by Guthrie and Hodsgon for
permeability to benzoic acid and acetylsalacylic acid show permeability for pigs, rats and humans tobe substantially below that of mice. Other data indicate very wide variations depending upon anatomic site. Measurements quoted for permeability to hydrocortisone show permeability for the scrotum tobe
A number of other factors are relevant. Guthrie and Hodgson point out that detergents can markedly inereaae penetration. Penetration is also increaaed by high temperatures. Finally, while many measurements of.kin penetration for hydrocarbons havebeenmade with the pure liquid hydrocarbon, abeorption from dilute aqueous solution haa been found to be much higher than from pure liquid, on a per unit concentration buis (Brown et al., 1984). All of theee factors are relevant to the estimation of abeorbed dose from domestic showers or baths.
Some authors have attempted to estimate the level of dermal abeorption for volatile organic compounds directly from Fick'slaw in the form,
Dd
=
KdxCw xAxT,whereK dis the dermal permeability constant and A is the body area expoeed. Brown et al. (1984)
usedliterature values for Kd determined for toluene, ethylbenzene and xylene from direct exposure of a human hand to dilute aqueous solutions. Assumptions about body area exposure were: 80% for adult bathing; 75% for infant bathing; and 90% for children swimming. With theee 888umptions, they estimated the dermally abeorbed dose for low concentrations of ethylbenzene and toluene to be about two to three times that from ingestion for adults who spend 15 min. per day bathing, about equal to the ingested dose for infants bathed for 15 min. per day, and about 10 times the ingested dose for children who spend 1 hr. per day swimming.
Brown et al. point out that a number of factors were neglected in theee calculations. Some of the factors discUBBed are,
• Temperature. Increased temperatures will enhance abeorption, so that amount absorbed
during bathing is likely to be underestimated.
• Skin condition. Insults to the stratum corneum (sunburn, cuts, wounds, abraaions, skin
disease) will increase absorption.
• A natomical region. Permeability coefficients werebasedon measurements of hand absorption. Brown et al. cite studies indicating that the hand epidermis haa lower permeability than many other regions of the body (Guthrie and Hodgson above also discuss theee results).
• Soaps and detergenb will substantially increase penetration.
• Other routes of ent,.,. Brown, et al. cite other studies to indicate that other tissues which
Other authors have attempted to develop models from fundamental principles of mass transfer, thatwill predict skin permeability to specific compounds, using the compound's octanol-water partition coefficient and molecular weight (McKone and Bowd, 1992).
Becauae of the difticulties in estimating dermal abeorption baaedon the uae of Fick'slaw, itis
interesting to look at an experiment conducted by Jo, et al. (1990&), who t.ried to determine the relative proportione of chloroform abeorbed in showering through inhalation vs. dermal abeorpt.ion. Subjects were aeked to shower normally, and separately to "ehowertt
while clothed in rubber clothes and boots to avoid dermal contact. Relative degree of chloroform abeorption was evaluated from concentratione of chloroform in the breaths of the subjects. The results indicated that the dose received by dermal abeorption was approximately equal to that received through inhalation.
4. POPULATION DEVELOPMENT, LAND USE, AND CATEGORIES OF WATER USE. It is not possible to define the risks associated with a given level of water contamination without first specifying the size and type of the population that will be OIing the water, together with the type and amount ofOle. Clearly,ifthe water isn'tUIed, there is no risk. Moreover, if the
argument of Baumann (1989) is accepted, that petroleum contamination is non-persistent, one may conclude that if the aquifer will not be UIed for an extended period of time, say 30 to 50 years, there is little risk from petroleum hydrocarbone.
Ifwater that is currently beingUIed from the aquifer is threatened by the petroleum
contamination, then it will usually be possible, through monitoring and cOmputational projectione, to estimate the population exposure to toxic contaminants. Bowever, in evaluating the risks associated with alternative couraes of action as regards the contamination, possiblefut.re U8e8 become relevant.
In conaidering the influence of land and waterOleon risk management and remediation
decisiona, one may take one of several alternative couraes of action, which include: • base decisiona on current land use;
• base decisiona on best estimate of future landOle;
• basedecisions on t.he assumption of t.he moet senait.iveOle(Bee,for example, Kirkwood,
1985);
• basedeciaiona on an evaluation of t.he suitability and probabilit.y distribution over the let of poMible fut.ure U8e8(as might be done in a Bayesian risk analysis);
Figure 6, based in part on the land UBelisting of Saft (1990) is intended to illustrate the kinds of land UBeand development patterns that might influence exposure and risk.
Estimates of the relative likelihoods and desirability of various types and densities ofUBe for a
particular parcel of land over a thirty year period must, of course, be regarded as highly uncertain and speculative. Among the factors that might influence relative likelihood of various altemative types of development are(leeSalt, 1990):
• The demographic and economic description of the community.
• Historical and anticipated trends in the demography and economy of the community. • Historical and anticipated trends in the demography and economy of the larger region. • Topography of the site, which may determine the feasibility of various types of uses. • Availability ofsimilar type of property (e. g., lakeside property in an area in which there is
much tI••little lakeside acreage).
• Existence of other development in the area which may be incompatible with certain uses (e.g., residential vs. industrial) or might lead to zoning restrictions.
Itis clear that specific projections about UBetype and intensity for a given area of land are not
usually to be relied upon. In keeping with the spirit of probabilistic risk assessment (see below), we would beinterested not in specific projections, but in estimates of relative likelihoods. In particular, the seriousness of prohibiting a particularUBe, as measured by the eqectetlco.tof such a prohibition,
would depend on the probability of thatUBein the abeence of the prohibition.
Such estimates would of necessity havetorely heavily upon expert judgment, and would have to address the question of reliability of expert judgment and disagreement between experts.
5. EXPOSURE FROM WATER USE - EMPIRICAL INVESTIGATIONS
In 1911, the Safe Drinking Water Committee of the National Academy of Sciences
recommended using a figure of 2 LId for adult water consumption in estimating health risks associated with drinking water (National Academy of Sciences 1911). This figure was chosen as a relatively safe upper bound, and has been widely used. More recently, two types of results point to the needtorevise risk assessments based on these figures. First, is the analysis by Roseberry and Burmaster (1992) of earlier reported data indicating that for the subjects studied, while mean total water intake maybe
COMMERCIAL
Offices; Retal storesandrnaIIs Hotels; RestaulW1tsPUBLIC SERVICE
G~e~m: M~«nW; ~sDrinking water,
Churches; Prisons; Hosplitals
Restaurant use;
Shower facilities
RECREATIONAL
Health clubs; Sports facilities, stadiums;
haters; amusement parks
INDUSTRIAL
Factories; Distribution cemers; Personal· drinking, showering, meals.lnudstrial Process· steam and Wwehouses; Resewch cemers
vapor inhalation
AGRICULTURAL
Field Crops; Truck Crops;Personal use (empolyees)
Poultry; Other Uvestock
drinking, showering, meals
5.1. ~consumption.
Roseberryand Burmaster (1992) report a ~anaIysisof data originally analyzed by Ershow and Cantor (1989). The analyses arebaaedon an intensive Nationwide Food Consumption Survey, conducted by the U. S. Dept. of Agriculture during theperiod 1977-1978. Following Ershow and Cantor, water conaumption was divided into two categoriea: (i) tap water intake, which includes direct consumption and water added to food during preparation; and (2) "intrinsic" water - water intrinsic in foods as purchased, including water added during commercial preparation. After dividing the data into age groupe (0 -1; 1-11; 11- 20; 20 - 65; over 65), Roseberry and Burmaster found that the data fit very well to lognormal distributions(R2 values all in excese of 0.95). Median values for total intake and tap water intake are shown in Table 1. Of poesible interest for our purposes, are figures presented by Ershow and Cantor indicating the fraction of tap water consumed directly or in the preparation of reconstituted juices and noncarbonated drinks. Assuming that at least for age groupe above 1 year, this water is not heated, while other tapwater(used in coffee, tea,and other foods) is heated before use, one may expect a difference in the concentration of VOC's in the water as consumed. Table 1 includes the average fraction of water consumed without heating,baaedon this assumption.
Table 1. Estimated Median Values for Water Intake (taken from Roseberry and Burmaster, 1992) in LId.
78.4 75.0 51.8 53.0
Age Group total tap
0 - 1 1.074 0.267
1 - 11 1.316 0.620
11 - 20 1.790 0.786
20 - 65 1.926 1.126
over 65 1.965 1.198
percent tap not heated
5.2. Routes
sa
exposUrefmm
~ ~Shehata (1985) haa pointed out that tap water provides an example of how a single source of contamination can contribute to all potentialexpoeureroutes - ingestion, inhalation and dermal absorption. Itis clear that wateruaedfor preparation of beverages, especially cold beverages, contributes to ingestion. Wateruaedfor cooking and preparation of hot beverages may have lost some or most of it. VOC content, which, however, contributes to contamination of indoorair. Other household contributions to VOC concentration in indoor air may come from:
• diahwaahen and clothes waahen; • general kitchen UI8and cleaning; • toilet.;
• showen and baths.
Showen and baths provide especially "good" opportunities for inhalation exposure, since the subject isin dose contact with hot waterina relatively confined space. Moreover, the individual will usually spend some time in the bathroomafter theair haabeenloaded with volatiles by the shower or bath. Similarly, the toilet can make a smaller, yet significant, contribution to the bathroom air. Showers and baths also provide excellent opportunity for dermal exposure and absorption.
A few authors have estimated the relative importance of the three types of exposure to water contaminants. Shehata (1985) considered specifically the problem of gasoline contaminated water, and made estimates for the compounds benzene, toluene and xylene. Computations were made separately for children and adults, and were based on the assumption of a total house volume of 450 m3,a bathroom volume of 11 m3,showering or bath time of 15 minutes, and water consumption rate of 1 L/d for children and 2 L/d for adults. In estimating the volatilization characteristics, literature values for chlorobenzene wereusedbecause of similarity of Henry's Law constants. In computing the relative contribution of oral, inhalation and dermal exposure, Shehata added estimates of amounts that might be normally ingested with food3,and for ambient air concentrations, which were taken to differ between urban and rural locations. Computations were made for water concentration ranging from 0 to 50 mg/L.
Shehata present. the most detailed results for exposure of children to benzene. Dermal absorption isnegligible. When food and ambient air sources are subtracted from Shehata's results, so
3Shebatauedlhe Naiioual AcademyorSc:ieDc:._ima&eor c:ouaumpuonorbeIa.-e&om CooclllOU1'Ce8oC
88to focus on the contribution of the contaminated water, the results indicate that in summer, the
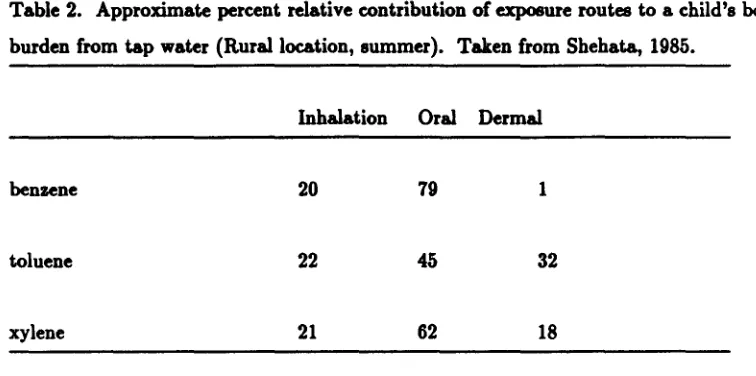
exposure is approximately 20% from inhalation, 79% from ingestion and only about 1% from dermal absorption. In winter, inhalation exposure is substantially increased, so that it makes up about 30% of the total. Toluene and xylene have much greater dermal absorption rates, and therefore dermal absorption is calculated to be a make a much greater contribution, 88shown in Table 2.
Table 2. Approximate percent relative contribution of exposure routes to a child's body burden from tap water (Rural location, summer). Taken from Shehata, 1985.
Inhalation Oral Dermal
benzene
toluene
xylene
20
22
21
79
45
62
1
32
18
Considering all pathways, Shehata computed the concentration for each compound needed to reach the EPA recommended maximum body burden. Table 3 summarizes some of the results.
Table 3. Water Concentrations to Achieve EPA's Total Long Term Body Burden, in mg/L. (from Shehata, 1985).
child adult
benzene 0.0 0.08
toluene 0.15 0.12
xylene 0.4 0.9
Other authon have examined importance of inhalation and dermal exposure to other types of VOC's in tap water. McKone (1987), in an inveetigation particularly of the inhalation pathway,used a more detailed model than that of Shehata, andal80considered ranges for relevant variables. He estimated 24-hr. profiles for airconcentration in the shower stall it8elf, in the bathroom and in the rest of the household for eeven compounds: carbon tetrachloride, ehloroform, ethylene dibromide,
dibromoehloropropane, trichloroethane, tetraehloroethylene and triehloroethylene. Theee compounds were selected beeauee theyhadbeen detected in Califomia water supplies. McKone's calculations give a range of the ratio of inhalation uptake of VOC's to ingestion intake of about 1.5 to 6. He quotes other studies indicating ratios of 1 and 2.6.
Jo et al. (1990& and b) report a eeries experiments in which they eeparated dermal from inhalation absorption of chloroform in mowen, and concluded that they contribute about equally. They cite other studies indicating that dermal absorption of VOC's canbesubstantial, and a simulation study indicating that dermal absorption, inhalation and ingestion canbeexpectedto
contribute about equally for several VOC's.
Most of the investigations concerning exposure to VOC's from tap water refer to residential use. As Figure 6 indicates, however, there may be significant opportunity for exposurein the work place, and alsoin public facilities. Ofcourse, oral exposure through drinking will have the same dependence on water concentration regardless of where the water is consumed; and dermal exposure in the shower should be about the same wherever the shower is taken. Basedon residential calculations and measurements, we might expect buildup in the air in public restrooms, as well as in communal shower facilities. Andelman (1985) cites data on trichloroethylene (TCE) concentrations in the ladies room of a municipal building during the lunch hour (12:20 PM). Inhalation exposure to worken resulting from industrial uses of water has not, apparently been widely researched.
6. TOXICOKINETICS AND THE DOSE-RESPONSE RELATIONSHIP. Toxic effects of chemicals are commonly divided into (Levi, 1987):
• Chronic toxicityrefento longertermeffects. Types of chronic toxicitydiscU88edby Levi are:
carcinogenesis
mutagenesis - hereditary changes in the genetic information stored in DNA teratogenesis - malformation of developing fetuses
organ toxicity - to liver, kidney or to the lungs behavioral effects
The BTEX compounds have been implicated in a wide variety of toxic responses. Of particular interest from a risk standpoint is chronic toxicity, and, in particular, carcinogenic activity. Of the BTEX compounds, benzene is thought to be a potent carcinogen. Itisalso the one in highest concentration in most petroleum fuels. Inaddition, it is one of the most extensively studied of the chemical carcinogens. For these rea8Ons, after a discU88ion of BOme general principles, we will focus most explicitly on benzene.
6.1. Geperal Discussiop
Once a toxicant crosses the boundary and enters the body, several process occur. First, the material enters the blood stream, where it can be distributed to remote parts of the body. Second, the compound can be acted upon by enzyme systems. Asdescribed by Hodgson (1987), there are typically two phases to this metabolic activity. The first phase introduces a polar functional group into the molecule. This sets the stage for a second phase which results in highly water BOluble compounds, which can be excreted. Although this is generally thought of as a detoxification process, it may happen that metabolic intermediates are either more or less toxic than the original. Indeed for BOme toxicants, it is a metabolic intermediate which is the BOurce of the toxicological response. This metabolic activity can occur at any point along the distribution pathway, beginning with the membrane through which the toxicant gains entry. Third, either the initial compound or an intermediate can give rise to the toxicological response. Again, this can occur at any point beginning with the point of entry of the toxicant. In particular, if it is a metabolic product which produces the response, the tissue affected may be the tissue which contains the enzymes that form the product. Finally, the toxicant or its metabolic products may be eliminated from the body - usually through the kidney or with the bile, depending upon molecular weight and BOlubility, or through the lungs for very volatile materials (see, for example, Guthrie and Hodgson, 1987b).
Consideration ofeachof theee procelle8 is important for the qualitative88well88quantitative understanding of the patterns of toxic response &om different toxicants.
The toxic response is generally thought of88taking place through some set of biochemical interactions at the molecular level. The probability of such interactions will depend upon the concentration of the toxic substance at the ceU.lar level. Figure 7 illustrates the relationship. In particular it becomes understandable that the pattern of response may depend upon the path of entry and the route that the substance takes before being mixed with the general blood supply. This is further illustrated by Figure 8 from a publication of Environ Corp. (1986). An understanding of the contribution ofeach of theee procelle8 also makes it clear that differences between species in
intermediate metabolism may lead to differences in susceptibility to particular toxicants.
When authors refer to the "dose-response" relation, it is not always clear which type of dose is being discussed. Itis, however, the exposure dose that can be moat easily measured. Moreover, unless the range of actions being considered includes medical intervention, it is the exposure dose that we can do something about. Itfollows that the relation between exposure and whole animal response is the dose-response relation of particular interest.
6.2. ~
m
evidence!2I
establishing relation betweensl2K
AWl
resPOnse.One can think of four types of scientific evidence for helping to determine the dose-response relation for a given toxicant.
6.2.1. Epidemiologic evidence.
The first, and most direct, is epidemiologic evidence, basedon observation of the effects of exposure of humans to the suspected toxicant. Such studies might involve:
• relating the incidence of water, air, or soil pollution to the occurrence in theexposed
population of some measured response.
• correlation of effect with exposure in IIOme occupation, such88in mining, or in an industry using a suspected toxicant.
DOSE
DOSE
,
3) Tissue
- - - -
...
Metabolic
~~
Levels
Products
t
4) Tissue
Concentrations
~
of Metabolic
~
Products
5) CELLULAR
Concentrations
Figure 7. Relation between IIdose
ll•
!I
Ahsorplion
Inh.a.,ic...
I
I
I
u..
L ...••
~
.
:
••
·
,
!1
II
I,
,
l
Seer.doIII
Glands1
,
Lunl
1
:... BloodaDdLympb ~••••
...---1. [::.,
u7.:.:> .~
,.--~-l ~::w
I
:rP.
Fat ..~i:il!li·;
::::::::"
;:::;:;:;::;;:;;::~:.:>;/;;:.li~
..
~i~;jl
tit::::!!'
StGnte
I
-r
b,.iredAirI
t'nne ,r
Secn!lianllI
ExcrelionCohrssen and Covello (1989) list the following conditions, which make epidemiologic investigation suitable:
- high exposure (e.g., smoking or high levels in water, soil or air) - unusual health effects (e.g., rare forms of cancer)
- clear symptoms and linkage between the effect and causal agent
These are conditions which lift the effect being studied above background noise.
Failure to satisfy these conditions compromiaes the definitiveness of epidemiologic data. Other serious limitations are absence of experimental control, and inability often to account for multiple sources of exposure, or for the confounding effects of exposure to multiple toxins. Moreover, the actual dose received by any individual can usually only be estimated.
6.2.2. Ldoratory animal do.e-re.porue .t.diu.
In the simplest type of animal study, laboratory animals areexposedto the suspected toxicant, and the incidence of response (no. of animals exhibiting the toxic response) is plotted as a function of exposure level, resulting in a "dose-response curve". In the simplest studies, the "response" might be death of the animal. Other types of experiments involve killing the animals at a fIxed time, and observing the incidence of tumors of various types. Such curves are usually re-scaled before use in estimating human risk, so that dose is put in terms of amount per unit of body weight. Unfortunately, use of such data to estimate human risk suffers from a number of serious drawbacks. The two most serious are:
• Extrapolation to low doses.
levels. For example, there is a large repertoire of biochemical toxification and detoxification mechanisms (Bodpon, 1987) which in some cues may operate so as to prevent any toxic effect from being exhibited until acertain threshold is reached.
• Intenpecies extrapolation
This problem is, if anything, more aerious, because of differences between animal species. Relevant differences include rate of abeorption by different pathways and existence or absence (or differences in the activity) of relevant metabolic pathways. Inthe caae of benzene, for example, observed relpoD11e8 in experimental animals include cancers in organs, such as the Zymbal gland, which humans do not have.
6.2.3. BiochemicalRe.porue
This type of animal experiment isbasedon prior evidence that specific metabolic
intermediates are involved the process ofdisease production. The reasoning might be that the level of toxic responae is then related to the rate at which the auppoeed toxic metabolites are produced. The experiments then involve the measurement of theae rates either ira tlitlOor in tissue preparations.
6.2.4. Ph,.iologicall, Baled PharmacoKiraetic (PBPKj modell.
Such models are be based on the formulation of a detailed chain involving abeorption and distribution of the parent xenobiotic through the body, mechanisms and rates of production of toxic intermediates, and the mechanism of toxic action. Such models are becoming increasingly useful in helping to guide both the use of results from epidemiologic and animal studies, and the design of new experiments by identifying critical informational needs.
6.3. Benzene Pharmacokinetics
ADd.
Toxicology6.3.1. Tonc E//ecu
0/
Benzene.reproductive system, interference with embryo development, and carcinogenicity. Figure 9 (Figure 1.1 from Oak Ridge Nat'l. Lab., 1989) gives an idea of the ranges in which various effects havebeen
observed.
The carcinogenic effects of benzene havebeenthe subject of 8everal recent reviews (Cox, 1991; Goldstein, 1989; Oak Ridge Nat'l. Lab., 1989; Mehlman, 1989). A variety of cancer types have been found to be caused by benzene in experimental animals (Maltoni, et al., 1989). They are to some extent species and even strain specific. In humans, however, the primary carcinogenic effect associated with benzene appears, on the basis of statistical epidemiologic evidence, to be leukemia. According to the analysis of epidemiologic data performed by Lamm et al. (1989), only one specific form of leukemia, called acute myaloid leukemia (AML) hasbeenconsistently observed to be associated with benzene exposure. Nevertheless, it seems to be not uncommon for analyses of epidemiologic studies to fail to make this distinction, and to be based onall forms of leukemia. A relevant distinguishing characteristic of AML (compared with many other forms of cancer) is a relatively short interval between exposure and death. In cases where this interval can be established, it is found to be typically less than 10 years (Lamm et al., 1989).
The mechanism of benzene carcinogenesis is not known exactly. It is established, however, that the active carcinogenic substance is not benzene, but a metabolite of benzene. Initial metabolism occurs in the liver, while the ultimate carcinogens may be formed by reaction within the bone marrow (Cox, 1991). A proposed metabolic echeme is shown in Figure 10 (from Henderson, et al. 1989). The compounds that are implicated in the toxic responses are phenol, hydroquinone, catechol and
muconaldehyde. Detoxification pathways are the paths leading to phenyl mecapturic acid, and the formation of glucuronide or sulfate conjugates. While muconaldehyde is implicated in the toxic
respon8e, muconic acid is a detoxification product. One result of this complex metabolic network is that the toxification and detoxification pathways may be thought of as competing with each other, so that the relation between exposure doee and respoD8e is unlikely to be simple (Parodi, et al. 1989).
6.4. Quantifying~
RiK -
~Pose=ResPOnse Relation.Before discussing the specific relation between doee and respoD8e, it is necessary to discuss what we will mean by each of theee terms.
6.4.1. Q."nti/Jing the Do.e.
EFFECTS CONe.IN EFFECTS EFFECTS CONC.IN EFFECTS
IN AI' IN IN AI' IN
ANIMALS (ppm) HUMANS ANIMALS (ppm) HUMANS
100.000 100.000
I
DEATHI
DEATH 1~ 10.000
EFFECTSON
OFFSPRING
1.000
EFFECTS ON
:G
i
100OAGANS- } DROWSINESS
- HEADACHE
EFFECtS ON
t
{
DIZZINESSIMMUNE 10
SYSTEM
f--OOOA
1.0
I
0.1I
MINIMALRISK0.01 _ F O REFFECTS
OTHER THAN
CANCER
1.000
EFFECTON
---i
REPRODUCTION: LEUKEMIA
100
r---~ON
I
FOAMINGORGANS
10
I
1.0I
MINI~
RISK FOR~
EFFECTSOTHER0.1 THAN cANCER
0.01
H.,A&.TtI I,;':P',..,S ,.n.M
en..,...,..
,N~B-'z."' ....
o
_~~IOH
Benzene Oxide HO.f' - - --Oxepin 0
1
O
Benzene 0 0A
~
Pre-P"enyl
I
7 /
Phenyl Mer::i~lunc
t
/
MuconaldehydeMerca~c
Acid ? O O H Gs:enzoe;eOxide BenzeoneGI~C~'
7Hl~~
HV
---
...
0 _ - 0:::... S-N-Acetyl-Cys s-N-AcetYI-CYS!
1
OH .Benzoquinone Hydroquinone Phenol Catechol Trihydroxy Benzene
0
-:,0 .. ~OH ~OH 7 . ~OH? r";r0H 0'-:' AHO~
V
~OH
-HO~OH
n n n n
Glucuronide
!!:!.!.!.!l!
Glucuronide ~ Glucuronide ~ Glucuronide ~FI
animals may also be unambiguously defined in terms of an exposure protocol over a period of time. Human exposure, OD the other hand is likely to be intermittent, with levels that vary with time. The usual 801ution to this is to express dose in terms of cumulative total amount. For example, in
discussing ingestion, the dose rate may be expreseed as mg perkgof body weight per day. This would then be multiplied by the period of time over which exposure takes place. Ifthe exposure pathway is through inhalation, the dose rate might be assumed to be proportional to the concentration of toxicant in the air, and 80 might be expre88ed in terms of ppm. Cumulative dose would then be expressed as ppm x time.
This present. a problem, of course,ifthe expoeure is through more than one medium. The usual way of handling multi-media exposure would betomultiplyeach by an assumed absorption rate (see above discussion on abeorption), and 80convert each to an effective internal dose. If it can then
be assumed that the absorption and distribution is sufficiently rapid 80 that the effect is independent of absorption pathway (as seems to be thec:ase for benzene), the. doses can simply be added.
Basing the doee-respoD8e relation entirely on cumulative dose, however, requires the
assumption that dosing rate does not matter. That is, for example, that intermittent high exposures have the same effect as lower constant exposure, as long as the average exposure rate is the same. This assumption is questionable in general for carcinogenesis (Kodell et al., 1987) and, in particular, for benzene (HenderlOn et al. 1989; Cox, 1991). The reaIOns are complex. They are related partly to the saturation of the metabolic pathways discussed above, and to the suppression of survival of leukemic cells by higher concentrations of benzene (Cox, 1991).
6.4.2. Q.4nti/ringthe Response
A number of quantitative measures of risk have been proposed (see, for example, Cohrssen and Covello, 1989; Hallenbeck and Cunningham, 1986).
• Ezce" Inliitlid••1Lifdime Risk. The probability that an individual will develop the disease in question during his or her lifetime is assumed to be a function of exposure to the toxicant, P(disease)
=
f(exposure). In most cases, there is assumed to be lOme background risk, say Po' 80 that P(disease) becomes P=
Po+
~P. In this formulation, it is usual to model ~Pas a function of exposure.probability for a single individual times the population size. Clearly, the individual probabilityU8edmust be scaled tothe same time period. Asfor the individual risk, we may express this expected number as
<
N>
=
<
No>+
<!:i.N> ,
where!:i.N is now a function of the level ofexposureof the population. Often the conversion between the quantities individual risk and populationrisk isbaaedon the 888Umption (often unstated) of a linear dose-response relationship.• Relative Rul (RR). This is the ratio ofrisk in theexposed VB. unexposed population,
RR _ proportion of cases in exposed group - proportion
in
UDexJ)08edgroup .Clearly, this may be modeled as a function of exposure level.
• Standardized Morbidit, Ratio, (SMR). Itis often not poeaible toobtain reliable estimates for an "unexposed group". On the other hand, it is usually poeaibletoobtain statistics for the general population, which leadsto the use of the SMR measure,
SMR _ incidence rate in exposedgroup - incidence in generat population
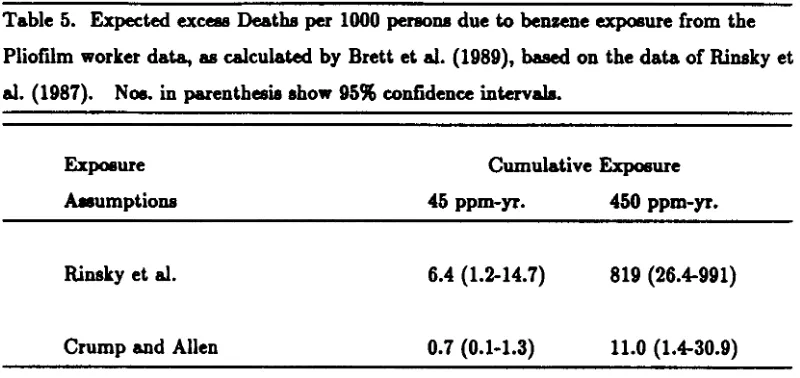
• Odds-Ratio (OR). Whereas the probability of a "win" might be thought of as the proportion of individuals in a groups who "win", the odds might be interpreted as the ratio of winnerstolosers. Formally, the odds would be the ratio. P /(1 - Pl. IfPe is then the probability of mortality in an exposed group and Pc is probability of mortality in a control group, the odds-ratio would be,
This is a convenient measure to use in the context of logistic regression (Kleinbaum et al., 1982), and wasU8edby Rinsky et al. (1987) and Brett et al. (1989)tostudy benzene carcinogenicity (see diacU88ion below).