ABSTRACT
SESHADRI, ADITHYA. SESSIONS ANALYSIS: MINING ONLINE TOOL USE TO PREDICT THE PERFORMANCE IN BLENDED COURSES. (Under the direction of Dr.Collin Lynch.)
Can we predict the student performance from the interactions with online tools in a
blended course environment? Massive Open Online Courses(MOOC) have been analyzed
in depth to predict the student performance and cluster the students based behavior from
the clickstream data. Unlike MOOCs, blended courses are delivered using lectures and
additional online tools. In this thesis, we present a study that adopts Educational Data
Mining approach similar to MOOC analysis and analyze the dataset on a blended Discrete
mathematics course, CSC 226 at North Carolina State University.
The course we analyze uses standard lecture sections, TA office hours, peer tutors, and
three online tools: Moodle, Piazza, and WebAssign. In this analysis we will focus on the
three online tools alone. We present the study and results based on the different types
of interactions by students with these tools. We do this by defining sessions of activities
through out the semester based on the timestamps from the logs when students interact
with these tools. We proceed to define two types of sessions, Browser sessions and Study
sessions based on the purpose and duration of the activities. Then we identify the sessions
from the logs and grouped per each student in the course. We investigate the sessions to
identify patterns among students with similar performances in the course. Similar to the
predictive analysis on MOOC data, in this thesis we apply these techniques to verify if the
sessions of online activity and their parameters are able to predict the performance of the
© Copyright 2016 by Adithya Seshadri
SESSIONS ANALYSIS: MINING ONLINE TOOL USE TO PREDICT THE PERFORMANCE IN BLENDED COURSES
by
Adithya Seshadri
A thesis submitted to the Graduate Faculty of North Carolina State University
in partial fulfillment of the requirements for the Degree of
Master of Science
Computer Science
Raleigh, North Carolina
2016
APPROVED BY:
Dr.Tiffany Barnes Dr.Rangaraju Vatsavai
Dr.Collin Lynch
DEDICATION
To my parents.
To my brother.
To my friends.
BIOGRAPHY
Adithya Seshadri was born on 27th January, 1993 in Chennai, India. He is the first son to
his parents. He completed his high school from Vidya Mandir Senior Secondary School,
Chennai. He pursued his Bachelor’s in Computer Science and Engineering at Shri
Sivasub-ramaniya Nadar College of Engineering, Anna University, Chennai. During his Bachelor’s,
he worked on research internships at Indian Institute of Information Technology, Chennai
and Institute of Mathematical Science, Chennai. He was the chairman of ISTE Student
chapter at SSN College of Engineering. He received his B.E degree with a distinction in May
2014.
After his Bachelor’s, Adithya was admitted into the Master’s program in Computer
Science at NCSU. He is interested in the field of AI and Machine Learning. He was given RA
at the Department of Statistics at NCSU where he worked on Statistical analysis of Galcier
terminus. He expects to complete his Master’s degree with a thesis in May 2016.
Adithya is a music enthusiast. He learnt to sing and play the violin till his graduation
TABLE OF
CONTENTS
LIST OF TABLES . . . vi
LIST OF FIGURES. . . vii
Chapter 1 INTRODUCTION. . . 1
1.1 Motivation . . . 1
1.2 Goals and Hypothesis . . . 2
1.3 Outline of the Thesis . . . 3
1.4 Literature Survey . . . 4
1.4.1 Educational Data Mining . . . 4
1.4.2 MOOC . . . 4
1.4.3 Prediction . . . 6
Chapter 2 DATA. . . 7
2.1 Course . . . 8
2.1.1 Moodle . . . 8
2.1.2 WebAssign . . . 9
2.1.3 Piazza . . . 10
2.2 Data preparation . . . 11
2.2.1 Moodle Actions . . . 12
2.2.2 WebAssign Submissions . . . 13
2.2.3 Piazza Logs . . . 16
2.2.4 Final Grades . . . 16
2.2.5 Event Transactions . . . 19
Chapter 3 SESSIONS . . . 21
3.1 Definition . . . 22
3.2 Browser Session . . . 29
3.3 Study Session . . . 30
3.4 Session Data . . . 31
Chapter 4 ANALYSIS . . . 32
4.1 Exploratory Data Analysis . . . 33
4.1.1 Session Types . . . 34
4.1.2 Session Timing . . . 37
4.2 Behavior Analysis By Performance . . . 40
4.3 Performance Correlation . . . 44
Chapter 5 CONCLUSION . . . 53
BIBLIOGRAPHY . . . 55
APPENDIX . . . 57
LIST OF TABLES
Table 2.1 Sources of actions . . . 12
Table 2.2 Counts of Moodle actions . . . 14
Table 2.3 Counts of Piazza Logs . . . 17
Table 3.1 Types of Sessions . . . 30
Table 4.1 Counts of Homogeneous and Heterogeneous sessions . . . 34
Table 4.2 Counts of Different Session types . . . 34
Table 4.3 Kruskal-Wallis tests for the parameter with data for the entire semester 48 Table 4.4 Kruskal-Wallis tests for the parameter with data upto Test-1 of the semester . . . 49
Table 4.5 Kruskal-Wallis tests for the parameter with data upto Test-2 of the semester . . . 49
Table 4.6 Correlation of the parameter to the outcome for complete semester . 50 Table 4.7 Correlation of the parameter to the outcome upto Test -1 of the semester 50 Table 4.8 Correlation of the parameter to the outcome upto Test-2 of the semester 51 Table 4.9 KNN model accuracies for data with all attributes and without test scores . . . 52
LIST OF FIGURES
Figure 2.1 Counts of events from each source per student . . . 13
Figure 2.2 Counts of different moodle actions . . . 15
Figure 2.3 Counts of different piazza logs . . . 18
Figure 2.4 Grade distribution for the course . . . 19
Figure 2.5 Counts of events from each source . . . 20
Figure 3.1 Histogram for different values of Timedelta . . . 23
Figure 3.2 Histogram for different values of Timedelta with change of platform among consecutive actions . . . 24
Figure 3.3 Histogram for different values of Timedelta with no change of plat-form among consecutive actions . . . 25
Figure 3.4 Histogram for different values of Timedelta with the second action as Moodle action . . . 27
Figure 3.5 Histogram for different values of Timedelta with the following action as Webassign submission . . . 27
Figure 3.6 Histogram for different values of Timedelta with the following action as Piazza post . . . 28
Figure 4.1 Counts of different sessions . . . 35
Figure 4.2 Number of sessions with different actions per session . . . 36
Figure 4.3 Number of sessions with different duration counts . . . 37
Figure 4.4 Occurrence of sessions through the semester . . . 39
Figure 4.5 Occurrence of sessions with assignment deadlines and test dates . . 40
Figure 4.6 Distribution of sessions over different days of the week. . . 41
Figure 4.7 The number of sessions and time per day spent by the Distinction students . . . 42
Figure 4.8 The number of sessions and time per day spent by the Pass students 42 Figure 4.9 The number of sessions and time per day spent by the Fail students 43 Figure 4.10 The time gap between consecutive sessions, average duration and the average number of sessions for the three student categories. . . . 44
Figure 4.11 Box plots of gap between consecutive sessions, average duration and the average number of sessions for the three student categories. . . . 46
CHAPTER
1
INTRODUCTION
Motivation
Massive Open Online Courses(MOOC) generate large amounts of click stream data and
these data have been extensively mined and studied to classify students based on their
interactions with online tools and also to predict the performance of students on the MOOC.
The motivation for this project is verify if such techniques can be employed on blended
1.2. GOALS AND HYPOTHESIS CHAPTER 1. INTRODUCTION
lectures and additional online tools that help students to manage course work outside the
classroom.
A key difference in applying data mining techniques on MOOCs and blended courses
arises due to the nature of the data. For MOOCs the clickstream data constitutes the sum
total of the students’ experience with the course while in blended courses the students
interact both in-class and online. In this study we have no data regarding students’ course
attendance, their in-class experience, or even their use of traditional materials such as
textbooks. Our analysis is based solely upon their use of non-integrated online tools which
collect less information than all-encompassing MOOC platforms. This poses a challenge to
the applicability of our analysis.
Goals and Hypothesis
The ultimate goal of this project is to predict the students’ outcome in a blended course
based on their online activity sessions. However, to achieve this goal we need to demonstrate
that there exists some attributes of the sessions that are capable of predicting the student
performance. We therefore propose the following hypotheses:
• Hypothesis 1:The properties of a session such as the number of sessions, duration of
the session and time between sessions can predict the performance of the students
as Pass and Fail in a blended course.
• Hypothesis 2:The occurrence of the sessions gradually increase and spike as the
1.3. OUTLINE OF THE THESIS CHAPTER 1. INTRODUCTION
• Hypothesis 3:The number of homogeneous sessions are much more common when
compared to heterogenous sessions.
Outline of the Thesis
The thesis is organized into chapters. The first chapter describes the motivation behind this
project. It also introduces the hypotheses for this project and reviews the existing literature
related to this project. The second chapter presents the raw data used for analysis in this
thesis and explains the steps taken towards processing and organizing the data for data
analysis. The next chapter examines the processed data to define the concept of sessions. It
also presents the intuition behind the definition of the sessions. Chapter 4 is the central
chapter of this thesis which discusses the methods and analyses performed in this project.
It describes the methods adopted to understand the sessions in a blended course and also
to test the hypotheses propesed in the previous section. Towards the end of the chapter, we
present the statistical analyses to find the correlation between the session properties and
the student performance and also build a model to predict the student outcome based on
these session properties. The final chapter summarizes the results and conclusion of the
1.4. LITERATURE SURVEY CHAPTER 1. INTRODUCTION
Literature Survey
Educational Data Mining
Educational Data Mining(EDM) is an interdisciplinary research field that deals with the
development of methods to employ data mining techniques to the data originating in
educational context as stated in[RV10]. These methods are developed to understand the
learners’ behaviour. The results mined from the data can be used to improve the course
structures, intelligent tutoring systems, usage of Learning Management Systems(LMS) and
Course Management Systems(CMS).
EDM is a very broad field that is actively being explored in all its sub-fields. The
dis-cussion in [RV10] presents the state of the art in multiple research aspects of the field
such as Student Modeling, Detecting undesirable student behavior, Predicting student
performance, Social Network Analysis and so on.
MOOC
MOOC data have been the explored and analyzed extensively in EDM. MOOC provides
the facility to collect data on different parameters to reveal insights on course delivery,
student engagement and performance. The paper[Sea14]performs behavioral analysis on
an edX course data to show how MOOC data can be analyzed in different ways to address
important issues: attrition/retention, distribution of students’ time among resources and
use of resources during problem solving. They compare the time spent on tasks by different
1.4. LITERATURE SURVEY CHAPTER 1. INTRODUCTION
homeworks but account for 92% of total time spent on the course. They also find that 60%
of time was invested by the 6% of students who earned a certificate.
Another interesting aspect to study is to look at the different patterns in behavior of
students with different grades. The paper presented as[WR14]uses the clickstream data
from two MOOCs to characterize the sessions by mining student behavior within individual
sessions. They monitor the students activity and detect the frequent sequence of actions
performed by students using N-gram model. The results presented in[WR14]analyze the
sessions based on the sequence of actions for students with different grades.They present
results that show distinct behavior among students who pass, fail and receive a distinction.
Their experiments show that learning sessions can be modeled as combinations of several
session topics, which provides insights into how high-grade and low-grade students
dis-tribute their activities differently along the course weeks. Performing similar experiments of
blended course data can be useful to compare the student behavior in MOOCs and blended
courses.
While many works in the literature describe methods to identify patterns in the student
behavior in MOOCs,[Cha14]discusses the correlation between the skill and the student’s
time on task using the data from two MOOCs. They define skill as a property of the
stu-dent based the number of correct answers in a standard test from Item Response Theory
described in[Ham91]The paper[Cha14]suggests that there exists a strong negative
corre-lation between the skill and the time spent on the task and also they observed a negative
correlation between the improvement in skill and the time on task. This result encouraged
1.4. LITERATURE SURVEY CHAPTER 1. INTRODUCTION
Prediction
There have also been a lot contributions to the literature to predict students’ performance .
The paper[Rom13]mines the web usage data from moodle to predict the student
perfor-mance. They use the assignment, quizzes and forum activity to predict the final marks as 4
categories -fail, pass, good and excellent. The paper[Rom13]also presents a mining tool to
extract data from moodle. The results of the paper compare multiple algorithms and show
that the fuzzy rule learning algorithms and decision trees perform well with an accuracy of
65%.
Login data has also been studied extensively in the paper[Agn15]to cluster the students
using the students’ interaction with a tool called Connect. The work presented in[Agn15]
use clustering techniques to groups students based on their attempts,scores and logins. The
authors of[Agn15]use K-Means algorithm for clustering and found three distinct student
clusters. They found one cluster with a group of high achieving students, another cluster
with low achieving students and the third cluster with persistent students. They also show
a non linear relationship between logins and performance based the cluster results.
Another interesting work in the literature is presented in[Rui]which makes use of the
data from classroom instead of web usage. The authors of[Rui]propose a method to analyze
interactions that happen in class and use this data to predict the outcome as either pass or
fail or NA. NA denoted the students that dropped out of the course. They use attributes
like attendance and student emotions during lectures to find correlation with the grades.
The paper finally discussed methods to predict the grades using a decision tree model. The
CHAPTER
2
DATA
In this chapter, we will describe the raw data used for analysis in this project. The data we
use is obtained from the blended course at NCSU, CSC 226 on Discrete Mathematics. The
content of the data is a collection of actions performed by students on the on-line tools
during the fall 2013 semester at Department of Computer Science.
For this study we will focus on the on-line data for this course. This includes user logs
from three systems: Moodle, Piazza, and WebAssign as well as the students’ assignment
2.1. COURSE CHAPTER 2. DATA
For the purposes of this project the we collected the data from each of these sources as
web logs or database dumps or, in the case of WebAssign, by screen scraping. The raw data
was then cleaned up and stored in a MongoDB database for analysis via a custom Python
library. All the data that we use for analysis was anonymized by using anonymous keys
mapping to each student in the course.
Course
The CSC 226 course for the fall 2013 semester had 2 sections, 2 instructors, 5 TAs and 250
students enrolled. This course, Discrete Mathematics for Computer Scientists is offered
to the undergraduate students. This is an introductory course giving students insight into
Logic and Predicate calculus through in-class lectures. Additionally, three on-line tools are
used for this blended course and each tool used in this course provides different services
that allowed the students to carry out their off class activities.
The course has 10 homework assignments, 5 lab assignments, 3 mid-course tests and a
final exam, which the students are required to complete with an overall grade of C or higher
to pass the course.
Moodle
Moodle is an open source Course Management System (CMS) and it is run by the university
for all the courses. Each student has a unique id and they use this id on moodle to view all
their courses. It is used in this course to communicate information to the students related
2.1. COURSE CHAPTER 2. DATA
supplemental reading material. The Moodle data includes the student actions like viewing
course pages, assignments and submitting assignments for grading. The raw moodle data is
a table of web logs that gives all the actions performed by the students during the semester.
The moodle data collection described in Appendix A has 18430 documents (actions)
and each log in the table consists of 9 attributes. These are the different items that can be
accessed from moodle: assignment, course, book, folder, forum, page, resource, URL and
user. The actions that can be performed on these items are
• View individual and view all- Opening the items on moodle.
• View forum- Opening the forums
• Submit- Upload completed assignments.
• Submit for grading- Submit the uploaded assignments for grading.
WebAssign
Webassign is an on-line homework system provider. It is used in the course by instructors
to deliver the assignments. It also allows the students to view and complete their
home-work assignments. We collected the webassign data by scraping the webassign web-page
for the course. The Webassign data includes the information about the assignments like
topic,deadline, questions in each assignment, parts of a question and grades. It also
in-cludes the students’ submission logs and records each individual attempt at a question.
This allows us to see when students made multiple attempts to complete a given
assign-ment. The solution for each part can either be correct or incorrect and does not have partial
2.1. COURSE CHAPTER 2. DATA
The raw webassign collection described in Appendix A has 265510 documents
(submis-sions) and each submission log has 10 attributes. These attributes provide information on
the student making submission, time, assignment, question and the part for the submission
The raw webassign collection as described in??has the meta-data of each assignment during the semester. This course has 10 assignments.
• Homework 1: Logic & Proofs
• Homework 2: Circuits
• Homework 3: Predicate Calculus
• Homework 4: Sets & Predicate Calculus
• Homework 5: Sets, Arithmetic Proofs, Induction
• Homework 6: Induction, Recursion
• Homework 7: Big-O, Induction, Recursion
• Homework 8: Binary Relations
• Homework 9: Counting
• Homework 10: Graphs, Hasse Diagrams
Piazza
Piazza is an on-line Q&A platform that can be used along with learning management
2.2. DATA PREPARATION CHAPTER 2. DATA
discuss course related questions and other logistical information. Piazza data was provided
by the company as a single database dump that includes a log of the actions performed by
the students on the forums. The forums on piazza allow students and instructors to post a
question, note or conduct a poll. For each thread in the forum, piazza tracks the actions
like create, update, reply with a follow-up, reply with an answer, feedback for the replies,
likes and dislikes. Piazza also keeps track if the answer replies are made by a student or an
instructor. The data dump records all new posts, changes to posts, and replies. Unfortunately
it does not include any record of when students view a given post. In this dataset, students
were allowed to perform these actions anonymously to other students. For this project, we
removed the logs that were made anonymously from the raw data.
The raw piazza data contains both the meta-data of the posts and the actual post content.
For this project, we use only the meta data stored as collection described in Appendix A.It
includes 5306 documents. Each log has 8 attributes with information on the user making
the action, type of action, time and the thread to which action is being made.
Data preparation
For the analysis, we only use the student actions data so that their session activity can be
correlated to the grades in the course. The total number of actions on each tool and the
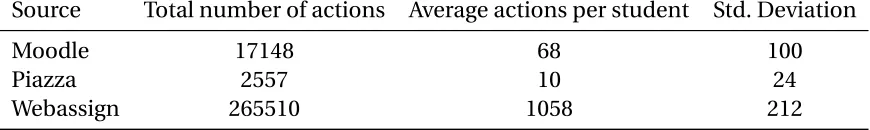
average number of actions per student on each tool are shown in Table 2.1.The raw data
described contains a lot of additional information that is not required to perform session
analysis. From the raw data we retained the attributes that provide information on the
time and type of the action. Each action also includes the anonymized name of the student
2.2. DATA PREPARATION CHAPTER 2. DATA
Table 2.1Sources of actions
Source Total number of actions Average actions per student Std. Deviation
Moodle 17148 68 100
Piazza 2557 10 24
Webassign 265510 1058 212
actions by instructors and TAs.
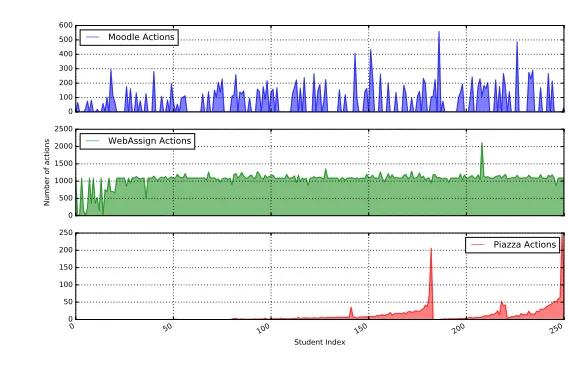
The number of actions by each student on each of the three tools is shown in Figure 2.1.
From the graph it can be inferred that webassign is the most frequently used tool. Every
student in the course performs webassign submissions even if they do not use moodle and
piazza. It can also be noted that piazza has the lowest number of events and averages only
10 actions per student. This is attributed to the fact that piazza logs only record actions like
posting, commenting and answering but not the views.
Moodle Actions
Moodle actions are extracted from the raw data by eliminating the actions from the
instruc-tors and the TAs. Each event has 4 attributes -Student name,Item type, Action and Time.
The other attributes from the raw data is discarded. Table 2.2 shows few example data rows
from the moodle actions data. The data from moodle includes 41 different action types that
students performed during the course. The total counts of each action type are shown in
Figure 2.2. It can be seen from the graph that course views, resource views and assignment
views have high numbers. The forum view actions and the submit actions are very few
2.2. DATA PREPARATION CHAPTER 2. DATA 0 100 200 300 400 500 600 Moodle Actions 0 500 1000 1500 2000 2500
Number of actions
WebAssign Actions
0 50 100 150 200 250
Student Index 0 50 100 150 200 250 Piazza Actions
Number of events per tool for each student
Figure 2.1Counts of events from each source per student
counts of each action.
WebAssign Submissions
The submissions are extracted from the raw webassign_partsubmissions collection from
the database. Each submission row defines 4 attributes -Student Name, Question title,
Part number and Time of submission. The submissions are the only action performed by
students and the total number of data rows is 265510. Students are allowed to resubmit the
same part if the previous submissions are graded incorrect. Webassign submissions are the
most frequent actions on-line that students perform during the semester in the blended
2.2. DATA PREPARATION CHAPTER 2. DATA
Table 2.2Counts of Moodle actions
Action Count
course view 8156
resource view 2832
assign view 2708
page view 1339
url view 1086
user view all 118
assign view submit assignment form 118
assign submit 86
assign submit for grading 69
ncsubook view all 58
book view all 58
url view all 58
page view all 58
folder view all 58
label view all 58
equella view all 58
imscp view all 58
resource view all 58
user view 55
assign view all 43
forum view forum 14
course view resource view assign view page view url view user view all
assign view submit assignment form
assign submit
assign submit for grading
ncsubook view all
book view all url view all page view all folder view all label view all
equella view all imscp view all resource view all
user view
assign view all
forum view forum forum view forums
Types of actions 0
1000 2000 3000 4000 5000 6000 7000 8000 9000
Counts
Actions in moodle
2.2. DATA PREPARATION CHAPTER 2. DATA
Piazza Logs
Piazza logs are obtained from the piazza_content_changelogs collection of the database.
These logs contain timestamps of actions such as post creation, comments, answers, and
updates to the posts. Each log has these 4 attributes -Student name, Thread id, Action type
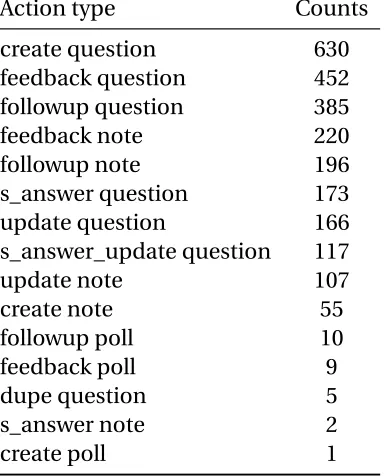
and Time of action. There are 17 actions that were performed in piazza. Figure 2.3 shows the
distribution of different actions in the dataset. Table 2.3 gives the counts of different actions
done on piazza. The graph and the table show that piazza is used mainly by students to ask
and answer the questions.
Final Grades
The final grades are included in the student meta-data. We extracted the grade and test
scores from the raw student data. The Grade scale starts withA+as the highest andFas the lowest grade. The student distribution based on the grades for the course is shown in Figure
2.4. From the graph it can be inferred that a majority of the students achieved good grades
i.e. above average performance in the course and less than 12% of the students failed the
2.2. DATA PREPARATION CHAPTER 2. DATA
Table 2.3Counts of Piazza Logs
Action type Counts
create question 630
feedback question 452
followup question 385
feedback note 220
followup note 196
s_answer question 173
update question 166
s_answer_update question 117
update note 107
create note 55
followup poll 10
feedback poll 9
dupe question 5
s_answer note 2
create question
feedback question followup question
feedback note followup note
s_answer question update question
s_answer_update question
update note create note followup poll feedback poll dupe question s_answer note create poll dupe note
attach question
Types of actions 0
100 200 300 400 500 600 700
Counts
Action types in Piazza
2.2. DATA PREPARATION CHAPTER 2. DATA
A A+ B B+ F C D C+
Grades 0
10 20 30 40 50 60 70 80
Count
Grade distribution
Figure 2.4Grade distribution for the course
Event Transactions
For the purposes of our analysis we aggregated the individual actions described above into
a unified transaction table. This data tableEvent transactionscombines the events from
Moodle actions, Webassign submissions and Piazza logs. Each row is a transaction that
is performed by a student in the course during the semester. This data consists of 285465
transactions. The relative distribution of the events from the three tools is given in Figure
2.5 and it clearly shows that the majority of the events webassign transactions.
When combining the data to a single table, two additional columns -Source and Time
2.2. DATA PREPARATION CHAPTER 2. DATA
the transaction was made. The column time difference holds the time difference between
two event transactions. To calculate the time difference, we group the transactions by the
students’ names and each group is sorted chronologically based on the time column. Then
we compute the time difference between every two consecutive actions by a student.
Source
Webassign-93.09%
Moodle-6.01% Piazza-0.90% Actions from multiple tools
CHAPTER
3
SESSIONS
In this chapter we will focus on the individual user sessions. When using an on-line tool
users typically complete a series of actions on one tool before moving on to use a different
tool, work off-line, or move to other activities. For the purposes of our analysis we want
to look at the session level to see whether or not the session information can be used to
predict students’ performance. But defining sessions is a non-trivial problem. Some simple
techniques to define a session are:
3.1. DEFINITION CHAPTER 3. SESSIONS
sessions. For example, sessions can be defined on a daily or weekly basis. Sessions
can also be defined by considering periods between assignment deadlines as the
duration of the session.
• Cutoff:Another method can be to use a cut off time. All the consecutive actions with a time difference less than the defined cutoff belong to a session.
Definition
In this context, fixed durations are unusable as there is no clear time limit for student
work. Therefore we chose to define sessions by using a fixed cutoff value,m, indicating that
students quit using the system or quit working on the task.
Our data includes heterogeneous tasks. Some, such as viewing data in Moodle are quick
while others, such as composing Piazza Posts, take some time. In the absence of clear
sign-off behavior we chose to take a data-driven approach to selecting our cutoff values.
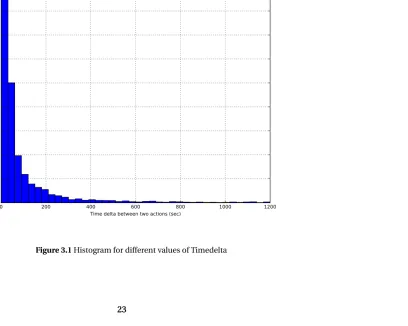
Figure 3.1 shows the histogram of the time differences from the event transactions with
each bucket representing 30 seconds. From the figure it can be seen that extremely small
time differences is the most common and this means that a lot of actions are done only a few
seconds apart. It is also clear that the frequencies of time differences decrease rapidly till
210 seconds and then the rate of decrease becomes negligible. This indicates thatm=210s
is a good choice of the cutoff. But this plot does not take into account the heterogeneous
0 200 400 600 800 1000 1200 Time delta between two actions (sec)
0 5000 10000 15000 20000 25000 30000 35000 40000 45000
Number of events(per 30 sec)
Number of Events with different time delta
0 200 400 600 800 1000 1200 Time delta between two actions (sec)
0 20 40 60 80 100 120 140 160
Number of events(per 30 sec)
Number of Events with different time delta with change between platforms
0 200 400 600 800 1000 1200 Time delta between two actions (sec)
0 5000 10000 15000 20000 25000 30000 35000 40000 45000
Number of events(per 30 sec)
Number of Events with different time delta with no change between platforms
3.1. DEFINITION CHAPTER 3. SESSIONS
It is important to consider factors such as the presence of multiple platforms and
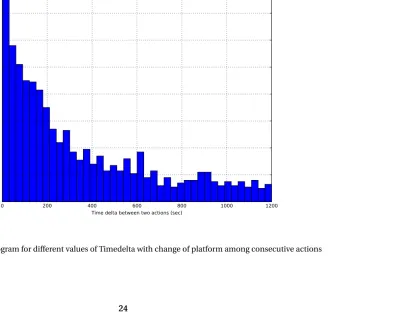
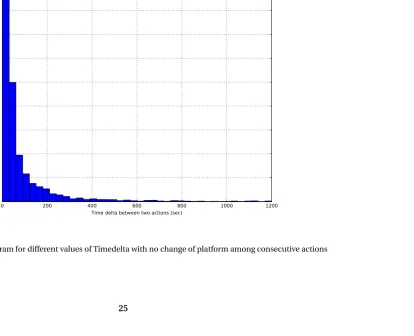
different types of actions when selecting the cutoff valuem. Figures 3.2 and 3.3 show the
frequencies for values under two different scenarios which take in to account the presence
of multiple platforms. Figure 3.3 is the histogram with frequencies of time gap when the
consecutive actions considered belong to the same tool. We can observe from this graph that
the rate of decrease in the count is low after 210 seconds which seems to be an appropriate
cutoff considering that all of the consecutive actions belong to the same source. But this
not always the case, because there are 3 different tools and there will be switching of tools.
Figure 3.2 is the histogram with frequencies of timedelta when the two consecutive actions
belong to different tools, i.e. the student switches from one platform to another between
action 1 and action 2. It can be seen from this graph that the rate of change in frequencies
is low after 600 seconds. It is in correspondence with the intuition that switching from one
tool to another takes additional time.
The data has three sources and each source has actions that take different amounts of
time. It takes longer to author or reply to a question on Piazza than it does to follow a link on
Moodle, for example. Hence the gap between some actionxand making a piazza post will
be relatively higher but it would still belong to the same session as the actionx. Therefore
choosing a single value formdoes not justify the meaning of a session. If a time interval
is considered as a session, then it means that the students do some course related work
during that time with breaks. The cutoff value chosen should be able to identify the breaks
between the time students spend on course work. But the timedelta to define a break may
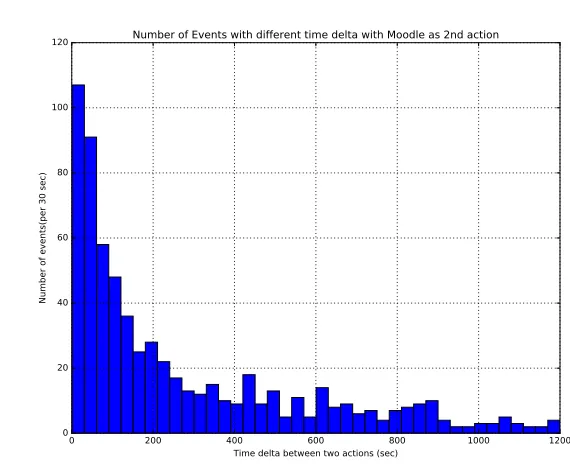
vary due to the nature of data. Figures 3.4, 3.5 and 3.6 show the counts of timedelta where
3.1. DEFINITION CHAPTER 3. SESSIONS
0 200 400 600 800 1000 1200
Time delta between two actions (sec) 0
20 40 60 80 100 120
Number of events(per 30 sec)
Number of Events with different time delta with Moodle as 2nd action
Figure 3.4Histogram for different values of Timedelta with the second action as Moodle action
0 200 400 600 800 1000 1200
Time delta between two actions (sec) 0
5000 10000 15000 20000 25000 30000 35000 40000 45000
Number of events(per 30 sec)
Number of Events with different time delta with WebAssign as 2nd action
3.1. DEFINITION CHAPTER 3. SESSIONS
0 5000 10000 15000 20000
Time delta between two actions (sec) 0
2 4 6 8 10 12
Number of events(per 300 sec)
Number of Events with different time delta with Piazza as 2nd action
Figure 3.6Histogram for different values of Timedelta with the following action as Piazza post
Typically, webassign actions are assignment submissions and tend to occur quickly
after a previous actions. But the average time to switch to moodle or piazza takes longer.
Piazza also requires a separate login from moodle or webassign making the switch longer.
The data from Figures 3.4, 3.5 and 3.6 also corroborate this claim. From Figure 3.4, it can be
observed that the rate of change in frequency becomes negligible after 900 seconds and
similarly from 3.5 the rate of change in count is low after 210 seconds. Figure 3.6 describes
the activity pattern in Piazza which is interesting and different from the previous two plots.
This is due to the fact that piazza events are very infrequent relative to the other two sources
and also the time taken for the actions is highly variable. For example, for the action of
3.2. BROWSER SESSION CHAPTER 3. SESSIONS
clear break in the graph at 40 minutes which intuitively seems to be a fair cutoff for piazza
actions.
It is not possible to define a session by choosing a single cutoff valuemdue to the nature
of the data present. Therefore we defined two types of sessions based on two different cutoff
values.
• Browser Session:Sessions withm =15 minutes indicating that the student likely stayed with the browser open.
• Study Session :Sessions withm=40 minutes indicating that student likely performed activities like solving and studying offline along with the actions on a browser.
Browser Session
A Browser Session is defined a set of continuous actions for which the time difference between
any two actions in the set does not exceed a cutoff of m=15minutes.
Intuitively, this can be understood as that type of session where the students are actively
performing actions on any of the three tools with short time gaps between the actions.
These types of actions are mainly performed on webassign and partially on moodle. The
histograms based on the data are shown in Figures 3.5 and 3.4, and they indicate that
the frequency with which two actions occur within a 15 minute gap is high. For example,
a session could be like viewing an announcement on moodle and then downloading an
assignment. Usually this type of session has short durations but the total number of sessions
3.3. STUDY SESSION CHAPTER 3. SESSIONS
Table 3.1Types of Sessions
Session type Count Mean duration Mean number of Actions
Browser Session 17669 9 min 4 seconds 16
Study Session 14574 16 min 1 second 19
Study Session
A Study Session is defined a set of continuous actions for which the time difference between
any two actions in the set does not exceed a cutoff of m=40minutes.
This type of session is when students perform some actions outside of browser and then
log the action on any of the tools or vice versa.Since we have no record of their off-browser
activity what we are really saying is that this session is designed to encompass cases where
they worked off-line and then returned. For example, solving the problem and then making
a submission. In this case data is recorded only when the submission is made but time
spent before the submission on the problem is taken into account in the longer cutoff value.
This behavior based on intuition is also reinforced by the data. The histogram in Figure
3.6 has a gap at 40 minutes suggesting it to be a good cutoff. Therefore in a study session
the student likely performs activities outside the browser environment for longer times.
3.4. SESSION DATA CHAPTER 3. SESSIONS
Session Data
Table 3.1 presents some basic statistics on the two types of sessions. Though there are two
types of sessions defined, the intersection of the two include 12349 sessions. This means
that 12349 of the browser sessions are also study sessions. The event transactions have
been grouped based on the cutoff values into two data tables called thebrowser_sessions
and thestudy_sessions. These two data tables include the following 6 attributes.
• Nameof the Student performing the actions of the session.
• Starting timeof the session which corresponds to the time stamp of the first event transaction of the session.
• Ending timeof the session which corresponds to the time stamp of the last event transaction of the session.
• Number of Actionsperformed during the session.
• Durationof the session
CHAPTER
4
ANALYSIS
In the prior chapters, we looked at the dataset and preparation of the raw data to test out
hypotheses. The first step towards testing our hypotheses was to define a session and create
sessions from the event transactions, which we discussed last chapter. To test the hypothesis
that the attributes of a session like duration, number of sessions and gap between sessions
are correlated to the performance, we investigate the browser and study sessions for metrics
that affect the grades.
4.1. EXPLORATORY DATA ANALYSIS CHAPTER 4. ANALYSIS
three categories and also identify which of these metrics can be used predict the
perfor-mance in blended course. Towards the end of the chapter we will present the results from
our analysis and discuss its implications. The primary programming language used in the
analysis wasPythonalong the necessary packages likematplotlib, pandas, numpy, and
sklearn.
Exploratory Data Analysis
The initial step before hypothesis testing and performance prediction is to explore the data
deeply and identify the patterns in sessions. The two session types -browser sessionand
study session, have 6 attributes each,which we refer to as the base attributes. We described
them in the last chapter. To perform a complete analysis, we derived 5 additional attributes
from the primary ones.
• Mean Session timeis computed by adding half the duration to the start time of the session.
• Session typeis defined based on the sources of actions in the sessions. Piazza is denoted as P, Moodle as M and Webassign as W. It is possible to define 7 types of
sessions as show in set{P, M, W, PW, PM, MW, PMW}.
• Dateof the session is extracted from the timestamp.
• Dayof the week that the session occurred.
4.1. EXPLORATORY DATA ANALYSIS CHAPTER 4. ANALYSIS
Table 4.1Counts of Homogeneous and Heterogeneous sessions
Session type Homogenous Heterogenous
Browser Session 16892 777
Study Session 13668 906
Table 4.2Counts of Different Session types
Session type P M W PM PW MW PMW
Browser Session 1829 5272 9791 7 24 743 3
Study Session 1593 4516 7559 17 41 843 5
In this section, we will explore the attributes of a session and discuss its properties.
Session Types
Sessions can be of different types depending upon the duration, number of actions in a
session and the type of actions in each session. A homogeneous session consists of actions
from only one tool while heterogeneous sessions consist of actions from multiple tools in a
single session. We have 17669 browser sessions and 14574 study sessions in our dataset.
The table 4.1 gives the number of homogeneous and heterogeneous sessions. The values
from the table show that the 95.5% of the browser sessions are homogeneous and 93.8% of
the study sessions are heterogeneous. These values corroborate our hypothesis that the
homogeneous sessions occur much more frequently than the heterogeneous sessions.
4.1. EXPLORATORY DATA ANALYSIS CHAPTER 4. ANALYSIS
W M P
MW PW PM PMW
Types of Sessions 100 101 102 103 104 Counts(log)
Session type frequency
(a)Browser Sessions
W M P
MW PW PM PMW
Types of Sessions 100 101 102 103 104 Counts(log)
Session type frequency
(b)Study Sessions
Figure 4.1Counts of different sessions
they tend to continue using the same tool for the entire session. Figure 4.1 illustrates the
relative distribution of the session counts from each of the tools and also the counts of the
sessions with actions across multiple tools. The counts for each session type is given in table
4.2. An interesting observation from the values shown in table is that the study sessions
have a higher number of heterogeneous sessions compared to the browser sessions. This
means that when students spend time studying or doing passive actions on-line, they use
multiple on-line tools and active browser sessions are limited to a single on-line tool.
Another metric to look at is the length of the session. The length of the session can
be defined both in terms of duration and the number of actions. First let us consider the
distribution of sessions based on number of actions per session. Sessions with very few
actions, say from 1 to 5 actions per session are very common. Their relative frequency drops
quickly as the session length increases, as shown in Figure 4.2. The number of sessions with
4.1. EXPLORATORY DATA ANALYSIS CHAPTER 4. ANALYSIS
0 10 20 30 40 50 60
Number of actions per sessions 0
500 1000 1500 2000 2500 3000 3500 4000
Counts for each session length(Log)
Number of actions per session vs. Counts
Figure 4.2Number of sessions with different actions per session
from the above graph show the relative distribution of the browser sessions but the same
pattern occurs with the study sessions as well. Though the trends are similar, study sessions
with 200 or more actions are far more common than browser sessions. We attribute this to
the larger cutoff value.
Similar trends are exhibited when we examine the length of session based on the
du-ration. Figure 4.3 presents the graphs for distribution of sessions with different durations.
Even in this attribute, there are a very large number of sessions that are very short timed.
Even though the basic trend that we see is similar in browser and study sessions, the number
of sessions in the range of 5 - 20 minutes is higher for browser sessions and higher for study
4.1. EXPLORATORY DATA ANALYSIS CHAPTER 4. ANALYSIS
0 5 10 15 20 25 30 35 40 45 Session durations(minutes) 0 200 400 600 800 1000 1200 1400 1600 1800 Counts
Histogram of duration of sessions
(a)Browser Sessions
0 5 10 15 20 25 30 35 40 45 Session durations(minutes) 0 200 400 600 800 1000 1200 1400 1600 Counts
Histogram of duration of sessions
(b)Study Sessions
Figure 4.3Number of sessions with different duration counts
Session Timing
In the previous section, we focused on the types of sessions. Now we focus on their timing.
The duration of this course is about 100 days and we examine the on-line activity throughout
the semester to detect spikes. We hypothesized that the student activity will increase as
the deadlines approach and will then spike in the run-up to assignment deadlines or tests.
To test this hypothesis, we plot the number of sessions by all the students on a daily basis
from the beginning to the end of the semester. If the hypothesis 2 is true, then spikes can
be observed prior to the dates with deadlines and tests. The time series plot with the daily
count of sessions is shown in Figure 4.4.
The graph shows that the range of values for differ for browser and study sessions. The
counts of sessions per day is higher for browser sessions when compared to study sessions
4.1. EXPLORATORY DATA ANALYSIS CHAPTER 4. ANALYSIS
certain date ranges. The ranges of dates at which the graph spikes for browser and study
sessions are similar which concludes that both kinds of session occur at similar time frames
but differ in the actual number of sessions.
To confirm the hypothesis, we compared the dates on which the graph spiked with
deadlines. The deadlines and the test dates are available from the webassign data and
they are shown in Figure 4.5. The red dashed lines on the graph on the left denotes the
assignment deadlines and the green dashed lines on th right graph denotes the test dates.
From the graphs, we can decipher that the session activity increases as deadlines
ap-proach and spike in the run-up to the deadlines and tests. The extent to which the graph
spikes depend on the proximity to the deadline. The tallest spike in the graph is closely
followed by both an assignment deadline and the final mid course test. The tests seem to
have a higher impact on the height of the spike compared to an assignment deadline. The
graphs in Figure 4.5 shows the comparison for browser sessions but the same trend is also
Sep 03 2013 Sep 17 2013 Oct 01 2013 Oct 15 2013 Oct 29 2013Nov 12 2013Nov 26 2013Dec 10 2013Dec 24 2013 Dates thorugh the semester
0 200 400 600 800 1000
Number of session per day
Session occurances through the semester
(a)Browser Sessions
Sep 03 2013 Sep 17 2013 Oct 01 2013 Oct 15 2013 Oct 29 2013Nov 12 2013Nov 26 2013Dec 10 2013Dec 24 2013 Dates thorugh the semester
0 100 200 300 400 500 600
Number of session per day
Session occurances through the semester
(b)Study Sessions
4.2. BEHAVIOR ANALYSIS BY PERFORMANCE CHAPTER 4. ANALYSIS
Sep 03 2013 Sep 17 2013 Oct 01 2013 Oct 15 2013 Oct 29 2013Nov 12 2013Nov 26 2013Dec 10 2013Dec 24 2013
Dates thorugh the semester 0 200 400 600 800 1000
Number of session per day
Session occurances through the semester with assignment deadlines
(a)Assignment deadlines
Sep 03 2013 Sep 17 2013 Oct 01 2013 Oct 15 2013 Oct 29 2013Nov 12 2013Nov 26 2013Dec 10 2013Dec 24 2013
Dates thorugh the semester 0 200 400 600 800 1000
Number of session per day
Session occurances through the semester with tests
(b)Test dates
Figure 4.5Occurrence of sessions with assignment deadlines and test dates
It is also interesting to look at the occurrences of the sessions on different days of the
week. Figure 4.6 plots the average number of sessions on each day of the week. A pattern
that can be noticed from the graphs on the left and the right is that the students are most
active during the mid week during Tuesday, Wednesday and Thursday. This behavior can
be attributed to the fact the the majority of the assignment deadlines are on Fridays and
Saturdays for which students do the activities on the previous days.
Behavior Analysis By Performance
We build on the above observations to verify if there are trends in number of sessions, the
duration and the gap between sessions for students with different grades. We categorize
the students in the course into three groups based on their performance.
4.2. BEHAVIOR ANALYSIS BY PERFORMANCE CHAPTER 4. ANALYSIS
Monday Tuesday Wednesday Thursday Friday Saturday Sunday Days of the week
2000 2200 2400 2600 2800 3000 3200
Number of sessions
Days vs session count
(a)Browser Sessions
Monday Tuesday Wednesday Thursday Friday Saturday Sunday Days of the week
1600 1800 2000 2200 2400 2600 2800
Number of sessions
Days vs session count
(b)Study Sessions
Figure 4.6Distribution of sessions over different days of the week.
• Pass - Students with Grades B+, B, C+and C.
• Fail - Students with Grades D and F.
For all the upcoming discussions we present the results only for browser sessions. From
our analysis we observed that the results were similar for the study sessions. The sessions
are grouped into three sub tables based on the performance attribute of the sessions. The
sub-tables present the sessions of students in different performance categories. We plotted
the number of sessions and durations of sessions per day through out the semester. These
visualizations for each performance group are presented in Figures 4.7, 4.8 and 4.9.
By comparing the three sets of figures, we can see that the number of times the graph
reaches zero in case of distinction students are negligible as shown in Figure 4.7. The
number of times the graph reached zero is more frequent for pass students as in Figure
4.8 and is very frequent for Fail students as shown in Figure 4.9. The range of values is the
4.2. BEHAVIOR ANALYSIS BY PERFORMANCE CHAPTER 4. ANALYSIS
Aug 23 2013 Sep 06 2013 Sep 20 2013 Oct 04 2013 Oct 18 2013 Nov 01 2013 Nov 15 2013 Nov 29 2013 Dec 13 2013
Dates thorugh the semester 1.0 1.5 2.0 2.5 3.0 3.5 4.0 4.5
Number of session per day
Session occurances through the semester
(a)Number of Sessios
Aug 23 2013 Sep 06 2013 Sep 20 2013 Oct 04 2013 Oct 18 2013 Nov 01 2013 Nov 15 2013 Nov 29 2013 Dec 13 2013
Dates thorugh the semester 0 500 1000 1500 2000 2500 3000 3500
Duration per day
(b)Duration of Sessions
Figure 4.7The number of sessions and time per day spent by the Distinction students
Sep
2013 Oct Nov Dec
Dates thorugh the semester 1.0 1.5 2.0 2.5 3.0 3.5 4.0 4.5 5.0 5.5
Number of session per day
Session occurances through the semester
(a)Number of Sessions
Sep
2013 Oct Nov Dec
Dates thorugh the semester 0 500 1000 1500 2000 2500 3000 3500 4000
Duration per day
(b)Duration of Sessions
4.2. BEHAVIOR ANALYSIS BY PERFORMANCE CHAPTER 4. ANALYSIS
reveals that the students with a distinction in the course are more consistent and engage in
on-line activity regularly. The lower performing students are more extreme and irregular in
their behavior. They tend to do a lot of activity at certain time periods and become inactive
other times.
Sep 03 2013 Sep 17 2013 Oct 01 2013 Oct 15 2013 Oct 29 2013Nov 12 2013Nov 26 2013Dec 10 2013Dec 24 2013
Dates thorugh the semester 1.0 1.5 2.0 2.5 3.0 3.5 4.0 4.5 5.0
Number of session per day
Session occurances through the semester
(a)Number of Sessions
Sep 03 2013 Sep 17 2013 Oct 01 2013 Oct 15 2013 Oct 29 2013Nov 12 2013Nov 26 2013Dec 10 2013Dec 24 2013
Dates thorugh the semester 0 1000 2000 3000 4000 5000 6000
Duration per day
(b)Duration of Sessions
Figure 4.9The number of sessions and time per day spent by the Fail students
The above trends are reinforced by the plots in Figure 4.10 which shows the average gap
between the session,average duration of the session, and the average number of sessions
for the three groups of students based on performance. The students with very high grades
complete a higher number of small sessions regularly while the students with low grades
complete a smaller number of long sessions at key intervals. This result shows that the
student behavior on these on-line tools is similar for ones in the same grade scale in a
4.3. PERFORMANCE CORRELATION CHAPTER 4. ANALYSIS
Distinction Pass Fail Performance 0.0 0.5 1.0 1.5 2.0 2.5 Days
(a)Average Gap between sessions
Distinction Pass Fail Performance 0 2 4 6 8 10 12 Minutes
(b)Average duration
Distinction Pass Fail Performance 0 10 20 30 40 50 60 70 80 Count
(c)Average Number of Sessions
Figure 4.10The time gap between consecutive sessions, average duration and the average number of sessions for the three student categories.
Performance Correlation
The data tables used in the above chapters describe the sessions and their properties. This
format is not suitable to compare student behavior to the grades however. In order to test
the central hypothesis of this thesis, we need the data in a format where we can correlate
each student’s session behavior to their grades. To achieve this we transformed the data
into a new format in which each row provides information about the properties of the
sessions for each student in the course and their performance. Some of the basic attributes
that define a student’s on-line behavior are listed below and each row in the student data
has these 11 attributes.
• NumSessions- Total number of sessions for the student
• AvgActionsPerSession- The average number of actions performed by the student per session.
4.3. PERFORMANCE CORRELATION CHAPTER 4. ANALYSIS
• AvgTimeBwSessions- The average gap between two consecutive sessions for the student.
• Homogeneous- Number of homogenous sessions.
• Heterogeneous- Number of heterogenous sessions.
• PiazzaQuestions- Number of piazza questions posted by the student.
• PiazzaAnswers- Number of piazza answer replies by the student.
• NumSubmitted- Number of parts of assignment questions answered.
• FirstAttempts- Number of parts answered correctly in first attempt.
• Performance- Performance of the student based on the grade from the course. It can be a values from{Distinction, Pass, Fail}
Predicting the performance
We examine the distribution of values for the attributes stated above to check if any of
them can distinguish the students with different performances . Figure 4.11 shows the
distribution of the attributes like mean duration of session, number of sessions and mean
gap between the sessions grouped by performance. Similarly Figure 4.12 describes the
distribution of number of piazza questions and answers posted by the student.
From these figures, we can observe that the box plots overlap for the three performance
4.3. PERFORMANCE CORRELATION CHAPTER 4. ANALYSIS
1Distinction 2Pass 3Fail Performance 0 1 2 3 4 5 6
7 Boxplot grouped by PerformanceAvgTimeBwSessions
(a)Average Gap between sessions
1Distinction 2Pass 3Fail Performance 0 10 20 30 40
50 Boxplot grouped by PerformanceAvgDurationOfSession
(b)Average duration
1Distinction 2Pass 3Fail Performance 0 50 100 150 200 250
300 Boxplot grouped by PerformanceNumSessions
(c)Average Number of Sessions
Figure 4.11Box plots of gap between consecutive sessions, average duration and the average number of sessions for the three student categories.
1Distinction 2Pass 3Fail
Performance 0 10 20 30 40 50 60
70 Boxplot grouped by PerformancePiazza Questions
(a)Number of Piazza Questions
1Distinction 2Pass 3Fail
Performance 0 20 40 60 80 100 120 140
160 Boxplot grouped by PerformancePiazza Answers
(b)Number of Piazza Answers
4.3. PERFORMANCE CORRELATION CHAPTER 4. ANALYSIS
To improve improve our chances of predicting the students’ performance, we converted
the data by combining the distinction and pass students into a single group. This
pro-duced a binary classed outcome with 213 students passed and 36 students failed. As the
basic attributes still do not provide help in classifying the students based on outcome, we
introduced additional attributes derived from the basic attributes.
• Pratio- The ratio of the sessions with piazza activity to the total number of sessions.
• TotalTime-N u mS e s s i o n s∗Av g D u r a t i o n O f S e s s i o n
• Consistency-Av g T i m e B w S e s s i o n s∗(m a x(N u mS e s s i o n s)−N u mS e s s i o n s)
• TotalActions-N u mS e s s i o n s∗Av g Ac t i o n s P e r S e s s i o n
• NumMultiple-N u mS u b m i t t e d−F i r s t At t e m p t s
We removed 4 attributes: Homogeneous, Heterogeneous, NumSubmitted and
FirstAt-tempts from the table as they have an overlapping range of values for the two outcomes.
The student’s test 1 and test 2 scores were also added to the student data.
We performed a Kruskal-wallis tests to compute the H-statistics and the p-values for the
10 data attributes. H-tests were performed to detect if the median value for two population
groups differ. We ran kruskalwallis on all the 10 attributes for the two population groups
-Pass and Fail. The kruskal-wallis tests were performed based on the implementation from
[SC14].
Our null hypothesis in these tests is that the medians are equal for the two
popula-tions. The values from the statistical analysis are shown in the Tables 4.3, 4.4 and 4.5. The
H-statistic column in the table calculates the exact result of of the kruskal-wallis test
4.3. PERFORMANCE CORRELATION CHAPTER 4. ANALYSIS
Table 4.3Kruskal-Wallis tests for the parameter with data for the entire semester
Parameter H statistic P-value
NumSessions 28.50798851 9.33E-08
Avg Duration of Session 2.086436685 0.148612349 Avg gap between sessions 6.352814231 0.011719524
Piazza Questions 19.83837115 8.43E-06
Piazza Answers 13.84885114 0.000198118
Pratio 26.34024238 2.86E-07
Total time 29.14067342 6.73E-08
Consistency 7.762109569 0.005335361
Total actions 29.44663407 5.75E-08
NumMultiple 19.2352137 1.16E-05
null hypothesis is true. Small p-values indicate a statistically significant difference in the
averages of the two samples.
We also performed the spearman’s correlation test as described in[Dal08]for the
at-tributes and the results of the correlation analysis are shown in Tables 4.6, 4.7 and 4.8. The
correlation coefficient gives the degree of correlation between the attributes and the grade.
p-values indicates probability of an uncorrelated system producing datasets that have
a Spearman correlation at least as extreme as the one computed from these datasets as
defined in[SC14]. Small p-values indicate a statistically significant correlation. The
val-ues from the tables suggest that there exists a good positive correlation for most of the
attributes.
The entire data is split into 70-30 train test datasets ensuring that the data distribution
is maintained in train and test sets. We train a K-nearest neighbor classification model
4.3. PERFORMANCE CORRELATION CHAPTER 4. ANALYSIS
Table 4.4Kruskal-Wallis tests for the parameter with data upto Test-1 of the semester
Parameter H statistic P-value
NumSessions 15.64376031 7.65E-05
Avg Duration of Session 0.568029473 0.451043015 Avg gap between sessions 6.102080098 0.013502286
Piazza Questions 19.83837115 8.43E-06
Piazza Answers 13.84885114 0.000198118
Pratio 11.36215047 7.50E-04
Total time 19.99341673 7.77E-06
Consistency 6.727543308 0.009493526
Total actions 18.36885687 1.82E-05
NumMultiple 19.2352137 1.16E-05
Table 4.5Kruskal-Wallis tests for the parameter with data upto Test-2 of the semester
Parameter H statistic P-value
NumSessions 24.06295441 9.32E-07
Avg Duration of Session 0.315765448 0.574163638 Avg gap between sessions 10.52788376 0.001175868
Piazza Questions 19.83837115 8.43E-06
Piazza Answers 13.84885114 0.000198118
Pratio 14.61531163 1.32E-04
Total time 26.39725916 2.78E-07
Consistency 11.90830007 0.000558844
Total actions 26.22419374 3.04E-07
4.3. PERFORMANCE CORRELATION CHAPTER 4. ANALYSIS
Table 4.6Correlation of the parameter to the outcome for complete semester
Parameters Correlation coefficient pvalue
Avg gap -0.131 0.039
NumSessions 0.301 1.28E-06
pratio 0.423 3.16E-12
Total time 0.252 5.80E-05
Consistency -0.144 0.023
Total actions 0.236 1.69E-04
NumMultiple 0.029 0.646803215
Test 1 0.653 1.06E-31
Test 2 0.730 8.70E-43
Table 4.7Correlation of the parameter to the outcome upto Test -1 of the semester
Parameters Correlation coefficient pvalue
Avg gap -0.107 0.093
NumSessions 0.202 0.001
pratio 0.335 6.24E-08
Total time 0.235 1.84E-04
Consistency -0.127 0.045
Total actions 0.253 5.41E-05
NumMultiple 0.029 0.647
4.3. PERFORMANCE CORRELATION CHAPTER 4. ANALYSIS
Table 4.8Correlation of the parameter to the outcome upto Test-2 of the semester
Parameters Correlation coefficient pvalue
Avg gap -0.203 0.001
NumSessions 0.261 3.15E-05
pratio 0.340 3.64E-08
Total time 0.267 1.96E-05
Consistency -0.211 0.001
Total actions 0.292 2.83E-06
NumMultiple 0.029 6.47E-01
Test 1 0.653 1.06E-31
Test 2 0.730 8.70E-43
neighbors, weighted euclidean distance metric and 10-fold cross validation. The model
predicted the outcome with an accuracy of 88% which is marginally higher than the baseline
performance of 85%.
Along with prediction based on the data from the entire semester, we would also like
to predict the outcomes for students at intermediate checkpoints during the semester.
For this purpose, we create two subsets of data that define the the student’s basic session
attributes and other derived attributes. The subset with the data up to test-1 does not
include the test-1 score. Similarly, the subset with data up to test-2 does not include the
test-2 score. These subsets are also split into 70-30 test train data. The accuracies of the
k-nearest neighbor models for these data is shown in Table 4.9.
We rebuilt the K-Nearest neighbor model with 10-fold cross validation for the three
cases by including only those attributes that have a significant correlation to the outcome.
4.3. PERFORMANCE CORRELATION CHAPTER 4. ANALYSIS
Table 4.9KNN model accuracies for data with all attributes and without test scores
Data Test Accuracy Fail Accuracy Pass Accuracy F score
Full Semester Data 92% 40% 100% 0.957
Data up to test 1 86.67% 30% 95.30% 0.925
Data up to test 2 89.33% 40% 96.90% 0.94
Table 4.10KNN model accuracies for data with correlated attributes and without test scores
Data Test Accuracy Fail Accuracy Pass Accuracy F score
Full Semester Data 91% 30% 100% 0.949
Data up to test 1 88% 30% 96.90% 0.933
Data up to test 2 86.67% 30% 95.30% 0.925
on the data with the significant attributes by including the test 1 and test 2 scores. The
results of this model are shown in Table 4.11.
From the results we can say that model performance has considerably high and we can
predict high accuracy, the outcome of the course for a student based on the session activity
at different times during the semester in a blended course.
Table 4.11KNN model accuracies for data with correlated attributes and test scores
Data Test Accuracy Fail Accuracy Pass Accuracy F score
Full Semester Data 91% 50% 96.90% 0.947
Data up to test 1 89.33% 40% 96.90% 0.94
CHAPTER
5
CONCLUSION
In this thesis, we presented a model to predict the outcome for the students in a blended
course environment. We defined sessions from the actions performed on-line by the
stu-dents in the course. We then performed a preliminary analysis of the data to understand the
types and occurrence of the sessions. Based on the observations from the study so far, we
concluded that he homogeneous sessions are more compared to heterogeneous sessions,
and also that the session activity increases as the deadlines approach and spike exactly
CHAPTER 5. CONCLUSION
Further analysis that we performed revealed that there exists distinct behavioral patterns
among the students with different grades. This result motivated us to further examine the
data to find correlations between the session attributes and the student performance.
Kruskal-Wallis test and spearman’s correlation showed that the attributes likenumber of
sessions,ratio of piazza sessions to the total sessions,total time time on-line,total number
of actions performedandnumber of questions for which student make multiple attempts
in the assignmenthave strong positive correlation with the grades. One attribute,average
gap between the sessions, is negatively correlated to the grades.
We then proposed a K-nearest neighbor classification model to predict the binary
student outcomes - Pass and Fail, using the attributes that showed strong correlation with
grade. We presented three prediction models using the data up to 1, data up to
test-2 and the data for the entire semester to predict the outcomes at different stages of the
semester. We were able to predict the outcomes with accuracy as high as 93%. This supports
our that session attributes are strongly correlated to the performance of the students in a
blended course. This result is promising and provides scope for further research in session