DOI: http://dx.doi.org/10.26483/ijarcs.v10i4.6453
Volume 10, No. 4, July – August 2019
International Journal of Advanced Research in Computer Science
RESEARCH PAPER
Available Online at www.ijarcs.info
ISSN No. 0976-5697
APPLICATION OF MACHINE LEARNING TOOLS FOR PREDICTING
DETERMINANT FACTORS
Assefa Chekole
Department of Information Science University of Gondar,
Ethiopia
Abstract:Machine learning is a technique of optimizing a performance criterion using example data and past experience. Data in machine learning plays a key role, and machine leaning tools are used to discover and learn knowledge from the datasets stored.
The purpose of this research is to build a model that can predict the determinant factors for crop production status using machine learning techniques as a means of visualizing the data. In order to conduct this research supervised machine learning techniques were employed. For the purpose of this research, the datasets were collected from selected region agricultural offices.
The data sets used for the training and testing of the predictive model is 10,000 instances with 41 regular attributes. As a result, for identifying the determinant factors Rapid Miner machine learning tool was used. In order to find the best predictive modeling technique different experiments were conducted using Random Forest, Decision tree, Naïve Bays and ID3 predictive models. To validate the predictive performance of the selected models split and cross validation testing methods was used.
As the findings of this research show that, Random Forest and decision tree models were performed the highest accuracy and precision than others. Therefore, the Random Forest predictive modeling has been used to predict the determinant factors from small and large datasets.
Keywords:Machine Learning, Machine Learning Tools, Determinant Factors, Predictive Modeling.
I. INTRODUCTION
Machine learning is a technique of optimizing a performance criterion using example data and past experience [1]. Data in machine learning plays an indispensable role, and the learning algorithm is used to discover and learn knowledge or properties from the data. The quality or quantity of the dataset will affect the learning and prediction performance [1].Nowadays, in order to discover hidden knowledge from large datasets developers have made a great role to advance new concepts and develop new algorithms consecutively. So as Machine learning is a process of self-improvement using the system itself, and computer programs can automatically improve performance with the accumulation of experience. It is proposed for many specific learning tasks, so that computers can extract features from many data and discover hidden rules [2].
In recent time, there is a large amount of data accumulation in different industries such as telecommunications, financial institutions, and research institutions, so far there are problems and needs of applying machine learning methods to train the data and to enable the machine can predict new values from the existing large datasets. Therefore, this research attempts to explore the problems on the existing agricultural data and applying machine learning techniques as a predictive model.
Machine learning is a field of study on computational methods in the learning process and how to apply computer-based learning systems to solve practical problems. An important research content in machine learning is the research on the method of getting the corresponding concept description from the sample [2]. Therefore, many machine
learning methods can be directly used to solve data mining problems. Data mining is the problem of finding interesting patterns and important rules from large databases. The process of extracting meaningful rules or patterns from data is data mining. Machine learning is a way to improve performance automatically by making use of accumulated data [2].
Machine learning tools are concerned with providing programs with the ability to learn and adapt [3]. Supervised learning is fairly common in classification problems because the goal is often to get the computer to learn a classification system that we have created [4].
These days, crop Productivity prediction is essential to identify the cause for low medium or high productivity factors and used to enhancing the productivity and production of smallholder farmers mainly by reducing the traditional ways of estimating productivity [17]. As a result, it used to strengthen the implementation of effective production strategies for national development program and it has been benefited from the application of machine learning based decision making system for decision makers and experts.In Ethiopia Crop agriculture is continues to be dominated by the country’s numerous smallholder farms that cultivate mainly cereal crops for both own-consumption and sales [5]. The major cereal crops which are mostly harvested by smallholder farmers are Teff, wheat, maize, sorghum, and barley. For the purpose of this research, Teff, Maize and Barely datasets have been selected to conduct the machine learning experimentation as a training examples.
II. METHODOLOGY
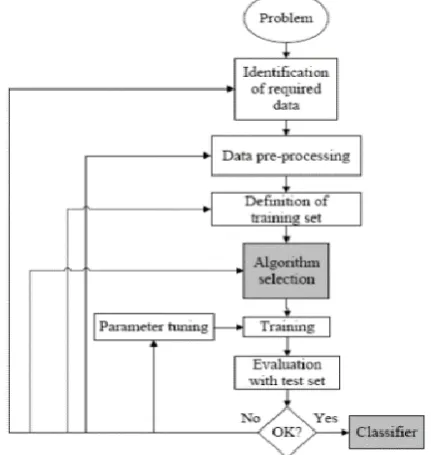
selection of machine learning tools, selection of algorithms that are undertaken for modeling and, selection of machine learning methodology that are adopted in this research. The core foundation of the supervised learning task is the classification problem, hence the learner is required to learn (to approximate the behavior of) a function which maps a vector into one of several classes by looking at several input and output examples of the function. Inductive machine learning is the process of learning a set of rules from instances (examples in a training set), or more generally speaking, creating a classifier that can be used to generalize from new instances [6].
[image:2.595.56.272.241.469.2]In order to develop a predictive machine learning model that can predict the status of crop production using agricultural sample survey datasets obtained from agricultural offices, supervised machine learning technique were adopted [6].
Figure 1: The Processes of Supervised Machine Learning
i. Datasets collection
The datasets used in this research were collected from agricultural offices found in different regions of Ethiopia, the data mainly focused on the selected three cereal crop datasets such as Teff, Maize and Barely. For that purpose, a total of 10,000 instances and 41 regular attributes were used for conducting the machine learning experimentation. Since, MS-Excel, is a standard spread sheet for organizing and preparing the data for experimentation. Therefore, it has been used to organizing and cleaning the data. Finally, it was converted to a standard and supported file format for Rapid Miner machine learning software i.e. converted with Comma Delimited (.CSV) file type.
III. LITERATURE REVIEW
The study conducted on [7], the supervised machine learning algorithms which deals more with classification includes the following: linear classifiers, logistic regression, naïve Bayes classifier, Perceptron, support vector machine; quadratic classifiers, k-means clustering, boosting, decision tree, random forest (RF); neural networks and Bayesian networks.
Naive Bayesian (NB) Networks: These are very simple Bayesian networks which are composed of directed acyclic graphs with only one parent (representing the unobserved
node) and several children (corresponding to observed nodes) with a strong assumption of independence among child nodes in the context of their parent [8].
Bayes classifiers are usually less accurate that other more sophisticated learning algorithms (such as ANNs).However, [9] performed a large-scale comparison of the naive Bayes classifier with state-of-the-art algorithms for decision tree induction, instance-based learning, and rule induction on standard benchmark datasets, and found it to be sometimes superior to the other learning schemes, even on datasets with substantial feature dependencies. Bayes classifier has attribute independence problem which was addressed with Averaged One-Dependence Estimators [10].
Decision Trees: Decision Trees (DT) are trees that classify instances by sorting them based on feature values. Each node in a decision tree represents a feature in an instance to be classified, and each branch represents a value that the node can assume. Instances are classified starting at the root node and sorted based on their feature values [11].Decision tree learning, used in data mining and machine learning, uses a decision tree as a predictive model which maps observations about an item to conclusions about the item's target value. More descriptive names for such tree models are classification trees or regression trees [12].Decision tree classifiers usually employ post pruning techniques that evaluate the performance of decision trees, as they are pruned by using a validation set. Any node can be removed and assigned the most common class of the training instances that are sorted to it [11].
Supervised machine learning techniques are applicable in numerous domains. A number of
Machine Learning (ML) application oriented papers can be found in [13], [14]. Generally, SVMs and neural networks tend to perform much better when dealing with multi dimensions and continuous features. On the other hand, logic-based systems tend to perform better when dealing with discrete/categorical features. For neural network models and SVMs, a large sample size is required in order to achieve its maximum prediction accuracy whereas NB may need a relatively small dataset.
IV. RESULTS AND DISCUSSION
In order to conduct this research, Rapid Miner machine learning tool was used. Different experimentation has been made using Decision Tree, Random Forest, Naive byes and ID3 supervised classification modeling techniques. For the experimentation the number of examples (training sets) selected is 10,000 instances (records), as well as, the total number of columns (regular attributes) are 41 excluding the predicted class. Among the attributes production status is the dependent class which has been determined by the remaining independent classes. As well, the data types of the selected instances are both polynomial and integer.
The data preparation, cleaning and transformation have been made using Turbo prep Rapid Miner automatic data processing techniques. During the process of data cleaning, discretization, data conversion and removal of irrelevant attributes was carried out. As a result, 21 attributes are removed and reduced in to 20 regular attributes. The testing has been conducted with percentage split which can be divided into two partition the first partition is 70% of the datasets which is kept for training data and the second partition is 30% which used to as testing. Out of the total number of 10,000 training datasets 7,000 instances are selected as a labeled data and the remaining 3,000 instances are selected as a testing data (unlabeled) that can be predicted by the model. Furthermore, to identify the best predictive model for the agricultural crop datasets the cross validation testing method was used. To conduct the cross
[image:3.595.360.513.114.261.2]validation model performance testing the researcher used 5,000 number of examples and 11 number of selected attributes including the predicted class. When performing the experimentation, the parameters of the selected models have been considered.
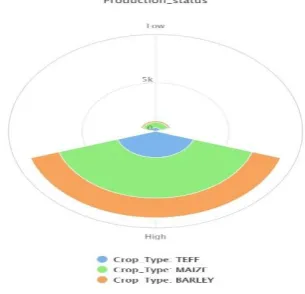
Figure 2: Class Distribution per crop type
[image:3.595.48.545.396.493.2]Figure 2 shows the predicted class identified for this research work which is the production status, as well as the class value ‘low’ indicates the prediction of low production status and the class value ‘high’ also indicates the prediction of high production status. Out of the total 10,000 number of examples 1,058 instances has been predicted as low and 8942 instances predicted as high. In addition, figure 2 shows the predicted values of each crop types how many of the classes categorized as low and high production status. Table I: Measuring Predictive Performance of Models Using Large Datasets
Modeling Techniques
Accuracy (%)
Classification Error (%)
Test mode
Attributes No of instances
Recall (%)
Precision (%) Decision
Tree
88.9 11.09 Split 20 10,000 51.21 59.53
Random Forest
89.57 10.43 Split 20 10,000 50.98 84.27
Naive Bayes 89.30 10.70 Split 20 10,000 51.24 65.98
ID3 83.66 16.34 Split 20 10,000 59.21 58.42
Table I shows the predictive performance of different machine learning modeling techniques, in line with this the experimentation have been done using large datasets with a total number of 10,000 instances and 20 selected attributes. In order to identify the best predictive performance of the models the same performance parameters was used. As a result, based on the model performance measures the prediction performance of each models are discussed as follows: Random Forest performs the highest accuracy which is 89.5% with the highest precision of 84.27% and Naïve Bayes performs 89.30% accuracy with 65.98% precision. And also, Decision Tree performs an accuracy of 88.9% with 59.53% precision and ID3 model performs an accuracy of 83.66% with 58.42 % precision. Here, the overall experimentation were conducted using percentage split testing mode.
Table II: Confusion Matrix of Decision Tree Model
True Low True
High
Precision (%)
Predict. Low 25 60 29.41
Predict. High 716 6199 89.65
Recall (%) 3.37 99.04
Table II shows the confusion matrix of the decision tree model, as shown in the table this model predicts 25 instances as low with 29.41% class precision and 3.37% class recall. On the other hand, out of the total number of training examples 6199 were predicted as high with 89.65% precision and 99.04% recall.
Table III: Confusion Matrix of Random Forest Model
True Low True
High
Precision (%)
Predict. Low 15 4 78.95
Predict. High 726 6255 89.60
Recall (%) 2.02 99.94
Table IV: Confusion Matrix of Naive Bayes Model
True Low
True High
Precision (%)
Predict. Low 22 30 42.31
Predict. High 719 6229 89.65
Recall (%) 2.97 99.52
Table IV shows the confusion matrix of the Naive Byes model, as shown in the table this model predicts 22 instances as low with 42.31% class precision and 2.97% class recall. On the other hand, out of the total number of training examples 6229 instances were predicted as high with 89.65% precision and 99.52% recall.
Table V: Confusion Matrix of ID3 Model
True Low True High
Precision (%)
Predict. Low 209 612 25.46
Predict. High 532 5647 91.39
Recall (%) 28.21 90.22
Table V shows the confusion matrix of the ID3 model, as shown in the table this model predicts 209 instances as low with 25.46% class precision and 28.21% class recall. On the other hand, out of the total number of training examples 5647 instances were predicted as high with 91.39% class precision and 90.22% recall.
Table VI: Measuring Predictive Performance of Models Using Small Datasets
Modeling Techniques
Accuracy (%)
Classification error
test mode attributes no of
instances
Recall (%)
Precision (%) Decision
Tree
94.24 5.76 Cross
validation
11 5,000 54.13 70.65
Random Forest 94.30 5.70 Cross
validation
11 5,000 53.09 74.96
Naive Bayes 94.20 5.80 Cross
validation
11 5,000 50.0 47.10
ID3 93.94 6.06 Cross
validation
11 5,000 54.17 67.19
Table VI shows the predictive performance of each of the machine learning modeling techniques using small data sets which is a total of 5,000 examples with 11 selected attributes. With this experimentation the models predictive performance parameters were considered with similar setup. Accordingly, the experimentation result shows, with small datasets Random Forest model performs an accuracy of 94.30% with highest precision 74.96%, decision tree performs an accuracy of 94.24% with 70.65% precision. As well as Naïve Bayes and ID3 models have been performed 94.20% and 93.94% accuracy respectively. In order to compare the performance of this classification models with small datasets a Cross validation testing mode was used.
i. Model Evaluation Methods
The main purpose of this research was to apply machine learning tools on agricultural datasets for predicting the main determinant factors for crop production status that leads to low or high level productivity. Therefore, among the supervised machine learning classification models, decision tree, random forest, Naïve Byes and ID3 models has been selected for conducting the experimentation. As a result, the performance criteria used to evaluate the prediction performance of the models are accuracy, classification error, kappa, weighted mean recall and weighted mean precision. Additionally, to validate the models, dataset split and cross validation performance testing techniques were employed using similar parameters and datasets. Hence, in order to select the best predictive model the accuracy and precision of each models are discussed in figure 3 and 4 below using large and small datasets respectively.
Figure 3: Model Evaluation Using Large Datasets
Figure 3 shows the Accuracy and precision rate of the selected machine learning models. In order to evaluate the prediction performance of each model two kinds of experimentation has been conducted, the first experimentation is made using large datasets which is 10,000 examples with 20 attributes. As the experimentation result shows, Random Forest model performs the best accuracy with highest precision value 89.57% and 84.27% respectively. Therefore, this model has good predictive performance for large datasets than others.
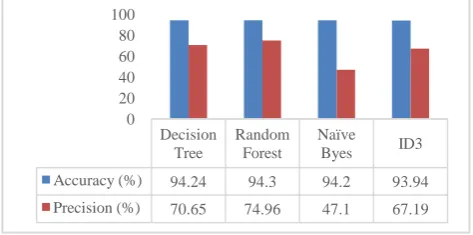
Figure 4: Model Evaluation Using Small Datasets Decision
Tree
Random Forest
Naïve
Byes ID3
Accuracy (%) 88.9 89.57 89.3 83.66
Precision (%) 59.53 84.27 65.98 58.42
0 20 40 60 80 100
Decision Tree
Random Forest
Naïve
Byes ID3
Accuracy (%) 94.24 94.3 94.2 93.94
Precision (%) 70.65 74.96 47.1 67.19
[image:4.595.306.566.76.133.2] [image:4.595.30.284.76.140.2] [image:4.595.216.552.238.499.2] [image:4.595.316.553.640.757.2]Figure 4 shows the accuracy and precision rate of the selected machine learning models. In order to evaluate the prediction performance of each model two kinds of experimentation has been conducted, the second experimentation is made using small datasets which is5,000 examples with 11 selected attributes. As theexperimentation result shows, Random Forest model performs the best accuracy with highest precision value 94.3% and 74.96% respectively followed by decision tree model. Therefore, Random Forest model has good predictive performance for small and large datasets than other predictive models. On the other hand, ID3 model has performed good accuracy and precision with small datasets than large datasets (see fig3 and 4).
V. CONCLUSION AND RECOMMENDATION
i. Conclusion
Machine learning is a field of study on computational methods in the learning process and how to apply computer-based learning systems to solve practical problems. As well, it is a way to improve model performances automatically by making use of accumulated datasets from computing machines.
Data in machine learning plays a key role, and machine learning algorithms are used to discover and learn knowledge or properties from the data.
Random Forest, and decision tree machine learning models has performed high accuracy and precision regardless of the number of attributes and training examples. As the finding of this research shows that accuracy, weighted mean recall, weighted mean precision and error rates are the factors to build a model. Therefore, Machine Learning model requires accuracy, precision and minimum error to have supervised predictive machine learning.
ii. Recommendation
In This research work an attempt has been made to find out the application of machine learning tools for identifying the determinant factors on the agricultural domain. In line with, different experimentation were conducted with four selected supervised machine learning techniques. Hence, the selected modeling techniques were tested using large and small datasets accordingly. This research recommends that the datasets used for this experimentation should be conducted by other supervised machine learning modeling techniques and also, the unsupervised machine learning modeling techniques should be applied on the agricultural datasets. This will create the opportunity to get the right predictive machine learning model for large datasets found on the domain. Furthermore, this research used Rapid Miner machine learning tool, further research should be done using more efficient ML tools.
VI. ACKNOWLEDGEMENT
When doing this research my colleagues have encouraged me and contributed their supportive ideas specially, Mr. Alehegn Adane and Getachew Gedamu. So, would like to thanks for your encouragement. Additionally, would like to express sincere gratitude to University of Gondar for the excellent facilities to complete this research.
VII. REFERENCES
[1] E. Alpaydin, Introduction to machine learning, 2nd ed., The MIT Press, 2010.
[2] Shangran Li 2019 J. Phys.: Conf. Ser. 1168 032132
[3] Shai Shalev-Shwartz and Shai Ben-David (2014).Understanding Machine Learning from Theory to Algorithms.
[4] Taiwo, O. A. (2010). Types of Machine Learning Algorithms, New Advances in Machine Learning, Yagang Zhang (Ed.), ISBN: 978-953-307-034-6, InTech, University of Portsmouth United Kingdom. Pp 3 – 31.
[5] A. Seyoum, P. Dorosh and S. Asrat, "Crop Production in Ethiopia: Regional Patterns and Trends", Ethiopian development research institute, 2011. [Online]. Available: http://reliefweb.int/sites/reliefweb.int/files/resources/essprn11 pdf. [Accessed: 09- Jan 2016].
[6 Supervised Machine Learning Algorithms: Classification and Comparisonhttps://www.researchgate.net/publication/318338 750
[7] Cheng, J., Greiner, R., Kelly, J., Bell, D.& Liu, W. (2002). Learning Bayesian networks from data: An information theory based approach. Artificial Intelligence Volume 137, pp. 43 – 90.
[8] Good, I.J. (1951). Probability and the Weighing of Evidence, Philosophy Volume 26, Issue 97, 1951. Published by Charles Griffin and Company, London 1950.Copyright © The Royal Institute of Philosophy 1951, pp. 163-164.doi: https://doi.org/10.1017/S0031819100026863.
[9] Domingos, P. &Pazzani, M. (1997). On the optimality of the simple Bayesian classifier under zero-one loss. Machine Learning Volume 29, pp. 103–130 Copyright © 1997 Kluwer Academic Publishers. Manufactured in The Netherlands. [10] Hormozi, H., Hormozi, E. &Nohooji, H. R. (2012). The
Classification of the Applicable Machine Learning Methods in Robot Manipulators. International Journal of Machine Learning and Computing (IJMLC), Vol. 2, No. 5, 2012 doi: 10.7763/IJMLC.2012.V2.189pp. 560 – 563.
[11] Kotsiantis, S. B. (2007). Supervised Machine Learning: A Review of Classification Techniques. Informatica 31 (2007). Pp. 249 – 268.
[12] T. Hastie, R. Tibshirani, J. H. Friedman (2001) ― The elements of statistical learning,‖ Data mining, inference, and prediction, 2001, New York: Springer Verlag.
[13] Setiono R. and Loew, W. K. (2000), FERNN: An algorithm for fast extraction of rules from neural networks, Applied Intelligence.
[14] Witten, I. H. & Frank, E. (2005). Data Mining: Practical machine learning tools and techniques (2nd ed.), ISBN: 0-12-088407-0, Morgan Kaufmann Publishers, San Francisco, CA, U.S.A. © 2005 Elsevier Inc.
[15] Bishop, C. M. (1995). Neural Networks for Pattern Recognition. Clarendon Press, Oxford, England. 1995. Oxford University Press, Inc. New York, NY, USA ©1995.
[16] Neocleous C. &Schizas C. (2002). Artificial Neural Network Learning: A Comparative Review. In: Vlahavas I.P., Spyropoulos C.D. (eds)Methods and Applications of Artificial Intelligence. Hellenic Conference on Artificial IntelligenceSETN 2002. Lecture Notes in Computer Science, Volume 2308. Springer, Berlin, Heidelberg, doi: 10.1007/3-540-46014-4_27 pp. 300-313.