c
Owned by the authors, published by EDP Sciences, 2016
Top Physics at CMS/LHC
Georgios Daskalakis1,a, On behalf of the CMS Collaboration
1Institute of Nuclear and Particle Physics (INPP), NCSR Demokritos, Aghia Paraskevi, Greece
Abstract. Recent results on the inclusive and differential production cross sections of
top-quark pair and single top-quark processes are presented, obtained using data from proton-proton collisions collected with the CMS detector at the LHC. The large centre-of-mass energies available at LHC allow for the copious production of top-quark pairs in association with other final state particles at high transverse momentum. Measurements of such processes as well as of the top-quark mass and other properties will be discussed. The results are compared with the most up-to-date standard model theory predictions.
1 Introduction
Today, more than 20 years after the discovery of the top quark, particle physicists still investigate its properties by performing precision measurements. The top quark is the heaviest known elementary
particle with a very short lifetime (τt=1/Γt∼3.3×10−25s) [1]. It decays semi-weakly into a real W
boson and a b quark before hadronization (τhadronization∼10−24s) can occur. Due to its short lifetime,
there is no sufficient time to depolarize its spin (τspin decorrelation∼10−21s) [2], so its spin information
is transferred on to its decay products. Therefore, it is possible to measure observables that depend on the top quark spin, providing a unique environment for tests of the Standard Model (SM) and for searches for physics beyond the Standard Model (BSM). In addition, it is the only quark whose Yukawa coupling to the Higgs boson is of the order of unity so it is often speculated that it might play a special role in the mechanism of electroweak symmetry breaking. Its phenomenology provides a unique laboratory where our understanding of the strong interactions can be tested mainly through the top quark pair production. At the same time, weak interactions can be tested through the top quark decay and single top quark production. Top quarks are a major source of background for almost all searches for BSM physics at the LHC. Precise understanding of the top quark cross sections and kinematics is crucial before claiming new physics.
The final states for the leading pair-production process can be divided into three classes depend-ing on the decay mode of the W bosons. The t¯t events in which both, one or none W bosons decay
hadronically are referred to as the all-jets, lepton+jets (l+jets) or dilepton channels, respectively. Their
relative contributions, including hadronic corrections, are 45.7%, 43.8% and 10.5%. Most of the
anal-yses focus on final states with muons and electrons since theτleptons are more difficult to reconstruct.
In addition to the quarks resulting from the top-quark decays, extra radiation from quarks and gluons in the event can lead to extra jets in the final state.
2 Inclusive Top-quark pair and Single-top production cross sections
In pp collisions, top quarks are produced dominantly in pairs through the processes gg→t¯t and q¯q→
t¯t, at leading order (LO) in quantum chromodynamics (QCD). At √s=13 TeV, approximately 85.7%
of the production cross section is from gluon-gluon fusion, with the remainder from q¯q annihilation.
The most precise CMS measurements of the t¯t production cross section at √s=13 TeV comes
from the dilepton channel [3]. The measurement used data that correspond to an integrated
lu-minosity of 2.2 fb−1 analyzing events with one electron and one muon (eµ channel) and at
least two jets, one of which is required to be identified as a b-jet. The measured cross
sec-tion is σt¯t = 793±8(stat)±38(syst)±21(lumi) pb, corresponding to a total relative uncertainty of
5.6%. The corresponding SM prediction for the t¯t production cross section is σNNLO+NNLL
t¯t =
832±29(scale)±35(PDF+αs) pb, as calculated with the TOP++ program [4] at
leading-order (NNLO) in perturbative QCD, including soft-gluon resummation at
next-to-next-to-leading-log (NNLL) order [5], assuming mt=172.5 GeV. The first uncertainty is an estimate of the
effect of missing higher-order corrections and reflects uncertainties in the factorization and
renor-malization scales, while the second one is associated with possible choices of PDFs and the strong
coupling constant (αs). The measured cross section is therefore in agreement with the expectations
from the SM. Further analyses in the l+jets channel and the all-jets channel, yield consistent results.
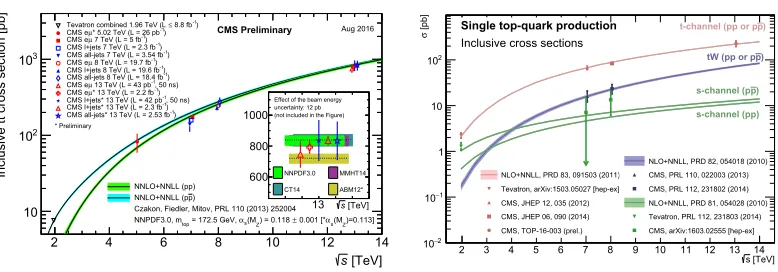
In Fig. 1 (left) the summary of the cross section measurements of top pair production in CMS is presented in comparison with the theory calculation at NNLO with NNLL soft gluon resummation. The Tevatron measurements are also shown.
The associate production of t¯t along with an electroweak gauge boson (W or Z) have been also studied. The cross sections of these processes are typically much smaller than the t¯t, yet can provide key information on the properties of the top quark. In these final states, according to the SM, the W boson is expected to be produced via initial state radiation, while the Z-boson can also be radiated from a final-state top-quark and hence provides sensitivity to the top-quark neutral current weak gauge
coupling. Bothσt¯tWandσt¯tZwould be altered in a variety of new physics models that can be
param-eterized by dimension-six operators added to the SM Lagrangian. CMS measured the t¯tW and t¯tZ
production cross sections using pp collision data at √s=8 TeV corresponding to an integrated
lumi-nosity of 19.5 fb−1[6]. Signatures from different decay modes of the top quark pair resulting in final
states with two, three, and four leptons have been analyzed. The measured cross section in same-sign
dilepton and three-lepton final states is 382+117
−102fb, with an observed (expected) significance of 4.8
(3.5) standard deviations from the background-only hypothesis. Combining opposite-sign dilepton,
three-lepton, and four-lepton channels, the t¯tZ cross section is measured to be 242+65
−55 fb, an
obser-vation with a significance of 6.4 standard deviations from the background-only hypothesis, and in agreement with the SM expectation. The measured cross sections are used to constrain the vector
and axial couplings of the Z boson to the top quark and to set bounds on the Wilson coefficients of
five dimension-six operators that would affect the t¯tW and t¯tZ cross sections by parameterizing new
physics. The measurements are compatible with the SM predictions. Recently, the cross section of t¯t
production in association with a Z boson was measured using pp collisions at √s=13 TeV [7]. The
data sample used corresponds to an integrated luminosity of 2.7 fb−1. The measurement is performed
in three- and four-lepton final states where the jet and b-jet multiplicities were exploited to enhance
the signal over background ratio. The t¯tZ production cross section was measured to be 1065+352
−313( stat. )+168
−142( sys. ) fb with a significance of 3.6 standard deviations from the background-only hypothesis.
The electroweak single top-quark production mechanisms, namely from q¯q→t¯b, qb→qt,
me-diated by virtual s-channel and t-channel W bosons, and tW-associated production, through bg→
tW−, lead to smaller cross sections with respect to t¯t production. The t-channel, while suppressed by
2 Inclusive Top-quark pair and Single-top production cross sections
In pp collisions, top quarks are produced dominantly in pairs through the processes gg→t¯t and q¯q→
t¯t, at leading order (LO) in quantum chromodynamics (QCD). At √s=13 TeV, approximately 85.7%
of the production cross section is from gluon-gluon fusion, with the remainder from q¯q annihilation.
The most precise CMS measurements of the t¯t production cross section at √s=13 TeV comes
from the dilepton channel [3]. The measurement used data that correspond to an integrated
lu-minosity of 2.2 fb−1 analyzing events with one electron and one muon (eµ channel) and at
least two jets, one of which is required to be identified as a b-jet. The measured cross
sec-tion is σt¯t = 793±8(stat)±38(syst)±21(lumi) pb, corresponding to a total relative uncertainty of
5.6%. The corresponding SM prediction for the t¯t production cross section is σNNLO+NNLL
t¯t =
832±29(scale)±35(PDF+αs) pb, as calculated with the TOP++ program [4] at
leading-order (NNLO) in perturbative QCD, including soft-gluon resummation at
next-to-next-to-leading-log (NNLL) order [5], assuming mt=172.5 GeV. The first uncertainty is an estimate of the
effect of missing higher-order corrections and reflects uncertainties in the factorization and
renor-malization scales, while the second one is associated with possible choices of PDFs and the strong
coupling constant (αs). The measured cross section is therefore in agreement with the expectations
from the SM. Further analyses in the l+jets channel and the all-jets channel, yield consistent results.
In Fig. 1 (left) the summary of the cross section measurements of top pair production in CMS is presented in comparison with the theory calculation at NNLO with NNLL soft gluon resummation. The Tevatron measurements are also shown.
The associate production of t¯t along with an electroweak gauge boson (W or Z) have been also studied. The cross sections of these processes are typically much smaller than the t¯t, yet can provide key information on the properties of the top quark. In these final states, according to the SM, the W boson is expected to be produced via initial state radiation, while the Z-boson can also be radiated from a final-state top-quark and hence provides sensitivity to the top-quark neutral current weak gauge
coupling. Bothσt¯tWandσt¯tZwould be altered in a variety of new physics models that can be
param-eterized by dimension-six operators added to the SM Lagrangian. CMS measured the t¯tW and t¯tZ
production cross sections using pp collision data at √s=8 TeV corresponding to an integrated
lumi-nosity of 19.5 fb−1[6]. Signatures from different decay modes of the top quark pair resulting in final
states with two, three, and four leptons have been analyzed. The measured cross section in same-sign
dilepton and three-lepton final states is 382+117
−102fb, with an observed (expected) significance of 4.8
(3.5) standard deviations from the background-only hypothesis. Combining opposite-sign dilepton,
three-lepton, and four-lepton channels, the t¯tZ cross section is measured to be 242+65
−55 fb, an
obser-vation with a significance of 6.4 standard deviations from the background-only hypothesis, and in agreement with the SM expectation. The measured cross sections are used to constrain the vector
and axial couplings of the Z boson to the top quark and to set bounds on the Wilson coefficients of
five dimension-six operators that would affect the t¯tW and t¯tZ cross sections by parameterizing new
physics. The measurements are compatible with the SM predictions. Recently, the cross section of t¯t
production in association with a Z boson was measured using pp collisions at √s=13 TeV [7]. The
data sample used corresponds to an integrated luminosity of 2.7 fb−1. The measurement is performed
in three- and four-lepton final states where the jet and b-jet multiplicities were exploited to enhance
the signal over background ratio. The t¯tZ production cross section was measured to be 1065+352
−313( stat.
)+168
−142( sys. ) fb with a significance of 3.6 standard deviations from the background-only hypothesis.
The electroweak single top-quark production mechanisms, namely from q¯q→t¯b, qb→qt,
me-diated by virtual s-channel and t-channel W bosons, and tW-associated production, through bg→
tW−, lead to smaller cross sections with respect to t¯t production. The t-channel, while suppressed by
the weak coupling with respect to the strong pair production, results in a sizable cross section at the
[TeV]
s
2 4 6 8 10 12 14
cross section [pb]t
Inclusive t
10
2
10
3
10
CMS Preliminary Aug 2016
* Preliminary
) -1 8.8 fb
≤
Tevatron combined 1.96 TeV (L ) -1 * 5.02 TeV (L = 26 pb
µ
CMS e ) -1 7 TeV (L = 5 fb
µ
CMS e
) -1 CMS l+jets 7 TeV (L = 2.3 fb
) -1 CMS all-jets 7 TeV (L = 3.54 fb ) -1 8 TeV (L = 19.7 fb
µ
CMS e
) -1 CMS l+jets 8 TeV (L = 19.6 fb ) -1 CMS all-jets 8 TeV (L = 18.4 fb , 50 ns) -1 13 TeV (L = 43 pb
µ
CMS e
) -1 * 13 TeV (L = 2.2 fb
µ
CMS e
, 50 ns) -1 CMS l+jets* 13 TeV (L = 42 pb
) -1 CMS l+jets* 13 TeV (L = 2.3 fb
) -1 CMS all-jets* 13 TeV (L = 2.53 fb
NNLO+NNLL (pp) ) p NNLO+NNLL (p
Czakon, Fiedler, Mitov, PRL 110 (2013) 252004
)=0.113] Z (M s
α
0.001 [*
±
) = 0.118 Z (M s
α
= 172.5 GeV, top NNPDF3.0, m
[TeV]
s
13 600 800 1000
NNPDF3.0 MMHT14
CT14 ABM12* Effect of the beam energy uncertainty: 12 pb (not included in the Figure)
[TeV] s
2 3 4 5 6 7 8 9 10 11 12 13 14
[pb]
σ
2
−
10
1
−
10 1 10
2
10
NLO+NNLL, PRD 83, 091503 (2011) Tevatron, arXiv:1503.05027 [hep-ex] CMS, JHEP 12, 035 (2012) CMS, JHEP 06, 090 (2014) CMS, TOP-16-003 (prel.)
NLO+NNLL, PRD 82, 054018 (2010) CMS, PRL 110, 022003 (2013) CMS, PRL 112, 231802 (2014) NLO+NNLL, PRD 81, 054028 (2010) Tevatron, PRL 112, 231803 (2014) CMS, arXiv:1603.02555 [hep-ex] Single top-quark production
Inclusive cross sections
) p t-channel (pp or p
) p tW (pp or p
) p s-channel (p
s-channel (pp)
Figure 1. Left: Summary of the top quark pair cross section measurements from CMS, versus the
centre-of-mass energy, in comparison with the theory calculation at NNLO+NNLL accuracy. Right: Summary of the
single top cross section measurements from CMS, versus the centre-of-mass energy, in comparison with the
theory calculation at NLO+NNLL accuracy. The Tevatron measurements are also shown.
LHC energies. The t- and s-channel cross sections of top and anti-top are not identical, due to the charge-asymmetric initial state. Measurements of the s- and t-channel production cross sections as
well as the tW mechanism though the t-channel allow an extraction of the CKM matrix element Vtb.
A recent measurement of the t-channel single top quark production cross section was performed
by CMS at √s=13 TeV [8], analyzing data that correspond to an integrated luminosity of 2.3 fb−1.
The muon+jets signature was explored and several kinematic variables were combined into one
mul-tivariate discriminator optimized to separate signal from background events. A fit to the distribution of the discriminating variable yields cross sections of :
σt−ch.,t=141.5±6.7(stat.)±9.4(exp.)+−1919..36(theo.)±3.8(lumi.) pb and
σt−ch.,¯t= 81.0±6.2(stat.)±8.1(exp.)+−1010..99(theo.)±2.2(lumi.) pb
for the production of single top quarks and single top anti-quarks, respectively. The cross section
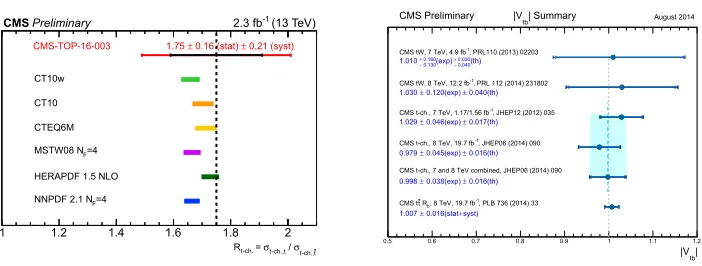
ratio between top quark and anti-quark production is measured to be: Rt−ch.=1.75±0.16(stat.)±0.21
(syst.). A comparison between the measured ratio and the prediction of different PDF sets is shown
on the left plot of Fig. 2. In case of MSTW2008NLO [9] and of NNPDF [10] the fixed four-flavour scheme (4FS) PDFs are used together with the POWHEG 4FS calculation. The POWHEG calculation in the five-flavour scheme (5FS) is used for all other PDFs, as they are variable flavor scheme PDFs.
Assuming |Vtb| much greater than |Vtd|, |Vts| the cross sections for single top
pro-duction are proportional to |Vtb|2. From the measured inclusive cross section, σt−ch. =
227.8±9.1(stat.)±14.0(exp.)+28.7
−27.7(theo.)±6.2(lumi.) pb and its predicted value, the CKM matrix
el-ement|Vtb|is calculated to be|Vtb| =1.02±0.07(exp.)±0.02(theo.). All results are in agreement with
the SM predictions.
CMS performed a search for single top quark production in the s-channel in decay modes of the top quark containing a muon or an electron in the final state [11]. The signal is extracted through a maximum-likelihood fit to the distribution of a multivariate discriminant defined to separate the expected signal contribution from background processes. The analysis uses data corresponding to
integrated luminosities of 5.1 fb−1at 7 TeV and 19.7 fb−1at 8 TeV, respectively. The measured cross
sections of 7.1±8.1 pb at 7 TeV and 13.4±7.3 pb at 8 TeV result in a best fit value of 2.0±0.9 for
t -ch., t
σ
/
-ch.,t t
σ
=
-ch. t
R
1 1.2 1.4 1.6 1.8 2
CT10w
CT10
CTEQ6M
=4
F
MSTW08 N
HERAPDF 1.5 NLO
=4
F
NNPDF 2.1 N Preliminary
CMS 2.3 fb-1 (13 TeV)
CMS-TOP-16-003 1.75± 0.16 (stat) ± 0.21 (syst)
|
tb
|V
0.5 0.6 0.7 0.8 0.9 1 1.1 1.2
| Summary
tb
CMS Preliminary |V August 2014
, PRL110 (2013) 02203 -1
CMS tW, 7 TeV, 4.9 fb
(th)
0.040
− 0.030 +
(exp)
0.130
− 0.160 +
1.010
, PRL 112 (2014) 231802 -1
CMS tW, 8 TeV, 12.2 fb
0.040(th)
±
0.120(exp)
±
1.030
, JHEP12 (2012) 035 -1 CMS t-ch., 7 TeV, 1.17/1.56 fb
0.017(th)
±
0.046(exp)
±
1.029
, JHEP06 (2014) 090 -1 CMS t-ch., 8 TeV, 19.7 fb
0.016(th)
±
0.045(exp)
±
0.979
CMS t-ch., 7 and 8 TeV combined, JHEP06 (2014) 090
0.016(th)
±
0.038(exp)
±
0.998
, PLB 736 (2014) 33 -1 , 8 TeV, 19.7 fb b R t CMS t
syst)
+
0.016(stat
±
1.007
Figure 2. Left: Comparison of the measured Rt−ch.=σt−ch.,t/σt−ch.,¯twith the prediction obtained using different
PDF sets. The nominal value for the top quark mass is 173.0 GeV. Error bars for the different PDF sets include
the statistical uncertainty, the uncertainty on the factorization and renormalization scales, and the uncertainty on the top quark mass.Right: Summary of|Vtb|measurements in CMS.
deviations, and the upper limit on the rate relative to the SM expectation is 4.7 at 95% confidence level.
The tW process is of interest because it probes the tWb vertex in a different kinematic region than
s- and t-channel production. The definition of tW production in perturbative QCD at NLO mixes with top-quark pair production so special treatment is necessary in order to disentangle the two
pro-cesses [12, 13]. At measurement level the selection cuts are defined such that the interference effects
are small. The associated production of a single top quark and a W boson was measured in CMS
by using a data set of 12.2 fb−1of pp collisions at √s=8 TeV [14]. Events with two leptons and a
jet originating from a b quark are selected. A multivariate analysis based on kinematic and topolog-ical properties is used to separate the signal from the dominant t¯t background. An excess consistent with the signal hypothesis is observed, with a significance which corresponds to 6.1 standard
devia-tions above a background-only hypothesis. The measured production cross section is 23.4±5.4 pb, in
agreement with the SM prediction.
In Fig. 1 (right) a summary of single top cross-section measurements at CMS are presented as
a function of the center-of-mass energy in comparison with the theory calculation at NLO+NNLL
accuracy. The Tevatron measurements are also shown. All cross-section measurements are very well
described by the theory calculations within their uncertainty. In Fig. 2 (right) a summary of Vtb
determinations by CMS is presented.
3 Differential cross sections
Thanks to the large available luminosity, CMS performed differential cross-section measurements in
t¯t production. Such measurements are crucial, as they allow even more stringent tests of perturba-tive QCD as description of the production mechanism and enhance the sensitivity to possible new
physics contributions, especially now that NNLO predictions for the main differential observables in
t¯t production have become available [15]. Furthermore, such measurements reduce the uncertainty in the description of t¯t final state as background in Higgs physics, searches for rare processes, or BSM physics.
Differential cross-sections are typically measured by applying a kinematic reconstruction on the
t -ch., t σ / -ch.,t t σ = -ch. t R
1 1.2 1.4 1.6 1.8 2
CT10w CT10 CTEQ6M =4 F MSTW08 N
HERAPDF 1.5 NLO
=4
F
NNPDF 2.1 N Preliminary
CMS 2.3 fb-1 (13 TeV)
CMS-TOP-16-003 1.75± 0.16 (stat) ± 0.21 (syst)
|
tb
|V
0.5 0.6 0.7 0.8 0.9 1 1.1 1.2
| Summary
tb
CMS Preliminary |V August 2014
, PRL110 (2013) 02203 -1
CMS tW, 7 TeV, 4.9 fb
(th)
0.040
− 0.030 +
(exp)
0.130
− 0.160 +
1.010
, PRL 112 (2014) 231802 -1
CMS tW, 8 TeV, 12.2 fb
0.040(th)
±
0.120(exp)
±
1.030
, JHEP12 (2012) 035 -1 CMS t-ch., 7 TeV, 1.17/1.56 fb
0.017(th)
±
0.046(exp)
±
1.029
, JHEP06 (2014) 090 -1 CMS t-ch., 8 TeV, 19.7 fb
0.016(th)
±
0.045(exp)
±
0.979
CMS t-ch., 7 and 8 TeV combined, JHEP06 (2014) 090
0.016(th)
±
0.038(exp)
±
0.998
, PLB 736 (2014) 33 -1 , 8 TeV, 19.7 fb b R t CMS t syst) + 0.016(stat ± 1.007
Figure 2. Left: Comparison of the measured Rt−ch.=σt−ch.,t/σt−ch.,¯twith the prediction obtained using different
PDF sets. The nominal value for the top quark mass is 173.0 GeV. Error bars for the different PDF sets include
the statistical uncertainty, the uncertainty on the factorization and renormalization scales, and the uncertainty on the top quark mass.Right: Summary of|Vtb|measurements in CMS.
deviations, and the upper limit on the rate relative to the SM expectation is 4.7 at 95% confidence level.
The tW process is of interest because it probes the tWb vertex in a different kinematic region than
s- and t-channel production. The definition of tW production in perturbative QCD at NLO mixes with top-quark pair production so special treatment is necessary in order to disentangle the two
pro-cesses [12, 13]. At measurement level the selection cuts are defined such that the interference effects
are small. The associated production of a single top quark and a W boson was measured in CMS
by using a data set of 12.2 fb−1 of pp collisions at √s=8 TeV [14]. Events with two leptons and a
jet originating from a b quark are selected. A multivariate analysis based on kinematic and topolog-ical properties is used to separate the signal from the dominant t¯t background. An excess consistent with the signal hypothesis is observed, with a significance which corresponds to 6.1 standard
devia-tions above a background-only hypothesis. The measured production cross section is 23.4±5.4 pb, in
agreement with the SM prediction.
In Fig. 1 (right) a summary of single top cross-section measurements at CMS are presented as
a function of the center-of-mass energy in comparison with the theory calculation at NLO+NNLL
accuracy. The Tevatron measurements are also shown. All cross-section measurements are very well
described by the theory calculations within their uncertainty. In Fig. 2 (right) a summary of Vtb
determinations by CMS is presented.
3 Differential cross sections
Thanks to the large available luminosity, CMS performed differential cross-section measurements in
t¯t production. Such measurements are crucial, as they allow even more stringent tests of perturba-tive QCD as description of the production mechanism and enhance the sensitivity to possible new
physics contributions, especially now that NNLO predictions for the main differential observables in
t¯t production have become available [15]. Furthermore, such measurements reduce the uncertainty in the description of t¯t final state as background in Higgs physics, searches for rare processes, or BSM physics.
Differential cross-sections are typically measured by applying a kinematic reconstruction on the
selected candidate events and subsequent unfolding the obtained event counts in bins of kinematic
) [GeV] t m(t
]
-1
[pb GeV )t
dM(t σ d 3 − 10 2 − 10 1 − 10 1
10 (13 TeV)
-1
2.3 fb
l+jets parton
CMS
Preliminary datasys⊕ stat
stat. Powheg P8 MG5_aMC@NLO P8 arXiv: 1601.07020 NLO+NNLL' ) [GeV] t M(t
400 600 800 1000 1200 1400 1600 1800 2000
data
theory 0.81
1.2 Njets
2 3 4 5 ≥6
jets dN σ d σ 1 -2 10 -1 10 1 10 (13 TeV) -1 2.2 fb CMSPreliminary
Dilepton jet| < 2.4
η > 30 GeV, |
jet T p Data Powheg v2+Pythia8 Powheg v2+Herwig++ MG5_aMC@NLO+Pythia8 [FxFx] MG5_aMC@NLO+Pythia8 [MLM] jets N
2 3 4 5 ≥6
Data Theory 0.6 0.8 1 1.2 1.4 Syst. ⊕ Stat. Stat.
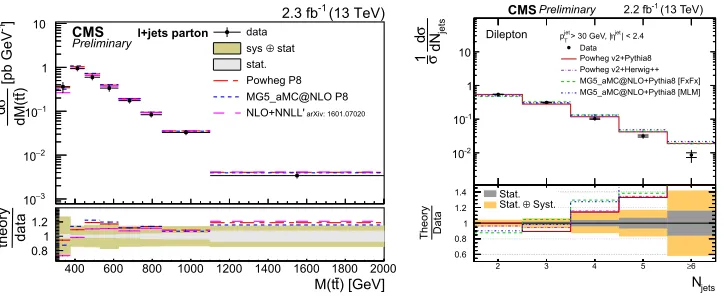
Figure 3. Left: Differential cross sections at parton level as a function of Mt¯tcompared to the SM predictions.
The measurements are performed in the lepton+jets decay channel with an electron or a muon in the final state.
Right: Normalized differential t¯t production cross section as a function of the jet multiplicity. The inner (outer)
error bars indicate the statistical (combined statistical and systematic) uncertainty. The measurements have been performed in dilepton decay channels.
distributions in order to correct for detector resolution effects, acceptance and migration effects. By
using pp collisions at 13 TeV with 2.3 fb−1of integrated luminosity CMS measured the differential t¯t
cross section as a function of various kinematic variables of the t¯t system as well as jet multiplicities.
The measurements are performed in the lepton+jets decay channel with an electron or a muon in the
final state [16]. The differential cross sections are presented at particle level, within a phase space close
to the experimental acceptance, and at parton level in the full phase space. The measurement at parton level is dominated by uncertainties in the parton shower and hadronization model. The dependency on these theoretical models is reduced for the particle level measurement, for which the experimental
uncertainties of jet energy calibration and b tagging efficiency are the most dominant. The results
are compared to several SM predictions of approximate NNNLO [17, 18] and NLO+NNLL[19]
calculations as shown in the left plot of Fig. 3. All calculations are compatible with the measured results. Similar measurements have been performed in dilepton decay channels at 13 TeV [20] using
data that correspond to an integrated luminosity of 2.2 fb−1. The results are compared with several
perturbative QCD calculations as shown in the right plot of Fig. 3 and are found to be broadly in agreement with the predictions.
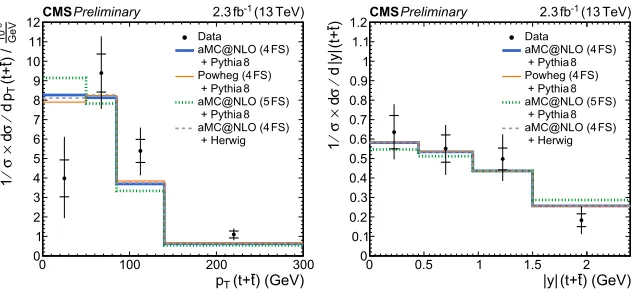
Differential cross-section measurements were also performed by CMS in single-top t-channel
pro-duction. Such measurements are extremely useful as they test our understanding of both QCD and EW top-quark interactions. Using pp collisions at a centre-of-mass energy of 13 TeV and
analyz-ing data that corresponded to an integrated luminosity of 2.3 fb−1the differential cross sections were
) (GeV) -(t+t
T
p
0 100 200 300
GeV
-3
10
) /
-(t+tT
p
d
⁄
σ
d
×
σ⁄
1
0 1 2 3 4 5 6 7 8 9 10 11
12CMSPreliminary 2.3fb-1 (13TeV)
Data FS) aMC@NLO (4
8 + Pythia
FS) Powheg (4
8 + Pythia
FS) aMC@NLO (5
8 + Pythia
FS) aMC@NLO (4 + Herwig
) (GeV) -(t+t |y|
0 0.5 1 1.5 2
)-(t+t
|y|
d
⁄
σ
d
×
σ⁄
1
0 0.1 0.2 0.3 0.4 0.5 0.6 0.7 0.8 0.9 1 1.1
1.2CMSPreliminary 2.3fb-1 (13TeV)
Data
FS) aMC@NLO (4
8 + Pythia
FS) Powheg (4
8 + Pythia
FS) aMC@NLO (5
8 + Pythia
FS) aMC@NLO (4 + Herwig
Figure 4. Left: Measured differential cross section of t-channel single top quark production as a function of
the top quark transverse momentum. Right: Measured differential cross section of t-channel single top quark
production as a function of the top quark rapidity. Horizontal ticks on the error bars indicate the statistical uncertainty and vertical bars indicate the total uncertainty per bin.
4 Top-quark mass measurements
The mass of the top quark (mt) is one of the fundamental parameters of the SM. With the discovery of
a Higgs boson at the LHC with a mass of about 126 GeV [22, 23], the precision measurement of the top-quark mass takes a central role in the question of the stability of the electroweak vacuum. Recent NNLO calculations [24, 25] together with the central values of the Higgs and top-quark masses put the electroweak vacuum in the metastable region. The uncertainty is dominated by the precision of the top-quark mass measurement and its interpretation as the pole mass.
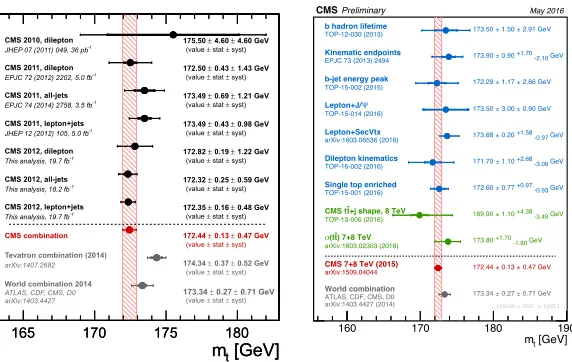
CMS has measured the top quark mass using pp data at √s = 8 TeV corresponding to a
lu-minosity of 19.7 fb−1 [26]. In the measurement all decay channels were used. The measurements
use analysis techniques in which either mt alone is determined or mt and the overall jet energy
scale factor are determined simultaneously. When the results from the √s= 8 TeV analysis are
combined with the published CMS results at √s = 7 TeV, a top quark mass measurement of
172.44±0.13(stat.)±0.47(syst.) GeV is achieved. Given the precision of the experimental results, a
detailed understanding of the relationship between the measurements and the value of mt in diff
er-ent theoretical schemes is needed. Currer-ent indications are that the preser-ent measuremer-ents based on the kinematic reconstruction of the top quark mass correspond approximately to the pole (“on-shell”)
mass to within a precision of about 1 GeV [27]. A summary of the CMS mtmeasurements and their
combination is shown in the left plot of Fig. 5. The top-quark mass can be extracted by using
alterna-tive techniques or observables that might have sensitivity on the mtlike the normalized invariant mass
distribution of the t¯t+jet system, the peak position of the energy distribution of b jets produced from
top-quark decays and several others. A long list of alternative measurements is shown in the right hand-side plot of Fig. 5 together with the references to the corresponding documentation.
5 Top polarization,
t¯t
spin correlations and charge asymmetry
) (GeV) -(t+t
T
p
0 100 200 300
GeV -3 10 ) / -(t+tT p d ⁄ σ d × σ⁄ 1 0 1 2 3 4 5 6 7 8 9 10 11
12CMSPreliminary 2.3fb-1 (13TeV)
Data FS) aMC@NLO (4 8 + Pythia FS) Powheg (4 8 + Pythia FS) aMC@NLO (5 8 + Pythia FS) aMC@NLO (4 + Herwig ) (GeV) -(t+t |y|
0 0.5 1 1.5 2
)-(t+t |y| d ⁄ σ d × σ⁄ 1 0 0.1 0.2 0.3 0.4 0.5 0.6 0.7 0.8 0.9 1 1.1
1.2CMSPreliminary 2.3fb-1 (13TeV)
Data FS) aMC@NLO (4 8 + Pythia FS) Powheg (4 8 + Pythia FS) aMC@NLO (5 8 + Pythia FS) aMC@NLO (4 + Herwig
Figure 4. Left: Measured differential cross section of t-channel single top quark production as a function of
the top quark transverse momentum. Right: Measured differential cross section of t-channel single top quark
production as a function of the top quark rapidity. Horizontal ticks on the error bars indicate the statistical uncertainty and vertical bars indicate the total uncertainty per bin.
4 Top-quark mass measurements
The mass of the top quark (mt) is one of the fundamental parameters of the SM. With the discovery of
a Higgs boson at the LHC with a mass of about 126 GeV [22, 23], the precision measurement of the top-quark mass takes a central role in the question of the stability of the electroweak vacuum. Recent NNLO calculations [24, 25] together with the central values of the Higgs and top-quark masses put the electroweak vacuum in the metastable region. The uncertainty is dominated by the precision of the top-quark mass measurement and its interpretation as the pole mass.
CMS has measured the top quark mass using pp data at √s= 8 TeV corresponding to a
lu-minosity of 19.7 fb−1 [26]. In the measurement all decay channels were used. The measurements
use analysis techniques in which either mt alone is determined or mt and the overall jet energy
scale factor are determined simultaneously. When the results from the √s= 8 TeV analysis are
combined with the published CMS results at √s = 7 TeV, a top quark mass measurement of
172.44±0.13(stat.)±0.47(syst.) GeV is achieved. Given the precision of the experimental results, a
detailed understanding of the relationship between the measurements and the value of mt in diff
er-ent theoretical schemes is needed. Currer-ent indications are that the preser-ent measuremer-ents based on the kinematic reconstruction of the top quark mass correspond approximately to the pole (“on-shell”)
mass to within a precision of about 1 GeV [27]. A summary of the CMS mtmeasurements and their
combination is shown in the left plot of Fig. 5. The top-quark mass can be extracted by using
alterna-tive techniques or observables that might have sensitivity on the mtlike the normalized invariant mass
distribution of the t¯t+jet system, the peak position of the energy distribution of b jets produced from
top-quark decays and several others. A long list of alternative measurements is shown in the right hand-side plot of Fig. 5 together with the references to the corresponding documentation.
5 Top polarization,
t¯t
spin correlations and charge asymmetry
One of the unique features of the top quark is that it decays before its spin can be flipped by the strong interaction. Thus the top-quark polarization is directly observable via the angular distribution of its
[GeV]
t
m
165 170 175 180
0 5
10 175.50± 4.60 ± 4.60 GeV syst)
±
stat
±
(value CMS 2010, dilepton
-1
JHEP 07 (2011) 049, 36 pb
1.43 GeV ± 0.43 ± 172.50 syst) ± stat ± (value CMS 2011, dilepton
-1
EPJC 72 (2012) 2202, 5.0 fb
1.21 GeV ± 0.69 ± 173.49 syst) ± stat ± (value CMS 2011, all-jets
-1
EPJC 74 (2014) 2758, 3.5 fb
0.98 GeV ± 0.43 ± 173.49 syst) ± stat ± (value CMS 2011, lepton+jets
-1
JHEP 12 (2012) 105, 5.0 fb
1.22 GeV ± 0.19 ± 172.82 syst) ± stat ± (value CMS 2012, dilepton
-1
This analysis, 19.7 fb
0.59 GeV ± 0.25 ± 172.32 syst) ± stat ± (value CMS 2012, all-jets
-1
This analysis, 18.2 fb
0.48 GeV ± 0.16 ± 172.35 syst) ± stat ± (value CMS 2012, lepton+jets
-1
This analysis, 19.7 fb
0.47 GeV ± 0.13 ± 172.44 syst) ± stat ± (value CMS combination 0.52 GeV ± 0.37 ± 174.34 syst) ± stat ± (value
Tevatron combination (2014) arXiv:1407.2682 0.71 GeV ± 0.27 ± 173.34 syst) ± stat ± (value
World combination 2014 ATLAS, CDF, CMS, D0 arXiv:1403.4427
[GeV]
t
m
165 170 175 180
0 5 10 [GeV] t m
160 170 180 190
0 5 10 2.91 GeV ± 1.50 ± 173.50 b hadron lifetime
TOP-12-030 (2013) GeV -2.10 +1.70 0.90 ± 173.90 Kinematic endpoints
EPJC 73 (2013) 2494
2.66 GeV ± 1.17 ± 172.29 b-jet energy peak
TOP-15-002 (2015) 0.90 GeV ± 3.00 ± 173.50 Ψ Lepton+J/ TOP-15-014 (2016) GeV -0.97 +1.58 0.20 ± 173.68 Lepton+SecVtx arXiv:1603.06536 (2016) GeV -3.09 +2.68 1.10 ± 171.70 Dilepton kinematics TOP-16-002 (2016) GeV -0.93 +0.97 0.77 ± 172.60 Single top enriched
TOP-15-001 (2016) GeV -3.49 +4.38 1.10 ± 169.90
+j shape, 8 TeV t CMS t TOP-13-006 (2016) GeV -1.80 +1.70 173.80
) 7+8 TeV t (t σ arXiv:1603.02303 (2016) 0.47 GeV ± 0.13 ± 172.44
CMS 7+8 TeV (2015)
arXiv:1509.04044 0.71 GeV ± 0.27 ± 173.34 World combination
ATLAS, CDF, CMS, D0 arXiv:1403.4427 (2014) May 2016 syst.) ± stat. ± (value CMSPreliminary
Figure 5. Left: Summary of the CMS mt measurements and their combination. The thick error bars show the
statistical uncertainty and the thin error bars show the total uncertainty. Also shown are the current Tevatron [28] and world average [29] combinations.Right: Summary of Run-I CMS alternative mtmeasurements.
decay products. In the SM, top quarks from pair production have only a small net polarization arising from electroweak corrections to the QCD-dominated production process, but the pairs have significant spin correlations [30]. Hence, it is possible to define and measure observables sensitive to the top-quark spin and its production mechanism. For low t¯t invariant masses, the production is dominated by the fusion of pairs of gluons with the same helicities, resulting in the creation of top quark pairs with antiparallel spins in the t¯t center-of-mass frame. For larger t¯t invariant masses, the dominant production is via the fusion of gluons with opposite helicities, resulting in t¯t pairs with parallel spins. For BSM models, couplings of the top quark to new particles can alter both the top quark polarization and the strength of the spin correlations in the t¯t system [30–33].
CMS has measured the top quark-antiquark spin correlations and the top quark polarization for t¯t
pairs produced in pp collisions at √s=8 TeV [34]. The data correspond to an integrated luminosity
of 19.5 fb−1. The measurements are performed using events with two oppositely charged leptons
(electrons or muons) and two or more jets, where at least one of the jets is identified as originating from a bottom quark. The spin correlations and polarization are measured from the angular distributions
of the two selected leptons, both inclusively and differentially, with respect to the invariant mass,
rapidity, and transverse momentum of the t¯t system. The measurements are unfolded to the parton level and found to be in agreement with predictions of the SM as can be seen in Fig. 6.
The t¯t charge asymmetry is sensitive to BSM contributions that might affect the t¯t production
process. The dominant t¯t production mechanism is the charge-symmetric gluon-gluon fusion. For the sub-dominant qq production mechanism, the symmetric pp collision does not define a forward and backward direction. Instead, the larger average momentum fraction of the valence quarks leads to an excess of top quarks produced in the forward and backward directions, while the top antiquarks are
produced more centrally. This makes the difference in the absolute values of the rapidities of the top
quark and anti-quark,∆|y| = |yt|-|y¯t|, a suitable observable to measure the t¯t charge asymmetry at
the LHC. The charge asymmetry, AC, is defined as AC=(N+−N−)/(N++N−), where N+and N−
|−
l
+ l
φ∆
/d|
σ
d
σ
1/
0.25 0.3 0.35 0.4 0.45
0.5 Data
MC@NLO NLO, SM
no spin corr. NLO,
| −
l + l φ ∆
|
Data/Simulation
0.95 1 1.05
0 π/6 π/3 π/2 2π/3 5π/6 π
(8 TeV)
-1
19.5 fb
CMS )*θl
/d(cos
σ
d
σ
1/
0.45 0.5 0.55
0.6 Data
MC@NLO NLO, SM
*
l θ
cos
-1 -0.5 0 0.5 1
Data/Simulation
0.95 1 1.05
(8 TeV)
-1
19.5 fb
CMS
Figure 6. Left: Normalized differential cross section as a function of|∆φl+,l−|. Right: Normalized diff
er-ential cross section as a function of cosθ∗l. The plots are shown data (points); parton-level predictions from MC@NLO [35, 36] (dashed histograms); and theoretical predictions at NLO [30, 37] with (SM) and without (no spin corr.) spin correlations (solid and dotted histograms, respectively). For the cosθ∗l distribution, CP
conserva-tion is assumed in the combinaconserva-tion of the cosθ∗
l measurements from positively and negatively charged leptons.
The ratio of the data to the MC@NLO prediction is shown in the lower panels. The inner and outer vertical bars on the data points represent the statistical and total uncertainties, respectively.
on the possible existence and the nature of new physics contributions, it is crucial to measure not only
the inclusive asymmetry but also ACas a function of variables magnifying the t¯t charge asymmetry.
CMS has measured the t¯t charge asymmetry at 8 TeV with an integrated luminosity of 19.7
fb−1 [38]. Events are selected if they contain one electron or muon and four or more jets, at least
one of which is identified as originating from the hadronization of a bottom quark. The measurement is based on the reconstructed four-momenta of the t and ¯t quarks in each event. The observed
distribu-tions are then corrected for background contribudistribu-tions, resolution, and selection efficiency. Acceptance
corrections are applied, correcting either to the fiducial phase space or to the full phase space. The
in-clusive charge asymmetry is found to be 0.0010±0.0068(stat)±0.0037(syst). Measurements were also
performed in a reduced fiducial phase space of top quark pair production, with an integrated result of
-0.0035±0.0072(stat)±0.0031(syst). All measurements are consistent within two standard deviations
with zero asymmetry as well as with the predictions of the SM.
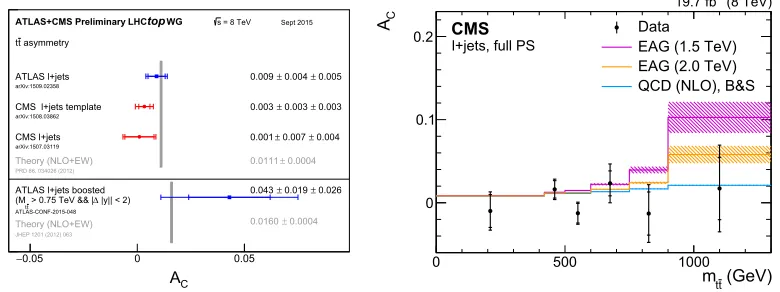
A summary of the charge asymmetry measurements on ATLAS and CMS at 8 TeV is shown on the left plot of figure 7. The plot shows both the inclusive measurements and the measurement using boosted events, compared to the respective theory predictions. The right hand-side plot of figure 7
shows the corrected asymmetry as a function of mt¯t. The results correspond to the full phase space.
The measured values are compared to NLO predictions for the SM based on calculations by K¨uhn and Rodrigo (K&R) [39] and Bernreuther and Si (B&S) [37, 40], as well as to the predictions of a model
featuring an effective axial-vector coupling of the gluon (EAG) [41, 42]. The inner bars indicate
the statistical uncertainties, while the outer bars represent the statistical and systematic uncertainties
added in quadrature. The differential measurements show a good agreement with the SM predictions.
For the benchmark model involving an effective axial-vector coupling of the gluon, the measurement
|−
l
+ l
φ∆
/d|
σ
d
σ
1/
0.25 0.3 0.35 0.4 0.45
0.5 Data
MC@NLO NLO, SM
no spin corr. NLO,
| −
l + l φ ∆
|
Data/Simulation
0.95 1 1.05
0 π/6 π/3 π/2 2π/3 5π/6 π
(8 TeV)
-1
19.5 fb
CMS )*θl
/d(cos
σ
d
σ
1/
0.45 0.5 0.55
0.6 Data
MC@NLO NLO, SM
*
l θ
cos
-1 -0.5 0 0.5 1
Data/Simulation
0.95 1 1.05
(8 TeV)
-1
19.5 fb
CMS
Figure 6. Left: Normalized differential cross section as a function of|∆φl+,l−|. Right: Normalized diff
er-ential cross section as a function of cosθ∗l. The plots are shown data (points); parton-level predictions from MC@NLO [35, 36] (dashed histograms); and theoretical predictions at NLO [30, 37] with (SM) and without (no spin corr.) spin correlations (solid and dotted histograms, respectively). For the cosθl∗distribution, CP
conserva-tion is assumed in the combinaconserva-tion of the cosθ∗
l measurements from positively and negatively charged leptons.
The ratio of the data to the MC@NLO prediction is shown in the lower panels. The inner and outer vertical bars on the data points represent the statistical and total uncertainties, respectively.
on the possible existence and the nature of new physics contributions, it is crucial to measure not only
the inclusive asymmetry but also ACas a function of variables magnifying the t¯t charge asymmetry.
CMS has measured the t¯t charge asymmetry at 8 TeV with an integrated luminosity of 19.7
fb−1 [38]. Events are selected if they contain one electron or muon and four or more jets, at least
one of which is identified as originating from the hadronization of a bottom quark. The measurement is based on the reconstructed four-momenta of the t and ¯t quarks in each event. The observed
distribu-tions are then corrected for background contribudistribu-tions, resolution, and selection efficiency. Acceptance
corrections are applied, correcting either to the fiducial phase space or to the full phase space. The
in-clusive charge asymmetry is found to be 0.0010±0.0068(stat)±0.0037(syst). Measurements were also
performed in a reduced fiducial phase space of top quark pair production, with an integrated result of
-0.0035±0.0072(stat)±0.0031(syst). All measurements are consistent within two standard deviations
with zero asymmetry as well as with the predictions of the SM.
A summary of the charge asymmetry measurements on ATLAS and CMS at 8 TeV is shown on the left plot of figure 7. The plot shows both the inclusive measurements and the measurement using boosted events, compared to the respective theory predictions. The right hand-side plot of figure 7
shows the corrected asymmetry as a function of mt¯t. The results correspond to the full phase space.
The measured values are compared to NLO predictions for the SM based on calculations by K¨uhn and Rodrigo (K&R) [39] and Bernreuther and Si (B&S) [37, 40], as well as to the predictions of a model
featuring an effective axial-vector coupling of the gluon (EAG) [41, 42]. The inner bars indicate
the statistical uncertainties, while the outer bars represent the statistical and systematic uncertainties
added in quadrature. The differential measurements show a good agreement with the SM predictions.
For the benchmark model involving an effective axial-vector coupling of the gluon, the measurement
at high mt¯texcludes new physics scales below 1.5 TeV at the 95% confidence level.
C A 0.05
− 0 0.05
0 8
ATLAS l+jets 0.009± 0.004 ± 0.005
ATLAS l+jets boosted 0.043± 0.019 ± 0.026
CMS l+jets template 0.003± 0.003 ± 0.003
CMS l+jets 0.001± 0.007 ± 0.004
0.0004
±
0.0111 Theory (NLO+EW)
PRD 86, 034026 (2012)
0.0004
±
0.0160 Theory (NLO+EW)
JHEP 1201 (2012) 063 |y|| < 2) ∆ > 0.75 TeV && |
tt
(M
ATLAS-CONF-2015-048 arXiv:1509.02358
arXiv:1507.03119 arXiv:1508.03862
asymmetry tt
= 8 TeV s Sept 2015 ATLAS+CMS PreliminaryLHCtopWG
total stat (syst)
± (stat) ±
C A
(GeV) tt m
0 500 1000
C
A
0 0.1
0.2 DataEAG (1.5 TeV)
EAG (2.0 TeV) QCD (NLO), B&S
(8 TeV)
-1
19.7 fb
CMS
l+jets, full PS
Figure 7. Left: Summary of the charge asymmetry measurements on ATLAS and CMS at 8 TeV showing
both the inclusive measurements and the measurement using boosted events, compared to the respective theory predictions. The uncertainty on the theory predictions is shown but is very small.Right: Corrected asymmetry as a function of mt¯t. The results correspond to the full phase space. The measured values are compared to NLO
predictions for the SM, as well as to the predictions of a model featuring an effective axial-vector coupling of the
gluon (EAG). The inner bars indicate the statistical uncertainties, while the outer bars represent the statistical and systematic uncertainties added in quadrature.
6 Summary
Top-quark physics at hadron colliders has developed into precision physics. Various properties of the top quark have been measured with high precision. Up to now, all measurements are consistent with the SM predictions and allow stringent tests of the underlying production mechanisms by strong and weak interactions. Given the large event samples available at the CMS experiment, top-quark proper-ties has been determined both in t¯t as well as in electroweak single top-quark production. Furthermore, the t¯t associated production with heavy bosons provides further information on the top-quark elec-troweak couplings. At the same time various models of physics beyond the SM involving top-quark production are being constrained. As the first results from LHC Run-II at a higher center-of-mass energy and much higher luminosity starting to be released, top-quark physics has the potential to shed light on open questions and new aspects of physics at the TeV scale.
References
[1] D0 Collaboration, Phys. Rev. D85, 091104 (2012)
[2] G. Mahlon and S. J. Park, Phys. Rev. D81, 074024 (2010)
[3] CMS Collaboration, CMS-PAS-TOP-16-005, CERN, Geneva (2016)
[4] M. Czakon and A. Mitov,Computer Physics Communications,185, 2930 (2014)
[5] M. Czakon, P. Fiedler and A. Mitov, Phys. Lett. B110, 252004 (2013)
[6] CMS Collaboration, J. High Energy Phys.01(2016) 096
[7] CMS Collaboration, CMS-PAS-TOP-16-009, CERN, Geneva (2016) [8] CMS Collaboration, CMS-PAS-TOP-16-003, CERN, Geneva (2016)
[10] R. Ball, V. Bertone, F. Cerutti et al., Nucl. Phys. B855, (2012) 608
[11] CMS Collaboration, J. High Energy Phys.09(2016) 027
[12] S. Frixione, E. Laenen, P. Motylinski et al., J. High Energy Phys.07, (2008) 029
[13] T. M. P. Tait, Phys. Rev. D61, (1999) 034001
[14] CMS Collaboration, Phys. Rev. Lett.112, 231802 (2014)
[15] M. Czakon, D. Heymes, and A. Mitov, Phys. Rev. Lett.116, 082003 (2016)
[16] CMS Collaboration, CMS-PAS-TOP-16-008, CERN, Geneva (2016)
[17] N. Kidonakis, Phys. Rev. D90, 014006 (2014)
[18] N. Kidonakis, Phys. Rev. D91, 031501 (2015)
[19] B. Pecjak, D. Scott, X. Wang, and L. L. Yang, Phys. Rev. Lett.116, 202001 (2016)
[20] CMS Collaboration, CMS-PAS-TOP-16-011, CERN, Geneva (2016) [21] CMS Collaboration, CMS-PAS-TOP-16-004, CERN, Geneva (2016)
[22] ATLAS Collaboration, Phys. Lett. B716, 1 (2012)
[23] CMS Collaboration, Phys. Lett. B716, 30 (2012)
[24] G. Degrassi, et al., J. High Energy Phys.08, 98 (2012)
[25] A. V. Bednyakov, et al., Phys. Rev. Lett.115, 201802 (2015)
[26] CMS Collaboration, Phys. Rev. D93, 072004 (2016)
[27] A. Buckley, et al., Phys. Rep.504, 145 (2011)
[28] The Tevatron EWK Working Group, CDF and D0 Collaborations, arXiv:1407.2682 [29] ATLAS, CDF, CMS and D0 Collaborations, arXiv:1403.4427
[30] W. Bernreuther and Z.-G. Si, Phys. Lett. B725, 115 (2013)
[31] D. Krohn, T. Liu, J. Shelton, and L.-T. Wang, Phys. Rev. D84, 074034 (2011)
[32] S. Fajfer, J. F. Kamenik, and B. Melic, J. High Energy Phys.08(2012) 114
[33] J. A. Aguilar-Saavedra and M. Perez-Victoria, J. Phys. Conf. Ser.447, 012015 (2013)
[34] CMS Collaboration, Phys. Rev. D93, 052007 (2016)
[35] S. Frixione and B. R. Webber, J. High Energy Phys.06, 029 (2002)
[36] S. Frixione, P. Nason, and B. R. Webber, J. High Energy Phys.08, 007 (2003)
[37] W. Bernreuther and Z.-G. Si, Phys. Lett. B837, 90 (2010)
[38] CMS Collaboration, Phys. Lett. B757, 154 (2016)
[39] J.H. K¨uhn, G. Rodrigo, J. High Energy Phys.01, 063 (2012)
[40] W. Bernreuther, Z.-G. Si, Phys. Rev. D86, 034026 (2012)
[41] E. Gabrielli, M. Raidal, A. Racioppi, Phys.Rev. D85, 074021 (2012)