EFFICIENT GRIDDING AND SEGMENTATION
FOR MICROARRAY IMAGES
P.Thamaraimanalan1, D.Dhinesh kumar2, K.Nirmalakumari3
1, 2,
M.E-Applied Electronics, Department of ECE,
3
Assistant Professor(Sr.G), department of ECE, Bannari Amman Institute of Technology,
Erode, India.
[email protected], [email protected] ABSTRACT
This works presents a new efficient gridding and segmentation approach for microarray image. Initially, the microarray images are pre-processed using Stationary Wavelet Transform (SWT), followed by a hard thresholding filtering technique to get a de-noised microarray image. Then, we use autocorrelation to enhance the self-similarity of the image profile to get an efficient gridding. The thresholding method is used for segmentation. The combined global and local thresholding improves the segmentation accuracy which is seen by the improvement in log intensity ratio. The proposed approach was evaluated using images from the Stanford Microarray Database, proved more accurate in intensity computation and more reliable means for estimating gene expression than conventional methods.
I.INTRODUCTION
Microarray technology has provided the biology community with a powerful tool for exploring the field of functional genomics. An arrayed prints thousands of DNA sequences onto glass slides. Each slide contains several sub-grids that are two dimensional arrays of DNA spots. In the cDNA microarray experiment ribonucleic acid (RNA) is first isolated from both control and experimental samples of the
cells of interest. The extracted RNAs are then converted into cDNA. These two populations are usually labelled with fluorescent dyes such as Cy3 (green) and Cy5 (red). The mixture of these samples is then hybridized (i.e. mix the two samples) to a glass slide. After hybridization the slide is scanned with red and green laser. The difference in fluorescence between the two colour channels shows the relative difference of gene’s expression between the two sources. The end product of the comparative hybridization experiment is a scanned array image. Gene’s expression data is derived from these images and can be used for further steps of analysis.
1.1 DNA MICROARRAY IMAGE
A DNA microarray (also commonly known as DNA chip or biochip) is a collection of microscopic DNA spots attached to a solid surface. Scientists use DNA microarrays to measure the expression levels of large numbers of genes simultaneously or to genotype multiple regions of a genome. Each DNA spot contains Pico
moles (10−12 moles) of a specific DNA
sequence, known as probes (or reporters or oligos). These can be a short section of a gene or other DNA element that are used to hybridize a cDNA or cRNA (also called anti-sense RNA) sample under high-
stringency conditions. Probe-target
hybridization is usually detected and quantified by detection of fluorophore-, silver-, or chemilum inescence -labelled targets to determine relative abundance of nucleic acid sequences in the target.
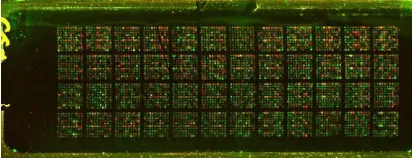
Figure 1.1 Microarray image
Scientists used to be able to perform genetic analyses of a few genes at once. DNA microarray allows us to analyze thousands of genes in one experiment To measure changes in gene expression levels – two samples’ gene expression can be compared from different samples, such as from cells of different stages of mitosis.
1.2 MICROARRAY IMAGE ANALYSIS Microarray analysis techniques are used in
interpreting the data generated from
experiments on DNA, RNA, and protein microarrays, which allow researchers to investigate the expression state of a large number of genes - in many cases, an
organism's entire genome - in a single experiment. Such experiments can generate very large volumes of data, allowing researchers to assess the overall state of a cell or organism. These large data amount can be difficult to analyze, especially in the absence of good gene annotation.
Figure 1.2 Microarray Image Analyses
An ideal microarray image must have the following properties. All the blocks are of the same size and the spacing between the blocks is regular. The spots are cantered on the intersections of rows and columns. The size and shape of the spots is perfectly circular and identical for all spots. The location of the blocks is fixed in the images for a given slide type. The background intensity is minimal and uniform.
The primary goal of microarray image processing is to extract the intensities of red
and green channels. Thus, image
segmentation must be applied, grouping the pixels of the image into foreground and background. The background intensities are used to adjust the foreground intensities for local noise, resulting in corrected red and green intensities for each spot. The methods,
which have been proposed for the
background pixels, whereas pixels with higher intensity as signal pixels.
The organization of the thesis is as follows. Chapter 2 explains about the efficient gridding where the precise localization of each spot with each background area is defined. Chapter 3 explains about the segmentation where the classification of the pixel to either the foreground or the background of the image-spot is performed. The results are discussed in chapter 4. And finally conclusion and future scope are provided in chapter 5.
II.EFFICIENT GRIDDING
2.1 INTRODUCTION
A efficient is a tessellation of n dimensional Euclidean space by congruent parallel
otopes.Grids of this type appear on graph
paper and may be used in finite element analysis as well as finite volume methods and finite difference methods. Since the derivatives of field variables can
be conveniently expressed as finite
differences, structured grids mainly appear in finite difference methods. Unstructured grids offer more flexibility than structured grids and hence are very useful in finite element and finite volume methods.
A grid usually refers to two or more infinite sets of evenly-spaced parallel lines at particular angles to each other in a plane, or the intersections of such lines. The two most common types of grid are orthogonal grids, with two sets of lines perpendicular to each other (such as the square grid), and isometric grids, with three sets of lines at 60-degree angles to each other (such as the triangular grid). It should be noted that in most grids with three or more sets of lines, every intersection includes one element of each set.
2.2 BLOCK DIAGRAM OF THE PROPOSED FRAMEWORK
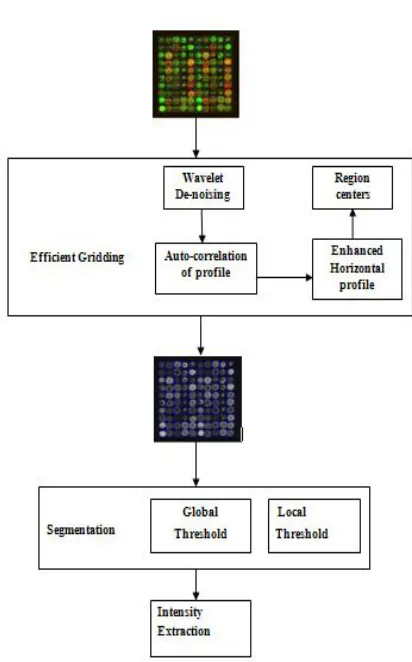
Figure 2.1 Block diagram of the proposed framework
2.3 GRIDDING
Gridding is the first, essential stage of processing cDNA microarray images. The existing tools for allocating the grid structure in a microarray image often require human intervention which causes variations to the gene expression results. an original and fully-automatic approach to gridding microarray images is presented.
2.3.1 WAVELET DE-NOISING
preserving the image features (such as edges, and textures). The multi-resolution analysis performed by the wavelet transform has been shown to be a powerful tool to achieve these goals. Imaged noising is the process of removing noise from images. It has remained a fundamental problem in the field of image processing. Digital images play an important role in daily life applications like satellite television, magnetic resonance imaging, computer
tomography, geographical information
systems, astronomy and many other research fields. While we cannot completely avoid image noise, we can certainly reduce them. The image noise is removed usually by image s
2.3.2 AUTO-CORRELATION OF PROFILE
Autocorrelation is the cross-correlation of a signal with itself. Informally, it is the similarity between observations as a function of the time lag between them. It is a mathematical tool for finding repeating patterns, such as the presence of a periodic signal obscured by noise, or identifying the missing fundamental frequency in a signal implied by its harmonic frequencies. It is often used in signal processing for analyzing functions or series of values, such as time domain signals.
2.3.3 ENHANCED HORIZONTAL PROFILE
Image enhancement operators improve the detestability of important image details or object by man or machine. Example
operations include noise reduction
smoothing, contrast stretching, and edge enhancement.
The spots of a row should have similar vertical (y coordinate) coordinates, while all the spot of a Column should have approximately the same horizontal (x- coordinate) coordinates in the image.
2.3.4 REGION CENTERS
Region growing is a simple region- based image segmentation method. It is also classified as a pixel-based image segmentation method since it involves the selection of initial seed points. This
approach to segmentation examines
neighbouring pixels of initial “seed points” and determines whether the pixel neighbours should be added to the region. The process is iterated on, in the same manner as general data clustering algorithms .The centres of the spots are and where the gaps between the spots can be found.
III.SEGMENTATION
FOR MICROARRAY IMAGE
3.1 Microarray Image Segmentation
The outcome of the previously described image processing technique is an automated approximation of spot locations, defined as a rectangular area enclosing one spot. The next step is to identify pixels that belong to the microarray spot and pixels that represent background information. Thus, taking into account the grid alignment, a template which defines areas with foreground and background pixels is overlaid on the microarray spot. Different software platforms use different strategies to define the template; Scan Alyze uses all the pixels that are not within the spot mask but within the dotted square cantered as a region for background estimation, Array Vision considers an area like the one between the two circles as background and Gene Pix estimates the background on the basis of the pixel values in the diamond areas. In case of our automated image processing chain, shock filter based approach for grid
alignment introduces segmentation
3.2 GLOBAL THRESHOLD
A histogram of the input image intensity should reveal two peaks, corresponding respectively to the signals from the
background and the object. Global
thresholding consists of setting an intensity value (threshold) such that all voxels having intensity value below the threshold belong to one phase, the remainer belong to the other. Global thresholding is as good as the degree of intensity separation between the two peaks in the image. It is an unsophisticated segmentation choice.
3.3 LOCAL THRESHOLD
In local thresholding, the original image is partitioned into smaller sub images and a threshold is determined for each of the sub images. This yields a thresholded image with gray level discontinuities at the boundaries of two different sub images. The threshold of a region can be determined by either the point-dependent method or the region-dependent method. A smoothing technique is then applied to eliminate the discontinuities.
3.4 COMBAINED LOCAL AND GLOBAL THRESHOLD
Global thresholding consists of setting an intensity value (threshold) such that all voxels having intensity value below the threshold belong to one phase, the remainer belong to the other. Global thresholding is as good as the degree of intensity separation between the two peaks in the image. In local thresholding, the original image is partitioned into smaller sub images and a threshold is determined for each of the sub images. This yields a thresholded image with gray level discontinuities at the boundaries of two different sub images. The threshold of a region can be determined by
either the point-dependent method or the region-dependent method.
3.5 INTENSITY EXTRACTION
DNA microarrays are commonly used in the rapid analysis of gene expression in organisms. Image analysis is used to measure the average intensity of circular image areas (spots), which correspond to the level of expression of the genes. A crucial aspect of image analysis is the estimation of the background noise. Currently, background subtraction algorithms are used to estimate the local background noise and subtract it from the signal.
IV.SIMULATION AND RESULTS
4.1 Dataset
The performances of regular gridding and segmentation algorithms were estimated on five actual microarray images, which were replicates at five different distinct time intervals of the same experiment for both the Red and Green channels. Those microarray
images were obtained from Stanford
Microarray Database (SMD).Each
microarray experiment in SMD provides two gray scale images (green and red channel), each one consisting of 16 blocks. The size of the images is 2100X2050 pixels, while the size of each block is approximately 500 X500 pixels. Each block consists of 576 spots, i.e.24X24 rows and columns of spots.
4.2 Performance evaluation
stage the spatial information (i.e. the location of each spot in the image) of each spot is needed.
Actual mean intensity values and boundaries of each spot were a priori known. More specifically, the annotation contains the coordinates of the top, bottom, left and right edges of a square area around of each spot and not directly the coordinates of the centre of each spot. Given the square area around of a spot, the centre of the spot that the annotation provides is assumed to be the centre of this square area.
Wavelet de-noising
Figure 4.1 Wavelet de-nosing Image
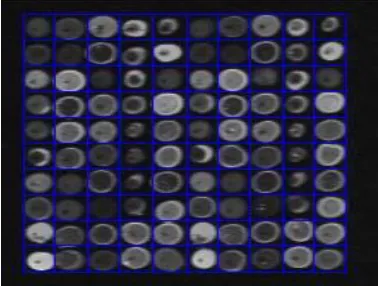
Efficient gridding
Figure 4.2 Efficient gridding image
Global Threshold
Figure 4.3 Global Threshold Image
Local Threshold
Figure 4.4 Local Threshold Image
Combined Threshold
Intensity Extraction
Red Intensity
Figure 4.6 Red intensity Image
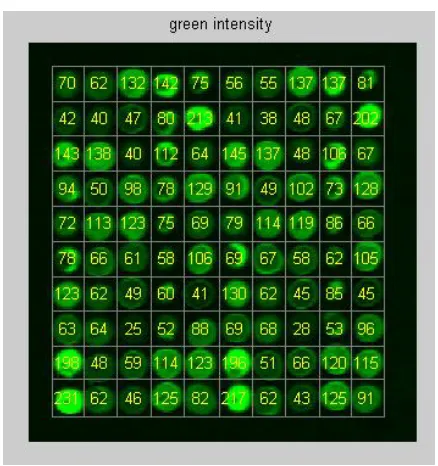
Green Intensity
Figure 4.7 Green Intensity Image
V.CONCLUSION AND FUTURE SCOPE
In this work for the microarray image the efficient gridding algorithm which consists of wavelet de-noising, auto- correlation enhanced horizontal profile and region centres were applied and the resulted image is segmented using local and global threshold method. The combined local and global threshold improves the segmentation accuracy which is seen by the improvement in log intensity ratio.
Future Scope
The future scope is to use novel algorithms in neural networks and other algorithms to further improve the segmentation accuracy.
REFERENCES
1. KKarakach Tobias, M Flight Robert , E Douglas Susan , D Wentzell Peter , " An introduction to DNA microarrays for gene expression analysis", J ChemometrIntell Lab Syst 2010, Vol-104, PP.28–52.
2.YH Yang, MJ Buckley, S Duboit, TP Speed, " Comparison of methods for image analysis on cDNA microarray data" , J Computat Graph Stat 2002,Vol-11, PP.108– 36.
3. MSchena, D Shalon, RW Davis, PO Brown," Quantitative monitoring of gene expression patterns with a complementary DNA microarray", Science 1995, Vol-270, PP.467–70.
6. X Wang, S Ghosh, SW Guo," Quantitative quality control in microarray image processing and data acquisition", Nucleic Acids Res 2001, Vol-29(15),PP .75. 7. O Demirkaya, MH Asyali, MM Shoukri,
KS Abu-Khabar," Segmentation of
microarray cDNA spots using MRF-based method", In: Proceedings of the 25th annual international conference of the IEEE engineering in medicine and biology society, Vol-1; 2003,PP. 674–7.
8. D Bozinov, J Rahnenführer," Unsupervised technique for robust target separation and analysis of DNA microarray spots through adaptive pixel clustering", Bioinformatics 2002,
Vol-18,PP.747–56.
9. QLi, C Fraley, RE Bumgarner, KY Yeung, AE Raftery," Donuts, scratches and blanks: robust model based segmentation of microarray images", Bioinformatics 2005,Vol-21,PP.2875–82.
10. ALehmussola, P Ruusuvuori, O Yli- Harja," Evaluating the performance of
microarray segmentation algorithms",
Bioinformatics 2006,Vol-22,PP.29100– 32917.
11. J Gollub, CA Ball, G Binkley, K Demeter, DB Finkelstein, JM Hebert, " The Stanford microarray database (SMD): data access and quality assessment tools", Nucleic Acids Res 2003,Vol-31,PP.94–6.
12.A Lehmussola,"Evaluating the