1
An isolated Complex V inefficiency and dysregulated mitochondrial function in immortalized lymphocytes from ME/CFS patients
Daniel Missailidis1, Sarah J. Annesley1, Claire Y. Allan1, Oana Sanislav1, Brett A. Lidbury2, Donald P. Lewis3, Paul R. Fisher1*
1Department of Physiology, Anatomy, and Microbiology, La Trobe University, Melbourne, VIC 3086, Australia 2National Centre for Epidemiology and Population Health, Research School of Population Health, Australian National
University, Canberra, ACT 2601, Australia
3CFS Discovery Clinic, Melbourne, VIC 3111, Australia
*Corresponding author: [email protected] Tel. + 61 3 9479 2229
2
Abstract
Myalgic Encephalomyelitis/Chronic Fatigue Syndrome (ME/CFS) is an enigmatic condition
characterized by fatigue that is unaided by rest and by exacerbation of symptoms after
exertion (post-exertional malaise or “PEM”). There is no definitive molecular marker or
known underlying pathological mechanism for the condition. Increasing evidence for
aberrant energy metabolism suggests a role for mitochondrial dysfunction in ME/CFS. Our
objective was therefore to measure mitochondrial function and cellular stress sensing in
actively metabolising patient blood cells. We immortalized lymphoblasts isolated from 51
ME/CFS patients diagnosed according to the Canadian Consensus Criteria and an age- and
gender-matched control group. Parameters of mitochondrial function and energy stress
sensing were assessed by Seahorse extracellular flux analysis, proteomics, and an array of
additional biochemical assays. As a proportion of the basal oxygen consumption rate (OCR),
the rate of ATP synthesis by Complex V was significantly reduced in ME/CFS lymphoblasts,
while significant elevations were observed in Complex I OCR, maximum OCR, spare
respiratory capacity, nonmitochondrial OCR and “proton leak” as a proportion of the basal
OCR. This was accompanied by an elevation of mitochondrial membrane potential,
chronically hyperactivated TOR Complex I stress signalling and upregulated expression of
mitochondrial respiratory complexes, fatty acid transporters and enzymes of the β-oxidation
and TCA cycles. By contrast, mitochondrial mass and genome copy number, as well as
glycolytic rates and steady state ATP levels were unchanged. Our results suggest a model in
which ME/CFS lymphoblasts have a Complex V defect accompanied by compensatory
upregulation of their respiratory capacity that includes the mitochondrial respiratory
complexes, membrane transporters and enzymes involved in fatty acid β-oxidation. This
homeostatically returns ATP synthesis and steady state levels to “normal” in resting cells,
but may leave them unable to adequately respond to acute increases in energy demand as
the relevant homeostatic pathways are already activated.
Keywords: Myalgic Encephalomyelitis, Chronic Fatigue Syndrome, mitochondria, Complex V,
3
1. Introduction
Myalgic Encephalomyelitis (ME), also referred to as Chronic Fatigue Syndrome (CFS), is a
condition which is little understood, its hallmarks being chronic, unexplained fatigue and the
debilitating overexertion “payback” termed post exertional malaise (PEM) experienced by
patients [1]. PEM can occur after even the simplest of daily physical tasks and may be
accompanied by symptoms affecting a range of body systems. The lack of objective, timely
and accurate diagnostic criteria leaves patients for long periods without a clear diagnosis or
an informed understanding of the condition [1,2]. It is paramount that fundamental
molecular explanations for the underlying pathophysiology of ME/CFS and reliable
biomarkers are pursued. These could lead to reliable, faster diagnosis and, in the longer
term, rational, effective treatments.
Mitochondrial function is of interest to ME/CFS research as a bioenergetic explanation for
the recurrent fatigue and the myriad links between the disorder’s characteristic immune
inflammation and the mitochondria [3]. Evidence for mitochondrial dysfunction in ME/CFS
has been sought in the last decade, yet remains inconsistent. Reduced mitochondrial
biogenesis but not normalised respiratory chain enzyme activities have been reported in the
muscle of ME/CFS individuals [4]. Muscle mitochondrial biogenesis is upregulated by exercise [5], so this reduction is likely to be caused by the necessarily reduced exercise that ME/CFS patients can undertake. Mitochondrial function in ME/CFS neutrophils [6,7] or respiration in ME/CFS peripheral blood mononuclear cells (PBMCs) [8] are reportedly
reduced, yet the Oxidative Phosphorylation (OXPHOS) complexes appear normal [9,10], while the expression of mitochondrial proteins in patient saliva, platelets, and lymphocytes is
elevated [11-13].
Differences between patient and control serum and urine metabolomes have been
attributed to reduced provision of acetyl CoA to the TCA cycle caused by a defect in
glycolysis [14] or by a defect in pyruvate dehydrogenase (PDH) [15]. While inconsistent, both proposals draw attention to a potential role in ME/CFS for impaired provision of reducing
equivalents to mitochondrial OXPHOS by the TCA cycle. Despite their shared conviction that
4
the nature of these problems prompted us to reexamine the issue of mitochondrial function
and its regulation in ME/CFS cells.
A key regulator of mitochondrial function is TORC1 (Target of Rapamycin Complex I) which
regulates cell growth and energetics in a variety of cellular stress-sensing pathways [16]. This pathway upregulates the expression of nuclear-encoded mitochondrial proteins [17], among
which are subunits of the OXPHOS complexes [18]. Despite this connection, and the agency
of TORC1 within a complex regulatory network which responds to intracellular stressors
including energy supply, dysregulation of this signaling pathway has not yet been
investigated in ME/CFS cells.
To clarify the roles of aberrant mitochondrial function and TORC1 signaling in ME/CFS, we
have compared parameters of mitochondrial function in immortalized lymphocytes (termed
lymphoblasts) from patient blood with those from healthy age- and gender-matched
controls. We found that mitochondrial function in ME/CFS cells is indeed abnormal, with an
isolated Complex V deficiency accompanied by elevated capacity of Complexes I to IV,
increased membrane potential, upregulation of TORC1 activity and elevated expression of
diverse mitochondrial proteins involved ATP-generating catabolic pathways. This pattern of
changes in mitochondrial function in ME/CFS lymphoblasts is distinct from what we
observed using the same approach to other neurological conditions, for example the
mitochondrial hyperactivity we reported previously in Parkinson’s Disease lymphoblasts [19]
and Fragile X-associated Tremor/Ataxia Syndrome lymphoblasts [20]. It suggests a model involving a primary deficiency in Complex V function, combined with homeostatic,
compensatory upregulation of TORC1 activity and mitochondrial protein expression.
2. Materials and Methods
2.1 Participant cohort
Participants belonged to two groups: ME/CFS patients (n=51, 86% female, median age 50,
age range 26-70) or healthy controls (n=22, 68% female, median age 41, age range 21-58)
without any family history of ME/CFS or similar myalgias, nor cohabiting with ME/CFS
patients. There was no significant difference between the patient and control groups in
5
test, participants grouped by ages in 5 year increments, p=0.19). Age was not recorded for 5
female controls, but none of the variables we measured or conclusions were significantly
affected by inclusion of these 5 controls. This is not surprising since neither gender (ANOVA)
nor age (multiple regression, Figure S1) had an effect on any of the parameters of
mitochondrial function and TORC1 signalling (p>0.05).
Participants were assessed and samples collected at CFS Discovery Clinic, Melbourne,
Australia, who have a long running specialization and interest in ME/CFS. Participants were
selected using the Canadian Consensus Criteria [21] assessed for postorthostatic tachycardia
syndrome comorbidity, and asked to complete the Depression, Anxiety and Stress Scale
questionnaire and the Epworth Sleepiness Scale questionnaire. ME/CFS specific severity
assessments were also conducted using Richardson and Lidbury’s Weighted Standing Time
[22]. 15 mL of blood was taken per participant in heparin-treated vacutainer tubes (BD).
Patients with other known reasons for fatigue were excluded.
The project was approved by the Australian National University Human Research Ethics
Committee (Reference 2015/193) and accepted as an externally approved project by the La
Trobe University Human Ethics Committee (26th Feb., 2016).
2.2 PBMC isolation from blood sample and immortalization
PBMCs were isolated from blood, stored and immortalized to form lymphoblast cultures as
previously described [19]. Briefly, 5x10⁶ lymphocytes isolated by Ficoll-Paque density
centrifugation were resuspended in 5 mL RPMI 1640 without L-glutamine (Life
Technologies) supplemented with 1X Glutamax (Life Technologies), 10% FBS and 1%
Penicillin/Streptomycin. 1 mL culture supernatant from B95.8 cells expressing Epstein-Barr
virus (EBV) was added, and 150 µL of the mix was seeded per well in a 96-well U-bottom
plate, then incubated for one hour within a humidified 5% CO2 incubator at 37 C. A final
concentration of 500 ng/mL Cyclosporin A (Sigma) was then added to each well. Cultures
were fed weekly by replacing half of the medium with the same formulation, without
disturbing the cells. This process was repeated over a period of approximately three weeks
until the cells were confluent and growing rapidly, after which the lymphoblast cultures
6 2.3 Lymphoblast cultures
Confluent lymphoblasts were transferred to T25 flasks in growth medium (Minimum
Essential Medium α (Life Technologies), supplemented with 10% FBS and 1%
Penicillin/Streptomycin) where they were cultured within a humidified 5% CO2 incubator at
37 C. Cells were seeded at concentrations of no less than 2x10⁵ cells/mL, fed at intervals not
exceeding three days by replacing 1/3 of medium with new medium, or split in a 1:3 ratio of
cell culture to fresh medium as required. For storage, flasks containing confluent cultures
were transferred to tubes, harvested by centrifugation, resuspended by 250 µL aliquots in
Recovery™ Cell Culture Freezing Medium and stored at -80 C. Dozens of lymphoblast
aliquots per individual were stored to allow for ongoing access to cultures with low passage
numbers for future use. Cells were removed from storage by thawing in a 37 C water bath,
harvested by centrifugation, resuspended in growth medium and transferred to a fresh T25
flask.
Prior to commencing experiments, lymphoblast lines were cultured over as short a time and
as few passages (2-5) as possible. For a set of triplicate, independent experiments, harvest,
assay and conduct of experiments occurred over approximately one week. As previously
two immortalized lymphoblast cell lines created from healthy donor blood were utilized as
internal controls to normalize for variation between experiments where appropriate [19].
2.4 Viable cell counts
Lymphoblast or lymphocyte (PBMC) viable counts for all applications were determined by
staining with Trypan Blue (Thermo-Fisher Scientific) prior to haemocytometer cell counting.
Trypan Blue-stained cells were counted as dead and unstained, intact cells as viable. For the
unimmortalized lymphocyte viability measurements over time, frozen aliquots were thawed
in a 37 C water bath, pelleted at 1000 x g for 2 min and resuspended in 1 mL RPMI 1640
without L-glutamine supplemented with 1X Glutamax, 10% FBS and 1%
Penicillin/Streptomycin. The cells were then washed at 1000 x g for 2 min and resuspended
in fresh medium of the same formulation. They were then seeded in 96-well U-bottom plate
at a density of 1x10⁶ cells/mL, and kept in a humidified 5% CO
2 incubator at 37 C over the
7
2.5 Mitochondrial mass and mitochondrial membrane potential (MMP)
Mitochondrial mass and MMP were assayed with modifications as previously using the
mitochondrial dyes MitoTracker® Green FM (Life Technologies) and MitoTracker® Red
CMXRos (Life Technologies) [19,23]. Both dyes bind specifically to mitochondrial membranes, MitoTracker® Red binding being membrane potential (Δψm)-dependent, while MitoTracker®
Green binding is not. Mitotracker Green fluorescence thus measures mitochondrial
membrane “mass” and Mitotracker Red provides a measurement of Δψm when normalized
to the Mitotracker Green signal.
7x10⁵ cells were harvested at 500 x g for 5 min, and 1x10⁵ cells were plated per well into 6
wells of a 96 well black, clear flat bottom plate (Corning). The plate was incubated for 1 h at
37 C with 5% CO2. To duplicate wells for each dye treatment, MitoTracker® Green and Red
were added to final concentrations of 200 nM, PBS added to background wells and Hoechst
33342 Nuclear Stain (Enzo Life Sciences) was included in every well at a final dilution of
1/2000, for normalizing under each treatment condition (excitation 355 nm, emission 455
nm). The plate was then incubated for 1 h at 37 C and 5% CO2, the supernatant removed via
aspiration and replaced with PBS. Fluorescences were read using the BMG Labtech
Clariostar microplate reader. Relative mitochondrial mass was determined by
background-subtracted MitoTracker® Green FM fluorescence at excitation 470 nm and emission 515 nm,
normalized to the background subtracted signal from the same number of cells of the
internal control cell line. The MMP was determined from the background-subtracted
MitoTracker® Red CMXRos fluorescence (excitation 570 nm, emission 620 nm) divided by
the background-subtracted fluorescence of MitoTracker® Green FM.
2.6 Mitochondrial Stress Test (Seahorse Respirometry)
Oxygen consumption rates (OCR) of 8x10⁵ viable PBMCs or lymphoblasts per well were
measured using the Seahorse XFe24 Extracellular Flux Analyzer with Seahorse XF24 FluxPaks
(Agilent Technologies). Immortalized lymphoblasts were cultured in 3 ml growth medium
per well in 6-well Costar plates prior to Seahorse experiments while PBMCs were recovered
from storage and inoculated immediately. Seahorse assays were carried out as previously
8
oligomycin (ATP synthase inhibitor), 1 M CCCP (carbonyl cyanide m-chlorophenyl
hydrazone, an uncoupling protonophore), 1 M rotenone (Complex I inhibitor) and 5 M antimycin A (Complex III inhibitor). From the resulting data we determined the OCR
associated with respiratory ATP synthesis (oligomycin-sensitive), the maximum OCR in
CCCP-uncoupled mitochondria and the rotenone-sensitive OCR attributable to uncoupled
Complex I activity, the antimycin-sensitive Complex II/III activity, the OCR by mitochondrial
functions (e.g. protein import) other than ATP synthesis that are Δψm-driven (so-called
‘proton leak’), non-respiratory oxygen consumption (e.g. by cellular and mitochondrial
oxygenases and oxidases), and the respiratory ‘spare-capacity’ (excess capacity of the
respiratory electron transport chain that is not being used in basal respiration).
2.7 Glycolytic stress test
The Extracellular Acidification Rate (ECAR) of live, intact lymphoblasts was measured using a
modified glycolytic stress test in the Seahorse XFe24 Extracellular Flux Analyzer with
Seahorse XF24 FluxPaks (Agilent Technologies). Immortalized lymphoblasts were cultured in
growth medium in 6 well plates prior to Seahorse experiments.
In order to measure the ECAR of cells using this method, they must be firmly adhered to and
evenly spread across the bottom of the assay plate wells. To achieve this, the Cell Culture
Microplate was prepared as previously described with a Matrigel coating in the bottom of
each well [19]. The plate was then left to dry at room temperature under laminar flow, and 8x10⁵ cells/well were later plated out in XF base medium (Agilent Technologies) containing
200 mM L-glutamine and 5 mM HEPES, as recommended by the manufacturer for glycolytic
assays.
The sensor cartridge apparatus was rehydrated one day in advance by adding 1 mL XF
Calibrant to each well and incubating at 37 C until needed. The injection ports of the sensor
cartridge apparatus were loaded with the following drugs, in chronological order of 4
injections to give the indicated final concentrations in the wells: glucose - 10 mM,
Oligomycin - 2 µM, Rotenone - 1 µM & Antimycin A - 5 µM (combined injection),
2-Deoxyglucose - 50 mM. The treatment with the rotenone/antimycin combination allowed
assessment of the impact of electron transport on ECAR by respiratory acidification coupled
9
Before and after each successive drug addition, the ECAR was measured over 3 time points,
consisting of a 3 min mix, 2 min wait, and 3 min measurement time. These measurements
were subsequently analysed to determine the magnitudes of various parameters of
glycolysis based on the targets of each successive drug injection.
2.8 Steady-state ATP analysis
Steady-state intracellular ATP concentration was determined by firefly luciferin
bioluminescence using the ATP Determination Kit (Invitrogen) as previously described [19].
2.9 Intracellular Reactive Oxygen Species (ROS) levels
Intracellular ROS levels were determined using the Fluorometric Intracellular ROS Kit
(MAK145-1KT, Sigma). 5x10⁵ cells were harvested per cell line at 500 x g for 5 min,
resuspended in 360 µL PBS, and 90 µL loaded into triplicate wells on a 96 well black, clear
flat bottom plate. 100 µL reaction mix prepared according to manufacturer instructions was
added to each well, the plate covered from light and incubated for 1 h at 37 C with 5% CO2.
The fluorescence was then read at excitation 520 nm emission 605 nm in the Clariostar
microplate reader as a measure of intracellular ROS. C105 was arbitrarily included as an
internal normalization control for between-experiment variation. The fluorescence is
proportional to the amount of ROS present.
2.10 Mitochondrial or EBV genome copy number
Relative mitochondrial genome copy number was determined by the amplification and
detection of two indicative mitochondrially encoded genes (mtND1 and mtND4) as
previously described [19].
Relative EBV genome copy number was determined by the amplification and detection of
two indicative EBV genes (BHRF and EBNA-1) [24] following the same qPCR method as previously described [19].
2.11 4E-BP1 phosphorylation levels (TOR activity)
TORC1 activity in ME/CFS lymphoblast lysates was measured using a Time-resolved
FRET-based multiwell plate assay of the phosphorylation state of 4E-BP1, a major TORC-1
10
2.75×10⁵ cells/mL and plated in four replicates at 5×10⁴ cells/well in a 96-well plate. Cells
were incubated at 5% CO2 / 37 C for 2 h, with two of the replicates subjected to TOR
inhibition by 0.5 µM TORIN2. Lysis buffer was added to each well as per manufacturer
instructions and the plate mixed on an orbital shaker for 40 min before plating each sample
into a 384 well white plate (Corning) - incorporating various controls and antibody mix (anti-
4E-BP1 antibody labelled with d2 acceptor, and anti-phospho-4E-BP1 antibody labelled with
Eu3+-cryptate donor) according to manufacturer instructions. After a 2 h incubation at room
temperature the plate was scanned by the Clariostar plate reader (BMG) and the ratio of the
FRET signal from phospho-4E-BP1 antibody to the donor fluorescence signal from
anti-4E-BP1 antibody was measured according to instructions. C105 cells were included as an
internal normalization control for between-experiment variation.
2.12 Western blotting
Cells were lysed in SDS loading buffer (0.125 M Tris hydrochloride, 10% glycerol, 4% SDS, 4
M urea, 10% mercaptoethanol and 0.0001% Bromophenol Blue) with a protease inhibitor
cocktail (complete EDTA-free, Roche). A small aliquot of each sample was briefly sonicated
and analysed for total protein concentration using a Qubit Protein Assay Kit and Qubit 2.0
Fluorometer (Thermo-Fisher Scientific) according to the manufacturer's instructions.
The samples were then heated to 85 C for 5 min and 30 µg of total protein was loaded into
each well in 12% SDS polyacrylamide gels. After electrophoresis, proteins were transferred
onto PVDF membranes (Amersham Hybond-P, GE Healthcare) using a Trans Blot Turbo
Blotting apparatus (Bio-Rad) for 30 min at 25 V, 1.0 A, blocked for 1 h with blocking buffer
(5% skim milk, TBS) and incubated overnight with primary antibodies (Total OXPHOS human
WB antibody cocktail, Abcam, ab110411) diluted 1:1000 in blocking buffer. This cocktail is
directed against five OXPHOS proteins. Stain-free gel scans were utilized as the internal
loading control in combination with an Alexa Fluor 800-labelled secondary antibody for
detection (Alexa Fluor 800 goat anti-mouse IgG diluted 1:1000 in TBS) (Thermo-Fisher
Scientific). Following incubation with antibodies, the membranes were washed three times
with TBS buffer containing 0.5% Tween 20, scanned with a ChemiDoc (Bio-Rad) and
analysed using the Image Lab software (Bio-Rad). Two arbitrarily selected control cell lines
(C105 and C0002, one of the study controls) were included in every blot as internal
11 2.13 Whole cell proteomics
Each sample (3x10⁶ cells in 100 µL PBS) was dried using a SpeedVac Concentrator and
Savant Refrigerated Vapor trap (Thermo-Fisher Scientific). Samples were resuspended in 8
M Urea, 100 mM Tris pH=8.3. 1 µL of TCEP (tris [2-carboxyethyl] phosphine hydrochloride,
200 mM solution in water) was then added to the samples and incubated overnight at 21 C
in a ThermoMixer (Eppendorf AG). 4 µL of 1 M IAA (iodoacetamide in water) was added the
following day and incubated in the dark at 21 C. 500 µL of 50 mM Tris (pH 8.3) and 1 μg
trypsin was then added to samples and left for 6 h at 37 C in an incubator. Another 1 μg
trypsin was added for double digestion and incubated overnight at 37 C. The digested
samples were purified for mass spectrometry analysis prior to peptide reconstitution and
separation using Sep-Pak light C18 cartridges (Waters) according to manufacturer standard
procedures. Data were collected on a Q Exactive HF (Thermo-Fisher Scientific) in Data
Dependent Acquisition mode using m/z 350–1500 as MS scan range at 60 000 resolution,
HCD MS/MS spectra were collected for the 15 most intense ions per MS scan at 15 000
resolution with a normalized collision energy of 28% and an isolation window of 1.4 m/z.
Dynamic exclusion parameters were set as follows: exclude isotope on, duration 30 s and
peptide match preferred. Other instrument parameters for the Orbitrap were MS maximum
injection time 30 ms with AGC target 3×10⁶, for a maximum injection time of 25 ms with
AGT target of 1×10⁵. Raw files consisting of high-resolution MS/MS spectra were processed
with MaxQuant version 1.6.1.0 to detect features and identify proteins using the search
engine Andromeda. UniProtKB/Swiss-Prot Homo sapiens sequence data was used as the
database for the search engine. To assess the false discovery rate (FDR) a decoy data set
was generated by MaxQuant after reversing the sequence database. Theoretical spectra
were generated using the enzyme as trypsin allowing two missed cleavages. The minimum
required peptide length used was seven amino acids. Carbamidomethylation of Cys was set
as a fixed modification, while N-acetylation of proteins and oxidation of Met were set as
variable modifications. Precursor mass tolerance was set to 5 ppm and MS/MS tolerance to
0.05 Da. The “match between runs” option was enabled in MaxQuant to transfer
12
accuracy. PSM and protein identifications were filtered using a target-decoy approach at a
false discovery rate (FDR) of 1%.
2.14 Quantification and statistical analysis
Data was analysed using Microsoft Excel with the Winstat add-in (http://www.winstat.com) or R using the packages R Commander [25], REzy [26] and stats. Proteomics data was analysed employing the software Scaffold (Proteome Software) and detected proteins were identified
as belonging to a single functional group (eg. TCA cycle) or respiratory complex using the
NCBI GO annotation database [27]. Unless otherwise specified, two-sample tests used the
Welch t-test. ANOVA and Fisher’s exact tests were used as specified and appropriate. The
significance of individual coefficients in multiple regression analysis was tested using t-tests.
The binomial test was employed to assess whether all detected proteins in a single
functional group or respiratory complex were coordinately up- or down-regulated in the
ME/CFS group compared to controls - the null hypothesis being that the levels of each
protein had a probability of 0.5 of being above the control average. The single sample t test
was also used to assess whether the average fold change in the levels of all detected
proteins in a single functional group or respiratory complex in the ME/CFS cohort was
significantly greater than the control value of 1.0.
3. Results
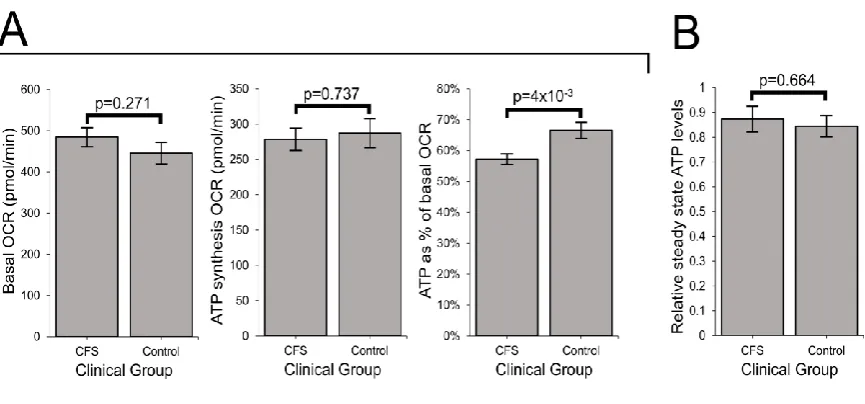
3.1 Ex vivo lymphocytes are metabolically quiescent and those from ME/CFS patients die more rapidly than controls
Whereas mitochondrial protein expression is elevated in ME/CFS saliva, lymphocytes and
platelets [11,12,28], physiological measures of respiratory function and capacity in ME/CFS lymphocyte mitochondria are reportedly reduced [6,8]. A possible explanation is that the ex vivo ME/CFS lymphocytes are more deeply quiescent (metabolism more suppressed) than
control cells. We investigated this by comparing respiration rates in immortalized
lymphocytes (lymphoblasts) from ME/CFS patients and controls with those of lymphocytes
from a subset of the same participant cohort. Although the ME/CFS lymphocytes appeared
to have smaller respiration rates than controls, the difference was not significant. The basal
respiration rates in both patient and control lymphocytes were 2 orders of magnitude lower
13
instrument (Figure 1A), as in previously reported experiments with this cell type [8]. This
confirmed that ex vivo lymphocytes from both patients and controls are in a deep state of
physiological quiescence and so perhaps not representative of metabolically active cells in
vivo.
Another potential contributor to the reported reduction in mitochondrial activity in ME/CFS
lymphocytes compared to controls, is an increased death rate in ME/CFS lymphocytes
compared to controls. We therefore assessed the viability over time of ME/CFS lymphocytes
versus healthy controls (Figure 1B). There was a dramatically greater death rate in the
ME/CFS lymphocytes than in the controls, suggesting that previously reported reductions in
ME/CFS lymphocyte mitochondrial function might have resulted from a higher fraction of Figure 1: Ex vivo lymphocytes are metabolically quiescent and ME/CFS lymphocytes die more rapidly.
14
dead cells in the assayed population. If it reflects the in vivo life span of unactivated
lymphocytes, this result would also suggest that the turnover of unactivated lymphocytes in
ME/CFS patients may be dramatically elevated.
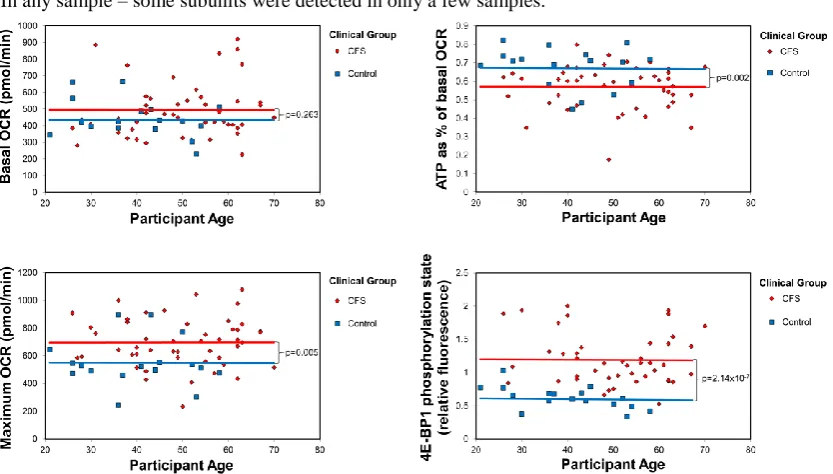
3.2 ATP synthesis by Complex V is inefficient in ME/CFS lymphoblasts
The foregoing results suggest that lymphoblasts may better reflect the function of actively
metabolizing cells in vivo, including activated leukocytes such as may be involved in
inflammatory processes in ME/CFS patients. We therefore used lymphoblasts in the
remainder of this study to investigate mitochondrial function in ME/CFS cells. Creation of
the lymphoblasts involves immortalization by EBV infection and integration of the EBV
genome into the lymphocyte genome. We therefore assayed EBV genome copy numbers (by
qPCR) and found no significant difference between patient and control groups in (Figure S3).
Furthermore, there was no effect of EBV genome copy number in either group on the
mitochondrial and cell stress-signalling parameters we measured (Pearson, Spearman rank,
and Kendall’s tau correlation coefficients, p>0.05 in all cases).
In ME/CFS lymphoblasts, basal respiration was slightly elevated and the rate of O2
consumption by ATP synthesis (oligomycin-sensitive component of basal respiration) slightly
depressed, but neither change was statistically significant. However, as a proportion of the
basal OCR, the rate of ATP synthesis by Complex V was significantly reduced (by about 15%
relative to controls) in ME/CFS lymphoblasts, indicating an inefficiency in respiratory ATP
synthesis (Figure 2A). This inefficiency of ATP synthesis specifically by Complex V implies a
15
Since the absolute rate of ATP synthesis was not significantly altered, despite the Complex V
defect, we anticipated that resting ME/CFS cells homeostatically maintain normal ATP
levels. To verify this, we assayed whole cell ATP levels and found no difference between
ME/CFS and control lymphoblasts (Figure 2B).
3.3 ME/CFS lymphoblasts exhibit elevated respiratory capacity, activity and expression of
OXPHOS complexes that are functionally normal (except for Complex V)
To achieve normal ATP synthesis rates and steady state levels, ME/CFS lymphoblasts may
compensate for the reduced efficiency of respiratory ATP synthesis by upregulating
respiratory electron transport. This was demonstrated to be the case by the increased
maximum OCR of the CCCP-uncoupled mitochondria and the main contributor to this,
uncoupled O2 consumption by Complex I (rotenone-sensitive) as well as the spare
respiratory capacity not utilized by basal respiration (Figure 3A). This elevated respiratory
capacity in ME/CFS mitochondria implies an increase in the expression, import or activity of
the proteins in these complexes and in the supporting pathways. To determine if this was
the case, we used semiquantitative western blotting on crude lysates from ME/CFS and Figure 2: ATP synthesis by Complex V is inefficient in ME/CFS lymphoblasts.
16
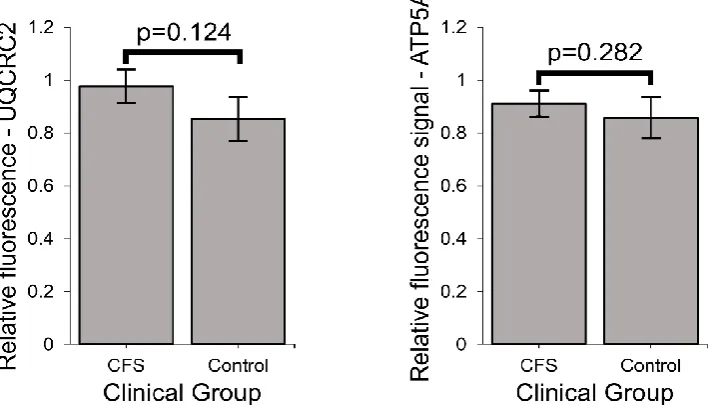
control lymphoblasts to assay the relative expression levels of indicative subunits of each of
the 5 mitochondrial respiratory complexes. We found significant increases in the levels of
Complex I, II, and IV subunits by semiquantitative western blotting (Figure 3B). Smaller
increases in the levels of subunits in the other complexes (III, V) were not statistically
significant (Figure S4).
These results suggest that in ME/CFS cells the expression of the respiratory complexes is
homeostatically increased to compensate for inefficient ATP synthesis. To test this
hypothesis further, we conducted whole cell proteomics analysis of 16 control and 22
patient lymphoblast cell lines. For several of the individual subunits of both Complexes I and
V, the measured increase in expression of that subunit alone exceeded the threshold for
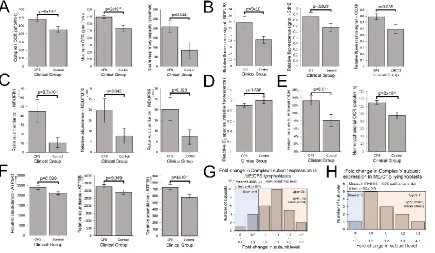
statistical significance (Figure 3C, Figure 3F). Thirty-one of the 44 Complex I subunits were
detected, 26 of these in more than 5 samples and most exhibited increases in their levels in
ME/CFS cells compared to the controls (Figure 3G, Table A1), significantly more than would
be expected by chance. The average expression of the Complex I subunits in ME/CFS cells
was significantly higher than in the controls (1.48 fold, p=6.3 x 10⁻³). Eleven of the 12
Complex V subunits were upregulated, a significantly higher fraction than would be
expected by chance (Figure 3H, Table A1). Average expression levels were also significantly
elevated for the subunits of Complex V (1.1 fold, p=3.0x10⁻³). Similar results for both
complexes were found when the t test included only subunits detected in more than 5
samples (Table A1). Taking into account this 10% higher expression of Complex V subunits,
the relative inefficiency of Complex V in the ME/CFS cells is even greater than measured
directly by respirometry - almost 25% lower than the controls.
The expression of subunits of the other respiratory complexes was also higher in ME/CFS
lymphoblasts in our proteomics analysis, but the increases did not reach statistically
significant levels (Table A1). Although the small number of Complex II subunits did not
provide sufficient statistical power to detect significant upregulation in this kind of test, the
levels of each of the detected subunits appeared to be elevated, consistent with the
significant increase detected by western blotting. Together, these results show that the
levels of the key mitochondrial OXPHOS proteins are elevated in ME/CFS cells, thereby
17
Electron flow from Complex I through Complexes III and IV is the major contributor to
respiratory electron transport, the contribution from Complex II in these cells being very
small [19]. Having observed that Complex V was functioning inefficiently, contributing a smaller fraction to the basal respiration rate in ME/CFS cells than in control cells, we
determined whether Complexes I, III and IV were functioning normally.
In contrast with the fractional contribution of Complex V to basal respiration, we found that
the fractional O2 consumption by uncoupled electron flow from Complex I through
Complexes III and IV to molecular oxygen was unchanged in ME/CFS cells (Figure S5). Thus
electron transport is functionally normal in ME/CFS cells and the inefficiency in oxidative
phosphorylation is isolated to ATP synthesis by Complex V. This can be concluded since a
defect in Complex I, III or IV would result in the electron flow through these complexes
contributing proportionately less to total OCR, even if compensatory upregulation of
expression were to bring respiration rates back to normal or even higher than normal
absolute levels. We conclude that electron transport in the ME/CFS cells is functionally
normal, but elevated in capacity because of elevated levels of expression of the respiratory
complex proteins involved.
Another indicator of abnormalities in electron transport is the level of Reactive Oxygen
Species (ROS). ROS are produced by electron “leakage” to molecular oxygen at the point
where electrons are normally passed to Complex III from either Complex I or II. ROS
production can be increased either by an increased flux of electrons through the electron
transport chain or by a “downstream” blockage that diverts the electron flow. We therefore
measured the levels of ROS in patient and control cells and found no change in intracellular
ROS levels in ME/CFS lymphoblasts when compared with controls (Figure 3D). This is
consistent with the insignificant changes in basal respiration rate and also suggests that the
18
The compensatory elevation of expression and activity of mitochondrial respiratory
complexes shown by our data suggests that ME/CFS mitochondria should exhibit increased
rates of proton motive force (PMF)-driven transport processes in the mitochondrial
membrane that support and maintain mitochondrial biogenesis and function. For example,
the levels of key proteins in the mitochondrial protein import complexes were elevated in
Figure 3: ME/CFS lymphoblasts exhibit elevated respiratory capacity and expression of OXPHOS complexes.
Error bars are standard errors of the mean. (A) Complex I OCR, maximum OCR and spare respiratory capacity are elevated in ME/CFS lymphoblasts (independent t-test). The OCR was measured in lymphoblasts from ME/CFS and control individuals by the Seahorse XFe24 Extracellular Flux Analyser. Each ME/CFS (n=50) and control (n=22) cell line was assayed over four replicates in each of at least three independent experiments. (B) Relative expression levels of Complex I subunit NDUFB8, Complex II subunit SdhB and Complex IV subunit COXII were elevated in semiquantitative western blots (independent t-test). Each ME/CFS (n=48) and control (n=17) cell line was assayed in at least three independent experiments. (C) Complex I subunits NDUFB1, NDUFB10, and NDUFS5 were significantly upregulated (iBAQ) in whole cell proteomes (independent t-test). Each ME/CFS (n=22) and control (n=16) cell line was sampled once. (D) Intracellular ROS levels (relative background-subtracted Deep Red fluorescence) are unchanged in ME/CFS lymphoblasts (independent t-test). Each ME/CFS (n=49) and control (n=22) cell line was assayed in duplicate within each of at least three independent experiments. (E) Proton Leak as % of basal OCR and the nonmitochondrial OCR are elevated in ME/CFS lymphoblasts (independent
19
the ME/CFS proteomes, as were the levels of multiple SLC25 transporters in the inner
mitochondrial membrane (Figure S6). Such supporting transport pathways contribute to the
so-called “proton leak”, which refers to depletion of the PMF by mitochondrial transport
processes other than ATP synthesis by Complex V. The proton leak was significantly elevated
as a proportion of the basal metabolic rate (Figure 3E) in ME/CFS lymphoblasts when
compared with controls.
The foregoing data indicates that mitochondrial respiratory capacity in ME/CFS
lymphoblasts is upregulated, presumably in response to inefficient ATP synthesis. This is
coupled with increased depletion of energy by transport processes which we hypothesized
would include those that provide oxidizable substrates to the mitochondria. We therefore
expect the rates of nonmitochondrial catabolic processes that provide these substrates also
to be increased. Our data supports such a shift in metabolism as the “nonmitochondrial”
OCR, an indicator of catabolic rate, was significantly elevated in ME/CFS lymphoblasts
20
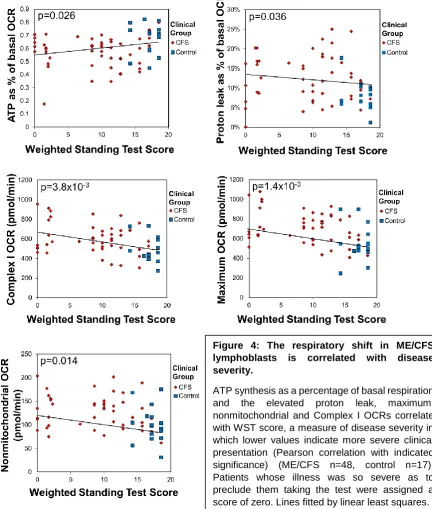
3.4 Mitochondrial abnormalities in ME/CFS lymphoblasts are correlated with disease
severity
In view of the foregoing functional abnormalities in ME/CFS mitochondria, we tested the
key elevated parameters (Figure 4) for correlation with disease severity as assessed by the
Richardson and Lidbury Weighted Standing Test [22]. We found that all were correlated with
the clinical outcomes. This provides strong evidence for the idea that the mitochondrial
abnormalities we found are clinically relevant.
Figure 4: The respiratory shift in ME/CFS lymphoblasts is correlated with disease severity.
21
3.5 Mitochondrial genome copy number and mass per cell are unchanged in ME/CFS lymphoblasts, but mitochondrial membrane potential is elevated
Mitochondrial mass as a measure refers to total mitochondrial membrane within the cell’s
dynamic network of mitochondria [29], whilst membrane potential is the charge gradient across the inner mitochondrial membrane – which constitutes part of the total PMF, driving
ATP synthesis by Complex V (ATP synthase). Since the expression of mitochondrial proteins
is upregulated in ME/CFS lymphoblasts, it was possible that this would be reflected in an
increase in the total cellular mitochondrial content. To assess this, we have assayed both the
mitochondrial genome content relative to the nuclear genome, as well as the mitochondrial
membrane “mass” per cell and observed no differences between ME/CFS and control
lymphoblasts (Figure 5A). This suggests that the ME/CFS mitochondria contain a higher
concentration of mitochondrial respiratory proteins than control cells.
The inefficiency of ATP synthesis by Complex V means that basal respiration rates by
ME/CFS mitochondria would also be reduced, were it not for the compensatory
upregulation of their respiratory complex levels. This allows them to maintain normal ATP
synthesis rates and, as observed, is accompanied by increased respiratory capacity of the
electron transport chain (mostly Complex I activity). This would result in excess proton
pumping capacity relative to the combined requirements of ATP synthesis by Complex V and
the “proton leak”. The expected outcome of this elevated spare respiratory capacity would
22
confirmed by examining the ratio of MitoTracker® Red to MitoTracker® Green fluorescence
in ME/CFS lymphoblasts (Figure 5B).
3.6 Glycolysis is unaffected in ME/CFS lymphoblasts, but levels of enzymes involved in fatty acid β-oxidation and the TCA cycle are elevated
Published metabolomics work suggests that ME/CFS metabolism is dysregulated such that
the provision of acetyl CoA to the TCA cycle by glycolytic pyruvate is reduced and there is
instead a shift away from carbohydrate metabolism towards alternative oxidisable
substrates [14]. Other work suggests that glycolysis itself is unimpaired and that reduced
conversion of pyruvate to acetyl CoA by PDH is responsible for a similar downstream
consequence [15]. However, Tomas et al. (2017) found no difference in glycolysis between
lymphocytes from ME/CFS and control individuals, while Nguyen et al. (2018) reported a
reduction in glycolytic capacity in a small sample of NK cells from ME/CFS patients. To
investigate glycolysis in intact ME/CFS lymphoblasts, we modified and implemented an
optimized Seahorse assay to assess real-time glycolytic production of lactate in live cells by Figure 5: Mitochondrial genome copy number and mass per cell are unchanged in ME/CFS lymphoblasts, but mitochondrial membrane potential is elevated.
23
measuring the extracellular acidification rate (ECAR) of the medium. We found no difference
between ME/CFS and control cells in glycolytic rate, reserve or capacity (Figure 6A).
Previous metabolomic studies have suggested that lipid metabolism is dysregulated in
ME/CFS [14,30-32]. Since the elevated “proton leak” and “nonmitochondrial” OCR were consistent with an increase in mitochondrial uptake and catabolism of alternative oxidizable
substrates, we investigated the expression of mitochondrial fatty acid transporters and
enzymes responsible for fatty acid β-oxidation in whole cell proteomes of ME/CFS and
control lymphoblasts. We found proteins in both groups to be significantly elevated in the
ME/CFS cells (Figure 6B, C). The levels of all three fatty acid transport proteins, carnitine Figure 6: Glycolysis rates are unaffected in ME/CFS lymphoblasts, but levels of enzymes involved in fatty acid β-oxidation and the TCA cycle are elevated
24
acyltransferase I and II as well as the acyl carnitine carrier protein, were elevated, although
this reached statistical significance only in the case of carnitine acyl transferase II.
Furthermore, 17 of 20 proteins involved in mitochondrial oxidation were upregulated (binomial test, p=2.6x10⁻³), with average levels 23+13% higher than controls (t test,
p=9.4x10⁻⁴). All 6 of the central enzymes in the mitochondrial oxidation cycle were
upregulated (binomial test, p=0.016) and the level of one of these (enoyl-CoA hydratase)
was significantly elevated on its own. If the rates of mitochondrial oxidation were elevated in ME/CFS cells in accordance with the expression of the proteins involved, these pathways
would provide acetyl CoA to the TCA cycle at faster rate. In keeping with this, we found that
the expression of TCA cycle proteins was also elevated in ME/CFS cells (Figure 6D). Thus, 16
of 19 detected proteins involved in the TCA cycle were more abundant in the ME/CFS
proteome (binomial test, p=2.2x10⁻³). The mean expression level of TCA cycle proteins in
ME/CFS lymphoblasts was 17+10% higher than in control cells (t test, p=1.0x10⁻³). Taken
together, these results show that ME/CFS lymphoblasts have an increased capacity for using
mitochondrial oxidation to drive oxidative phosphorylation at rates faster than would otherwise have been the case.
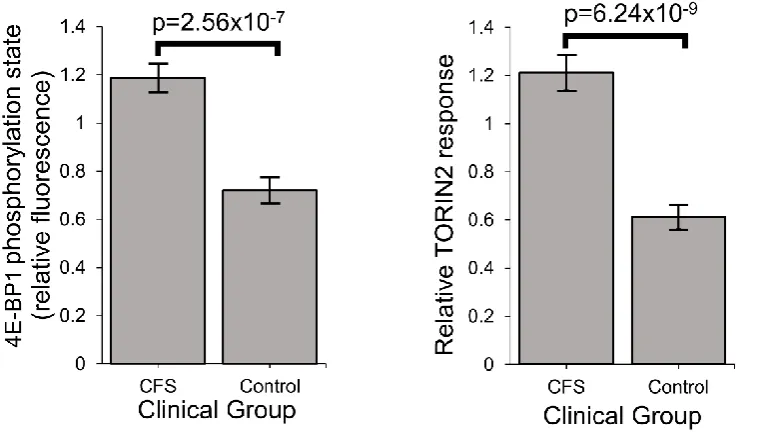
3.7 Stress-sensing pathways in ME/CFS are perturbed – TORC1 is chronically hyperactivated
The compensatory action to bring ATP levels back to normal in ME/CFS lymphoblasts
despite Complex V’s inefficiency is likely to be driven by the signaling networks that sense
andhomeostatically respond to diverse cellular stresses [33-38]. A central element in these pathways, interconnected with all of the others is the protein kinase, TORC1 (Target of
Rapamycin Complex I), which coordinates the translational upregulation of major functional
groups of proteins, including nuclear-encoded mitochondrial proteins. We measured its
activity in ME/CFS and control lymphoblasts by assaying the phosphorylation state of one of
its key substrates,4E-BP1 (Eukaryotic translation initiation factor 4E-Binding protein 1) [39]. 4E-BPs are phosphorylated by TORC1, whose catalytic subunit is mTOR (mechanistic Target
Of Rapamycin). Together with S6 kinase (S6K), 4E-BP1 mediates the roles of TORC1 in
regulating translation in the cytosol of mRNAs encoding major functional groups of proteins
[40-42]. As one of the key substrates of TORC1 involved in regulating protein synthesis,
25
levels were significantly elevated in ME/CFS lymphoblasts and were accompanied by a
correspondingly increased response to the mTOR inhibitor, Torin2 (Figure 7). This chronic
elevation of TORC1 activity could explain the increased expression of mitochondrial proteins
and respiratory capacity that we found in ME/CFS lymphoblasts [39,43].
4. Discussion
Previous steady state measurements and metabolic flux measurements of mitochondrial
respiratory function in ME/CFS lymphocytes have suggested that in ME/CFS cells there is a
generalized reduction in mitochondrial activity and respiratory capacity [6-8]. Paradoxically,
functionally normal OXPHOS complex I to IV activity [10,44] and elevated nonmitochondrial
ATP production [10] have also been reported in ME/CFS lymphocytes, while the expression
of mitochondrial proteins is reportedly upregulated in patient saliva, platelets and
lymphocytes [11,12,28].
In this work we have resolved these inconsistencies by revisiting the issue of mitochondrial
function and capacity in immortalized lymphocytes (lymphoblasts). As we showed here,
unactivated ex vivo lymphocytes are quiescent and dying, so that a difference between Figure 7: Stress sensing pathways in ME/CFS are perturbed – TORC1 is chronically hyperactivated.
26
patient and control groups in the depth of this quiescence and/or the rate of cell death can
explain the previously reported reduction in mitochondrial activities in ME/CFS
lymphocytes. We found that ME/CFS lymphocytes die at a dramatically faster rate in culture
medium than control lymphocytes. It is likely that in previous studies, the ME/CFS
lymphocytes assayed for mitochondrial activity included a higher proportion of dead cells
than did the controls. The greater mortality rates for ME/CFS lymphocytes are not surprising
given that pharmacological inhibition of mitochondrial respiration, including Complex V
impairment, has long been known to result in apoptotic cell death in ex vivo lymphoid cells
[45].
By contrast, the lymphoblasts used in this work are metabolically active lymphoid cells that
may better represent activated lymphocytes, which drive neuroinflammation in vivo[46].
Our results showed that ME/CFS lymphoblasts exhibit an isolated Complex V inefficiency
that is accompanied by upregulation of mitochondrial protein expression, including
mitochondrial respiratory complexes and enzymes involved in the TCA cycle, fatty acid
uptake and -oxidation. These findings confirm that ME/CFS cells do indeed exhibit a mitochondrial deficiency in ATP generation, but reveal that this specifically involves
Complex V rather than a generalized reduction in all mitochondrial functions. This profile of
mitochondrial dysfunction in intact ME/CFS lymphoblasts is distinct from that which we
previously found in Parkinson’s Disease lymphoblasts [19], so cannot be a simple reflection of neuroinflammatory processes believed to occur in both diseases.
What might cause such a mitochondrial Complex V inefficiency? Three possibilities are a
mutation affecting one of the Complex V subunits or assembly proteins, a dysregulation of
Complex V, or an elevation of the relative use of the proton motive force for other purposes
(“proton leak”) making less available for ATP synthesis. A mutational defect in Complex V
seems unlikely in view of the failure of previous investigations to uncover any single
nucleotide polymorphisms in Complex V genes that associate with the disease state [47,48]. Dysregulatory inhibition of Complex V is a second possibility. It is known that mitochondrial
ATP synthase activity can be regulated by a variety of proteins, small molecules and
signalling pathways, some of them by acting through Complex V’s own inhibitory subunit
27
proton leak we measured in ME/CFS lymphocytes. However, the ME/CFS mitochondria have
excess unused respiratory capacity and an elevated proton motive force. These would
suggest that the membrane potential and electron transport capacity in ME /CFS cells are
more than sufficient to allow Complex V to operate at normal efficiency. These possible
causes for Complex V inefficiency in ME/CFS mitochondria should be investigated in future
work.
The elevated maximum respiratory capacity, mitochondrial Complex I activity, and proton
leak we found in ME/CFS lymphoblasts are consistent with the higher mitochondrial protein
expression we observed in these cells, as assayed using both semiquantitative western blots
and whole cell proteomics. Consistent with this, it was reported previously that
mitochondrial proteins are upregulated in the ME/CFS proteomes of saliva, lymphocytes,
and platelets [11,12,28], while increased translocase activity into the mitochondrial matrix
has also been reported [7]. Together our results suggest a model in which the Complex V defect is a proximal activator of compensatory upregulation of expression of mitochondrial
proteins.
The increased levels of diverse mitochondrial proteins in ME/CFS cells suggests the
possibility that mitochondrial biogenesis more broadly is activated in these cells. However,
we found that the mitochondrial membrane “mass” per cell (Mitotracker Green
fluorescence) and the copy number of the mitochondrial genome relative to the nuclear
genome were unchanged. Accordingly, the ME/CFS mitochondria appear to have higher
concentrations of mitochondrial respiratory proteins and catabolic enzymes.
One of the key upstream regulators of mitochondrial protein expression is TOR Complex I
(TORC1 whose catalytic subunit is mTOR, the mechanistic Target Of Rapamycin). We found
that TORC1 activity is elevated in ME/CFS cells. The expression of mitochondrial enzymes
involved in electron transport is known to be upregulated by TORC1 via selective activation
of translation via inhibitory phosphorylation of the TORC1 target 4E-BP1 [18]. In addition to its actions on the translation of nuclear-encoded mitochondrial proteins, TORC1 upregulates
the expression of transcription factors PGC-1 (transcriptionally via Yin Yang 1) and TFAM (translationally), which respectively induce the transcription of nuclear and mitochondrial
28
proteins whose translation is upregulated by TORC1 are nuclear-encoded subunits of
Complexes I and V [18], the two respiratory complexes whose expression we found to be the most evidently elevated in the whole cell proteomes of ME/CFS lymphoblasts.
Mitochondrial enzymes involved in the oxidation of fatty acids are amongst the many
proteins whose expression is upregulated by PGC1 and thus indirectly by TORC. Fatty acid
oxidation provides acetyl CoA to the TCA cycle, as does glycolysis, but it yields more ATP
per oxidized carbon than does glycolysis. This also makes thermodynamic sense, given the
more highly reduced state of the carbons in fatty acid chains compared to those in sugar
molecules. ME/CFS cells could shift their metabolism in favour of fatty acid oxidation because of a deficiency in glycolysis [14] or pyruvate dehydrogenase which partially oxidizes
pyruvate and supplies acetyl CoA to the TCA cycle [15]. It has also been suggested that in
ME/CFS cells metabolism shifts away from glycolysis in favour of the pentose phosphate
pathway which can oxidize sugars in the cytosol to generate reducing power that can be
transported into the mitochondria to drive electron transport [31]. Our results support the existence of such a metabolic shift, but we found no deficiency in glycolysis rates, glycolytic
reserve or glycolytic capacity. Although there have been reports of reduced rates of
glycolysis in ME/CFS lymphocytes [51], this contrasts with reports by others [8]. Instead of reduced glycolytic capacity driving the shift in metabolism, our results suggest that the
change may be driven by elevated usage of alternatives such as the oxidation of fatty acids. Fatty acid utilization rates were previously reported to be unchanged in permeabilized
ME/CFS lymphocytes [44]. However, the permeabilization process (with loss of cytoplasmic cellular context eg metabolites) or the metabolic quiescence and greater death rates of
ME/CFS lymphocytes may have obscured the result in this previous study. It would be
valuable in future experiments to measure fatty acid utilization rates in ME/CFS and control
lymphoblasts.
TORC1 is not the only cellular stress sensing protein that regulates expression of proteins
involved in cellular metabolism and mitochondrial function. It acts in concert with AMPK as
part of a complex stress-sensing network [34,38]. AMPK is activated by a variety of cellular stressors including ATP insufficiency, elevated cytosolic Ca2+ concentrations and oxidative
stress [52,53]. As the primary ATP sensor [54], AMPK is implicated in mitochondrial disease
29
substrates to the mitochondria - including amino acids or fatty acids [56]. In ME/CFS cells, with their chronically inefficient ATP synthesis, AMPK is expected to be chronically activated
and participate in the compensatory upregulation of mitochondrial respiratory capacity that
we observe. However, despite lower steady state ATP levels, the AMPK activation state was
not significantly different between cultured muscle cells from CFS patients (Fukuda criteria)
and healthy controls [57]. Future work should therefore test the hypothesis that AMPK is chronically activated in ME/CFS lymphoblasts.
5. Conclusions
Our results show that in ME/CFS lymphoblasts, there is an isolated Complex V inefficiency in
ATP synthesis at the final step in mitochondrial oxidative phosphorylation. This is
accompanied by multiple homeostatic compensations, including increased respiratory
capacity, Complex V expression and capacity for fatty acid oxidation. Together, these compensatory changes appear to be sufficient to meet the normal needs of active
metabolism despite the inefficiency of ATP synthesis by Complex V. Thus, the steady state
ATP levels and absolute ATP synthesis rates were both close to normal in ME/CFS cells.
However, this may leave cells less able to respond to further acute increases in ATP
demand, because the signaling and metabolic pathways involved are already chronically
upregulated. AMPK activity in muscle cells cultured from CFS patients (Fukuda criteria) is
reportedly unresponsive to electrical pulse-induced contraction in vitro, but not because
AMPK itself is unresponsive to activation by either a mitochondrial Complex I inhibitor
(metformin) or a direct AMPK activator (compound 991) [57,58]. The authors suggested that the unresponsiveness of CFS cells to additional energy demands thus seems to lie
elsewhere. One possibility is the already elevated TORC1 activity, since TORC1 is an inhibitor
of upstream pathways that activate AMPK. In any case, this “cellular chronic fatigue” may
contribute to the unexplained fatigue experienced by ME/CFS patients, as suggested by the
fact that all of the mitochondrial abnormalities we observed were correlated with the
severity of patient symptoms measured by the Weighted Standing Time. These correlations
also verify that the mitochondrial abnormalities we have found are of clinical relevance to
30
Acknowledgements
We are grateful to the Mason Foundation, the McCusker Foundation and individual patients
and supporters who funded this work. DM was the recipient of a La Trobe University
Postgraduate Scholarship and Australian Government Research Training Program Fees
Offset. We thank Edwina Privitera who assisted with patient recruitment and collection of
blood samples. The proteomics experiment was performed by Pierre Faou in the La Trobe
Comprehensive Proteomics Platform. Our heartfelt thanks go to patients and their families
and the healthy control volunteers whose participation made this study possible.
This paper is dedicated to one of our coauthors and a long-time advocate and carer for
ME/CFS patients, Dr. Donald P. Lewis, who sadly passed away during the revision of this
manuscript. Valé Don! Your lifetime achievements and contributions to the lives of ME/CFS
patients will not be forgotten.
Author Contributions
DM performed most of the experiments and prepared the initial manuscript draft. DM and
PRF performed the data analysis. OA and CYA performed western blotting and assisted with
other experiments. BAL and DPL performed the clinical examination, including the Weighted
Standing Time tests. PRF and SJA conceived and supervised the project. All authors assisted
with manuscript preparation.
Competing Interests
The authors have no competing interests to declare.
References
1. Carruthers, B.M.; van de Sande, M.I.; De Meirleir, K.L.; Klimas, N.G.; Broderick, G.; Mitchell, T.; Staines, D.; Powles, A.C.; Speight, N.; Vallings, R., et al. Myalgic encephalomyelitis: International Consensus Criteria. J Intern Med 2011, 270, 327-338, doi:10.1111/j.1365-2796.2011.02428.x.
2. Afari, N.; Buchwald, D. Chronic fatigue syndrome: a review. Am J Psychiatry 2003, 160, 221-236, doi:10.1176/appi.ajp.160.2.221.
31
4. Smits, B.; van den Heuvel, L.; Knoop, H.; Kusters, B.; Janssen, A.; Borm, G.; Bleijenberg, G.; Rodenburg, R.; van Engelen, B. Mitochondrial enzymes discriminate between mitochondrial disorders and chronic fatigue syndrome. Mitochondrion 2011, 11, 735-738,
doi:10.1016/j.mito.2011.05.005.
5. O'Neill, H.M.; Maarbjerg, S.J.; Crane, J.D.; Jeppesen, J.; Jorgensen, S.B.; Schertzer, J.D.; Shyroka, O.; Kiens, B.; van Denderen, B.J.; Tarnopolsky, M.A., et al. AMP-activated protein kinase (AMPK) beta1beta2 muscle null mice reveal an essential role for AMPK in maintaining mitochondrial content and glucose uptake during exercise. Proc Natl Acad Sci U S A 2011, 108, 16092-16097, doi:10.1073/pnas.1105062108.
6. Myhill, S.; Booth, N.E.; McLaren-Howard, J. Chronic fatigue syndrome and mitochondrial dysfunction. Int J Clin Exp Med 2009, 2, 1-16.
7. Booth, N.E.; Myhill, S.; McLaren-Howard, J. Mitochondrial dysfunction and the
pathophysiology of Myalgic Encephalomyelitis/Chronic Fatigue Syndrome (ME/CFS). Int J Clin Exp Med 2012, 5, 208-220.
8. Tomas, C.; Brown, A.; Strassheim, V.; Elson, J.L.; Newton, J.; Manning, P. Cellular
bioenergetics is impaired in patients with chronic fatigue syndrome. PLoS One 2017, 12, e0186802, doi:10.1371/journal.pone.0186802.
9. Vermeulen, R.C.; Kurk, R.M.; Visser, F.C.; Sluiter, W.; Scholte, H.R. Patients with chronic fatigue syndrome performed worse than controls in a controlled repeated exercise study despite a normal oxidative phosphorylation capacity. J Transl Med 2010, 8, 93,
doi:10.1186/1479-5876-8-93.
10. Lawson, N.; Hsieh, C.H.; March, D.; Wang, X. Elevated Energy Production in Chronic Fatigue Syndrome Patients. J Nat Sci 2016, 2.
11. Kaushik, N.; Fear, D.; Richards, S.C.; McDermott, C.R.; Nuwaysir, E.F.; Kellam, P.; Harrison, T.J.; Wilkinson, R.J.; Tyrrell, D.A.; Holgate, S.T., et al. Gene expression in peripheral blood mononuclear cells from patients with chronic fatigue syndrome. J Clin Pathol 2005, 58, 826-832, doi:10.1136/jcp.2005.025718.
12. Ciregia, F.; Kollipara, L.; Giusti, L.; Zahedi, R.P.; Giacomelli, C.; Mazzoni, M.R.; Giannaccini, G.; Scarpellini, P.; Urbani, A.; Sickmann, A., et al. Bottom-up proteomics suggests an association between differential expression of mitochondrial proteins and chronic fatigue syndrome. Transl Psychiatry 2016, 6, e904, doi:10.1038/tp.2016.184.
13. Nelson, C.; Ambros, V.; Baehrecke, E.H. miR-14 regulates autophagy during developmental cell death by targeting ip3-kinase 2. Mol Cell 2014, 56, 376-388,
doi:10.1016/j.molcel.2014.09.011.
14. Armstrong, C.W.; McGregor, N.R.; Lewis, D.; Butt, H.; Gooley, P.R. Metabolic profiling reveals anomalous energy metabolism and oxidative stress pathways in chronic fatigue syndrome patients. Metabolomics 2015, 11, 1626–1639.
15. Fluge, O.; Mella, O.; Bruland, O.; Risa, K.; Dyrstad, S.E.; Alme, K.; Rekeland, I.G.; Sapkota, D.; Rosland, G.V.; Fossa, A., et al. Metabolic profiling indicates impaired pyruvate
dehydrogenase function in myalgic encephalopathy/chronic fatigue syndrome. JCI Insight
2016, 1, e89376, doi:10.1172/jci.insight.89376.
16. Loewith, R.; Hall, M.N. Target of rapamycin (TOR) in nutrient signaling and growth control. Genetics 2011, 189, 1177-1201, doi:10.1534/genetics.111.133363.
17. Cunningham, J.T.; Rodgers, J.T.; Arlow, D.H.; Vazquez, F.; Mootha, V.K.; Puigserver, P. mTOR controls mitochondrial oxidative function through a YY1-PGC-1alpha transcriptional
complex. Nature 2007, 450, 736-740, doi:10.1038/nature06322.
18. Morita, M.; Gravel, S.P.; Hulea, L.; Larsson, O.; Pollak, M.; St-Pierre, J.; Topisirovic, I. mTOR coordinates protein synthesis, mitochondrial activity and proliferation. Cell Cycle 2015, 14, 473-480, doi:10.4161/15384101.2014.991572.
32
have enhanced mitochondrial respiratory activity. Dis Model Mech 2016, 9, 1295-1305, doi:10.1242/dmm.025684.
20. Loesch, D.Z.; Annesley, S.J.; Trost, N.; Bui, M.Q.; Lay, S.T.; Storey, E.; De Piazza, S.W.; Sanislav, O.; Francione, L.M.; Hammersley, E.M., et al. Novel Blood Biomarkers Are Associated with White Matter Lesions in Fragile X- Associated Tremor/Ataxia Syndrome. Neurodegener Dis 2017, 17, 22-30, doi:10.1159/000446803.
21. Carruthers, B.M.; Jain, A.K.; De Meirleir, K.L.; Peterson, D.L.; Klimas, N.G.; Lerner, A.M.; Bested, A.C.; Flor-Henry, P.; Joshi, P.; Powles, A.C., et al. Myalgic Encephalomyelitis/Chronic Fatigue Syndrome: Clinical Working Case Definition, Diagnostic and Treatment Protocols. Journal of Chronic Fatigue Syndrome, 2003, 11, 7-36.
22. Richardson, A.M.; Lewis, D.P.; Kita, B.; Ludlow, H.; Groome, N.P.; Hedger, M.P.; de Kretser, D.M.; Lidbury, B.A. Weighting of orthostatic intolerance time measurements with standing difficulty score stratifies ME/CFS symptom severity and analyte detection. J Transl Med
2018, 16, 97, doi:10.1186/s12967-018-1473-z.
23. Pendergrass, W.; Wolf, N.; Poot, M. Efficacy of MitoTracker Green and CMXrosamine to measure changes in mitochondrial membrane potentials in living cells and tissues. Cytometry A 2004, 61, 162-169, doi:10.1002/cyto.a.20033.
24. Lay, M.L.; Lucas, R.M.; Ratnamohan, M.; Taylor, J.; Ponsonby, A.L.; Dwyer, D.E.; Ausimmune Investigator, G. Measurement of Epstein-Barr virus DNA load using a novel quantification standard containing two EBV DNA targets and SYBR Green I dye. Virol J 2010, 7, 252, doi:10.1186/1743-422X-7-252.
25. Fox, J. The R commander: a basic-statistics graphical user interface to R. J. Stat. Software
2005, 14, 1-42, doi:10.10.18637/jss.v014.i09.
26. Kanda, Y. Investigation of the freely available easy-to-use software 'EZR' for medical statistics. Bone Marrow Transplant 2013, 48, 452-458, doi:10.1038/bmt.2012.244.
27. Harris, M.A.; Clark, J.; Ireland, A.; Lomax, J.; Ashburner, M.; Foulger, R.; Eilbeck, K.; Lewis, S.; Marshall, B.; Mungall, C., et al. The Gene Ontology (GO) database and informatics resource. Nucleic Acids Res 2004, 32, D258-261, doi:10.1093/nar/gkh036.
28. Vernon, S.D.; Whistler, T.; Cameron, B.; Hickie, I.B.; Reeves, W.C.; Lloyd, A. Preliminary evidence of mitochondrial dysfunction associated with post-infective fatigue after acute infection with Epstein Barr virus. BMC Infect Dis 2006, 6, 15, doi:10.1186/1471-2334-6-15. 29. Bereiter-Hahn, J.; Voth, M. Dynamics of mitochondria in living cells: shape changes,
dislocations, fusion, and fission of mitochondria. Microsc Res Tech 1994, 27, 198-219, doi:10.1002/jemt.1070270303.
30. Nagy-Szakal, D.; Barupal, D.K.; Lee, B.; Che, X.; Williams, B.L.; Kahn, E.J.R.; Ukaigwe, J.E.; Bateman, L.; Klimas, N.G.; Komaroff, A.L., et al. Insights into myalgic
encephalomyelitis/chronic fatigue syndrome phenotypes through comprehensive metabolomics. Sci Rep 2018, 8, 10056, doi:10.1038/s41598-018-28477-9.
31. Germain, A.; Ruppert, D.; Levine, S.M.; Hanson, M.R. Metabolic profiling of a myalgic encephalomyelitis/chronic fatigue syndrome discovery cohort reveals disturbances in fatty acid and lipid metabolism. Mol Biosyst 2017, 13, 371-379, doi:10.1039/c6mb00600k. 32. Naviaux, R.K.; Naviaux, J.C.; Li, K.; Bright, A.T.; Alaynick, W.A.; Wang, L.; Baxter, A.; Nathan,
N.; Anderson, W.; Gordon, E. Metabolic features of chronic fatigue syndrome. Proc Natl Acad Sci U S A 2016, 113, E5472-5480, doi:10.1073/pnas.1607571113.
33. Carling, D.; Mayer, F.V.; Sanders, M.J.; Gamblin, S.J. AMP-activated protein kinase: nature's energy sensor. Nat Chem Biol 2011, 7, 512-518, doi:10.1038/nchembio.610.
33
35. Hardie, D.G. Adenosine monophosphate-activated protein kinase: a central regulator of metabolism with roles in diabetes, cancer, and viral infection. Cold Spring Harb Symp Quant Biol 2011, 76, 155-164, doi:10.1101/sqb.2011.76.010819.
36. Hindupur, S.K.; Gonzalez, A.; Hall, M.N. The opposing actions of target of rapamycin and AMP-activated protein kinase in cell growth control. Cold Spring Harb Perspect Biol 2015, 7, a019141, doi:10.1101/cshperspect.a019141.
37. Reznick, R.M.; Shulman, G.I. The role of AMP-activated protein kinase in mitochondrial biogenesis. J Physiol 2006, 574, 33-39, doi:10.1113/jphysiol.2006.109512.
38. Zong, H.; Ren, J.M.; Young, L.H.; Pypaert, M.; Mu, J.; Birnbaum, M.J.; Shulman, G.I. AMP kinase is required for mitochondrial biogenesis in skeletal muscle in response to chronic energy deprivation. Proc Natl Acad Sci U S A 2002, 99, 15983-15987,
doi:10.1073/pnas.252625599.
39. Ma, X.M.; Blenis, J. Molecular mechanisms of mTOR-mediated translational control. Nat Rev Mol Cell Biol 2009, 10, 307-318, doi:10.1038/nrm2672.
40. Dowling, R.J.; Topisirovic, I.; Alain, T.; Bidinosti, M.; Fonseca, B.D.; Petroulakis, E.; Wang, X.; Larsson, O.; Selvaraj, A.; Liu, Y., et al. mTORC1-mediated cell proliferation, but not cell growth, controlled by the 4E-BPs. Science 2010, 328, 1172-1176,
doi:10.1126/science.1187532.
41. Hsieh, A.C.; Costa, M.; Zollo, O.; Davis, C.; Feldman, M.E.; Testa, J.R.; Meyuhas, O.; Shokat, K.M.; Ruggero, D. Genetic dissection of the oncogenic mTOR pathway reveals druggable addiction to translational control via 4EBP-eIF4E. Cancer Cell 2010, 17, 249-261,
doi:10.1016/j.ccr.2010.01.021.
42. She, Q.B.; Halilovic, E.; Ye, Q.; Zhen, W.; Shirasawa, S.; Sasazuki, T.; Solit, D.B.; Rosen, N. 4E-BP1 is a key effector of the oncogenic activation of the AKT and ERK signaling pathways that integrates their function in tumors. Cancer Cell 2010, 18, 39-51,
doi:10.1016/j.ccr.2010.05.023.
43. Qin, X.; Jiang, B.; Zhang, Y. 4E-BP1, a multifactor regulated multifunctional protein. Cell Cycle
2016, 15, 781-786, doi:10.1080/15384101.2016.1151581.
44. Tomas, C.; Brown, A.E.; Newton, J.L.; Elson, J.L. Mitochondrial complex activity in
permeabilised cells of chronic fatigue syndrome patients using two cell types. PeerJ 2019, 7, e6500, doi:10.7717/peerj.6500.
45. Wolvetang, E.J.; Johnson, K.L.; Krauer, K.; Ralph, S.J.; Linnane, A.W. Mitochondrial respiratory chain inhibitors induce apoptosis. FEBS Lett 1994, 339, 40-44.
46. Ransohoff, R.M.; Schafer, D.; Vincent, A.; Blachere, N.E.; Bar-Or, A. Neuroinflammation: Ways in Which the Immune System Affects the Brain. Neurotherapeutics 2015, 12, 896-909, doi:10.1007/s13311-015-0385-3.
47. Schlauch, K.A.; Khaiboullina, S.F.; De Meirleir, K.L.; Rawat, S.; Petereit, J.; Rizvanov, A.A.; Blatt, N.; Mijatovic, T.; Kulick, D.; Palotas, A., et al. Genome-wide association analysis identifies genetic variations in subjects with myalgic encephalomyelitis/chronic fatigue syndrome. Transl Psychiatry 2016, 6, e730, doi:10.1038/tp.2015.208.
48. Billing-Ross, P.; Germain, A.; Ye, K.; Keinan, A.; Gu, Z.; Hanson, M.R. Mitochondrial DNA variants correlate with symptoms in myalgic encephalomyelitis/chronic fatigue syndrome. J Transl Med 2016, 14, 19, doi:10.1186/s12967-016-0771-6.
49. Campanella, M.; Seraphim, A.; Abeti, R.; Casswell, E.; Echave, P.; Duchen, M.R. IF1, the endogenous regulator of the F(1)F(o)-ATPsynthase, defines mitochondrial volume fraction in HeLa cells by regulating autophagy. Biochim Biophys Acta 2009, 1787, 393-401,
doi:10.1016/j.bbabio.2009.02.023.