| INVESTIGATION
Replicability of Introgression Under Linked,
Polygenic Selection
Himani Sachdeva and Nicholas H. Barton1 Institute of Science and Technology Austria, A-3400 Klosterneuburg, Austria ORCID ID: 0000-0002-8548-5240 (N.H.B.)
ABSTRACTWe study how a block of genome with a large number of weakly selected loci introgresses under directional selection into a genetically homogeneous population. We derive exact expressions for the expected rate of growth of any fragment of the introduced block during the initial phase of introgression, and show that the growth rate of a single-locus variant is largely insensitive to its own additive effect, but depends instead on the combined effect of all loci within a characteristic linkage scale. The expected growth rate of a fragment is highly correlated with its long-term introgression probability in populations of moderate size, and can hence identify variants that are likely to introgress across replicate populations. We clarify how the introgression probability of an individual variant is determined by the interplay between hitchhiking with relatively large fragments during the early phase of introgression and selection onfine-scale variation within these, which at longer times results in differential introgression probabilities for beneficial and deleterious loci within successful fragments. By simulating individuals, we also investigate how introgression probabilities at individual loci depend on the variance offitness effects, the netfitness of the introduced block, and the size of the recipient population, and how this shapes the net advance under selection. Our work suggests that even highly replicable substitutions may be associated with a range of selective effects, which makes it challenging tofine map the causal loci that underlie polygenic adaptation.
KEYWORDSintrogression; Hill–Robertson interference; polygenic adaptation
T
HE extent to which phenotypic and genetic changes are replicated during adaptation across closely related pop-ulations has generated much interest (Conteet al.2012; Storz 2016), and is part of the broader question of the predictability of evolutionary change (Lässiget al.2017). Parallel evolution can be investigated at multiple scales, and may refer to the involvement of the same nucleotides, the same genes, or even the same pathways during adaptive responses in different pop-ulations (Manceauet al.2010). An important challenge is to interpret highly replicable genetic loci; do such loci necessarily make large contributions to the selected trait? Conversely, for different architectures of the selected trait, how often are the same genetic loci implicated across replicate populations?Several factors can influence the replicability of allele fre-quency changes or adaptive substitutions at individual loci (Stern 2013). More shared variation between replicate populations makes it more likely that the same variants respond to selection
across different replicates, but the response is then associated with a weaker reduction in neutral diversity, [i.e.,“soft sweeps,” see Hermisson and Pennings (2005)]. By contrast, adaptive substitutions that arisede novoare rarely shared across rep-licates, but can be more easily identified as being under se-lection because of the associated hard sweep patterns.
Factors influencing genetic parallelism at the level of in-dividual variants remain poorly understood for selection on highly polygenic traits, despite several studies with natural and laboratory replicates (Burkeet al.2010; Chanet al.2012; Yeamanet al.2016). Polygenic traits are often characterized by high genotypic redundancy, with multiple genotypes corre-sponding to approximately the same phenotype. For traits un-der stabilizing selection, a shift in the selection optimum can thus result in a highly heterogeneous response at the genotypic level, with selection amplifying initial randomfluctuations in allele frequencies, to produce quite different outcomes across replicates, even if these initially share the same variation.
In general, adaptation in complex traits involves a large number of partially linked and weakly selected variants, and is thus characterized by pervasive hitchhiking, where effectively neutral or deleterious variants are swept to high frequencies Copyright © 2018 by the Genetics Society of America
doi:https://doi.org/10.1534/genetics.118.301429
Manuscript received July 28, 2018; accepted for publication September 28, 2018; published Early Online October 1, 2018.
1Corresponding author: Institute of Science and Technology Austria (IST Austria),
along with clusters of positively selected variants (Barton 1995). While the effects of hitchhiking on neutral diversity have been studied extensively in the theoretical literature, most of these studies assume that selected variants are either all deleterious or all beneficial in a given population (e.g., Barton and Bengtsson 1986). Moreover, most empirical stud-ies also separately consider the effect of positiveorbackground selection on patterns of diversity, divergence, or introgression [though see Elyashivet al.(2016) for an investigation of the joint effects of the two]. However, a typical genome is likely to harbor many linked variants with a range of (positive and negative) selective effects. The efficacy of selection in discrim-inating between multiple, tightly linked beneficial and delete-rious loci is an essential determinant of the total phenotypic response to selection in afinite population (Robertson 1970, 1977). It is also key to assessing whether an allele frequency change (even one that occurs across replicates) is itself adap-tive and not a consequence of hitchhiking.
The extent of hitchhiking (and the associated patterns of neutral diversity) are strongly influenced by the density of selected polymorphisms on the genome. For example, when the rate of deleterious mutations is higher than the typical selective effect per mutation, polymorphic variants are suffi -ciently common that neutral diversity no longer depends on the selective effects of individual variants (Goodet al.2014). This results in a qualitatively different shape of the neutral site frequency spectrum, which cannot be predicted by stan-dard models of background selection (e.g., Nordborget al. 1996), but is better described by aninfinitesimalframework, which is parametrized by the variance in populationfitness (or the variance per unit map length), rather than the vari-ance offitness effects at individual loci (Neheret al.2013).
In this paper, we focus on a similar scenario of a complex trait determined by a large number of weakly selected variants uni-formly spread across the genome [see also Sachdeva and Barton (2018)]. The main goal is to explore how the interplay between linkage, polygenic selection, and genetic drift shapes the long-term introgression probability of different fragments of such a genome when it is introduced into a genetically homogeneous recipient population. For simplicity, we consider the introgres-sion of a medium-sized block of map lengthy0rather than the whole genome. This allows us to ignore certain complications, such as multiple crossovers within the selected region, in ana-lytical calculations. It is also representative of a scenario where a genome that is repeatedly back-crossed into a recipient popula-tion breaks up into several medium-sized segments that evolve more or less independently, while they are rare in the recipient population. Most importantly, as shown below, the introgression probability of any variant depends primarily on the effect of variants within a characteristic linkage scale, and not on loosely linked regions, as long as the introduced genome has no net selective effect in the recipient population. This again suggests that studying the introgression of medium-sized blocks can provide useful insight into the more general case. The introduced block is assumed to carry a large numberL of loci with a range of selective effects, uniformly spaced over
map lengthy0:These loci contribute to an additive trait that is under directional selection in the recipient population. The trait value associated with any portion of the block is then just the sum of effects of all the loci it contains. The effect sizes of loci on the introduced block are drawn from a distribution with meanmand variances2;the effect sizes of variantsfixed in the recipient population can be set to zero without loss of generality. For simplicity, we assume that mand s2 do not vary across the introduced block. However, most of our ana-lytical results hold even when this condition is not met, for instance, if there is a statistically significant clustering of large-effect variants in the donor genome.
If the donor population is in linkage equilibrium, such that allelic states of different loci along the introduced block are statistically uncorrelated, then different segments of this block (each withl1loci) have random (and typically unequal) contri-butions, with meanml1and variances2l1:Note that the variance of these contributions, or more generally the variance per unit map length, given byV0 ¼s2L=y0;is the same irrespective of whether the block contains a few, large-effect loci (smallLand larges2) or many, small-effect loci (largeLand smalls2). Thus, varyingLwhile keepingV0andmLconstant tunes the extent to which individual loci interfere with each other within fragments with a given map length and total selective effect. If the number of loci is very large and the distribution of allelic effects is cor-respondingly narrow—i.e., in the limit m/0; s2/0; and L/N; with mL and s2L held fixed—this model approaches theinfinitesimal model with linkage[see Robertson (1977)]. This model is similar to the well-known infinitesimal model (Bulmer 1980; Barton et al. 2017), but also accounts for linkage by considering loci on a linear map, rather than unlinked loci.
In this study, we explore the effects that shape the intro-gression dynamics of different segments of aparticular intro-duced block, in contrast to our previous work [see Sachdeva and Barton (2018)], which analyzed statistical averages asso-ciated with anensembleof such blocks (all characterized by the same net trait valuez0 and the same genic variance per unit map lengthV0). We focus here on the following two questions. First, what is the expectedinitialgrowth rate of a fragment or locus embedded within the introduced block, under direc-tional selection? Is the growth rate of an individual variant influenced more by its own effect or the effects of linked loci within a characteristic map distance? Second, to what extent do expected initial growth rates predict the ultimatefixation probability of different fragments in afinite population?
large population, this would allow selection to fix all posi-tively selected variants and eliminate all deleterious variants within introgressing fragments that have survived the initial phase. In a smaller population, only part of this fine-scale discrimination can be achieved, which constrains the net re-sponse to selection. An important focus of our work is to explore how the ultimate fate of variants in afinite popula-tion is determined by the interplay between the early dynam-ics characterized by selection on relatively large genomic fragments and long-term dynamics governed by selection onfine-scale variation within these. This clarifies the condi-tions under which individual variants establish with high prob-ability (and hence are likely to be replicated across populations that receive the same genome). Identifying the distribution of effects associated with highly replicable loci, even within this simple model, can shed light on the limitations offine mapping the causal loci that underlie polygenic adaptation.
The expected growth rates of genomic segments during the initial phase of introgression are relatively easy to calculate, since introgressed fragments are rare, and hence unlikely to encounter each other during mating. Thus, any genome carries at most one fragment of the introduced block, which leads to explicit ana-lytical expressions for the initial growth rate of fragments and for the probability of survival of at least some part of the introduced block. We then study long-term introgression by simulating individuals, and illustrate the correlation between initial growth rates and long-termfixation probability by means of a represen-tative example. We then describe how introgression probabilities at individual loci depend on the variance offitness effects, the total trait value associated with the introduced block, the size of the recipient population, and the extent of initial stochasticity (which is tuned in this model by introducing singlevs.multiple identical copies of the block). The extent to which selection and recombination can pick out and amplify individual favor-able variants is a basic determinant of the net response to selection, when selected variants are tightly linked. We ad-dress the question of selection limits, and their dependence on population size and linkage, at the end of the paper.
Methods
Consider a situation where N0 identical copies of a block of genome are introduced into a very large population of
diploids att¼0:Any diploid individual is assumed to carry at most one copy of the introduced block. The block hasLloci, which are assumed to be evenly spaced on the genetic map, with recombination ratec between adjacent loci. The extension to unequal rates of recombination between loci is straightforward. The additive effect of the kth locus is denoted bysk:Thefitness of the block is multiplicative across loci and is given by expPLk¼1sk
Initial introgression into a large population
To derive analytical results for the initial dynamics of block fragments, we assume that the introduced block, with map lengthy0 ¼cL;is short enough that multiple crossovers can be neglected. When the introduced block and its descendant fragments are sufficiently rare in the population (as expected during the initial phase), then the probability of recombina-tion between fragments is negligible and any individual in-herits at most one introgressed fragment. Therefore, we need only consider single fragments spanning locii⋯j;with selec-tive effect Si;j¼
Pj
k¼isk;which break up by recombination with rate cðj2iÞ: For weak selection and recombination
ðsk;c1Þ; the expected numbers Ni;jðtÞ of different frag-ments change approximately continuously through time, according to a set of linear equations:
@Ni;j @t ¼
Si;j2cðj2iÞ
Ni;jþc "
Xi21
m¼1 Nm;jþ
XL
m¼jþ1 Ni;m
# ;
Ni;j¼N0di;1dj;L at t¼0
(1)
Thefirst term is the rate at which a fragment spreads intact (without being split), and is positive when the fragment is amplified by selection (at a rate proportional to itsfitnessSi;j) faster than it is split by recombination (rate proportional to map lengthcðj2iÞ). The second and third terms are due to generation of the fragment by recombination from larger blocks (in which it is embedded).
Equation 1 can be solved explicitly by taking the Laplace Transform, solving for the expected number of single recombinants N1;i and Ni;L; and then solving for expected numbers of smaller blocks. The solution is a sum of expo-nentially decaying (or increasing) components:
Ni;jðtÞ ¼N0
XL
k¼j Xi
m¼1
Ajþ1;kBkþ1;LA^1;m21B^m;i21exp
"
t cþX
k
y¼m
ðsv2cÞ !#
Am;k¼
c gm;k
1þ c
gmþ1;k
. . .
1þ c
gk;k
Bm;k¼ 2
c gm;k
12 c
gm;k21
. . .
12 c
gm;mþ1
12 c
gm;m
wheregm;k¼
Pk
v¼mðsv2cÞ; ^Ais obtained by replacingcby2c inAandB^by replacing2cbyþcinB. Also,Am;k,Bm;k,A^m;k; andB^m;kare all equal to 1 for m.k.
The sum is over all blocks½m;k(withm#i#j#k) that contain the fragment½i;j;including½i;jitself. For larget, the exponential term with the largest growth rate will dominate the dynamics of the block. Thus, at long times, any block grows at the same rate as the fastest growing parent block from which it can be generated. Note that if the intrinsic growth rate Si;j2cðj2iÞof the block is larger than the growth rate of any parent block containing it, then the long-term growth rate of the block is justSi;j2cðj2iÞ:An important consequence of Equation 2 is that deleterious fragments may also spread through the population, if generated at a constant rate by a beneficial, exponentially growing parent block. In fact in this case, the deleterious subblock will grow at the same rate as the beneficial parent block, as is evident from Equation 2. Thus, each such exponentially increasing block generates various descendant subblocks of varyingfitness, giving rise to a family of blocks, akin to a quasi-species (Eigen et al. 1988).
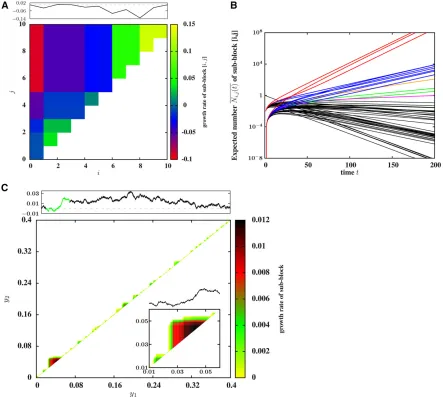
Figure 1A depicts the long-term growth rates of all possi-ble 55 fragments of a block with 10 loci, while Figure 1B shows the expected dynamics of these fragments. Note the spread of different families of subblocks at different rates, where each such family (represented by lines of one color in Figure 1B) consists of subblocks that are all con-tained within a particular, fast-growing parent block. After an initial transient phase, all subblocks within a family in-crease at the rate of growth of this parent block. In the following, we approximate the growth rate of any fragment by the rate associated with the fastest-growing term in Equation 2,i.e., by the intrinsic growth rate of the fastest-growing parent block that contains this fragment. We refer to this as the expected growth rate of the fragment, since it describes the dynamics of the expected number of copies of the fragment in the population, averaging over all possible stochastic histories, including those in which the fragment is lost.
The key assumption underlying Equation 1 is that de-scendants of the introduced fragment form a negligible frac-tion of the populafrac-tion, and thus never encounter each other during mating. Then, the spread of introgressed genetic material through the population can be formulated as a branching process (BP) that treats the (forward in time) lineages of different descendants as being independent of each other, but having a common dependence on
fs1;s2;. . .sLg (Sachdeva and Barton 2018). The BP frame-work is very powerful and can, in principle, yield the full distribution of introgressing fragments as a function of time. Here, we write down the equation for the probability P1;L that at least some part of a block f1;Lg spanning loci i¼1;⋯Lsurvives at long times, given that it is initially in-troduced as a single copy. To work with dimensionless quan-tities, we scale both selection and survival probability relative to the map length: ~Pi;j¼Pi;j=Lr;and ~Si;j¼Si;j=Lr:
The long-term scaled survival probability of a block f1;Lg satisfies:
0¼1 L
X L21
k¼1
~
P1;kþ XL
k¼2
~
Pk;L !
þ~S1;L21
~
P1;L21
2P~ 2 1;L (3)
This equation is of the form 0¼fþa~P1;L2~P 2
1;L=2;where the
first termfis due to the survival of smaller subblocks and the coefficientaof the second term is the intrinsic growth rate of the full block. This equation is analogous to equation 3 in Barton (1995), but has an additional driving termf. Solving the quadratic, we have:
~
P1;L¼g "
1 L
X L21
k¼1
~
P1;kþ XL
k¼2
~
Pk;L !
;~S1;L21 #
(4)
where g½f;a ¼aþpffiffiffiffiffiffiffiffiffiffiffiffiffiffiffiffia2þ2f; g½0;a ¼max½0;2a: This is easily evaluated, because P~ for larger blocks depends only on that for smaller blocks. Note that blocks with a negative net rate of increaseða,0Þcan survive (in part), if they con-tain smaller blocks with positive growth rates, such that f.0:If the blockf1;Lgis introduced inN0copies, then the survival probability of each such block is roughly indepen-dent of other blocks, as long asN0 is much smaller than the size of the recipient population. Then, the overall survival probability is just 12ð12P1;LÞN0:
Long-term introgression
Equation 1 is a valid description of the dynamics of genomic fragments only while any individual carries at most one such fragment. As shown in Sachdeva and Barton (2018), this is true over a time scale that scales weaklyðlogðNÞÞwith the size Nof the recipient population. Beyond this initial time scale, mating between individuals carrying introgressed ma-terial becomes more frequent and genomes carrying multiple fragments of the introduced block emerge. This phase is thus characterized by competition between genomes bearing dif-ferent mosaics of the fragments that have established and proliferated in the initial phase, and is no longer described by Equation 1.
To study long-term introgression, we simulate populations withNdiploid individuals. The simulations are initialized by assuming that 2p0Nhaploid genomes in the population carry identical introduced blocks, while all other genomes carry identical“native”blocks. For simplicity, we assume that each of the 2p0Nintroduced blocks is present in a different indi-vidual. Each block has Lloci, with rate of recombination c between adjacent loci. The allelic effect of each native locus is equal to zero, while effects of the introduced loci are drawn from a distribution with variances2 and meanm. The trait valueSassociated with any individual is then just the sum of effects of all introduced variants in its diploid genome; its
fitness iseS:
haplotypes: the number of crossover points is drawn from a Poisson distribution with meany0;the locations of the cross-over points are chosen by uniformly sampling one of theL21 junctions between loci without replacement. The gametes are then paired to formNindividuals of the next generation.
We compute introgression probabilities by performing 200–400 replicate simulations, each initialized by introducing
2p0Nidentical copies of the same block att¼0:Thus, replicate populations differ only in the stochastic history of reproduc-tion and recombinareproduc-tion. The introgression probability of a particular fragment at time tis calculated as the fraction of replicates in which the fragment is presenteither by itself or as part of a larger block. Since any fragment must either fix or be completely eliminated at long times, the introgression
Figure 1 (A) Expected (asymptotic) growth rates of various fragments½i;jof a block withL¼10 loci, withfitness contributions drawn from a Gaussian distribution with meanm¼0 and variances2¼0:1=L;such that the contributions of all loci sum to 0; the rate of recombination between adjacent loci isc¼0:01:The two axes of the plot represent the two endpoints of the fragment; each locationði;jÞin the upper triangle of the plot represents a particular fragment with endpointsiandj$i:The color associated with each location encodes the expected growth rate of the fragment (see adjoining color scale). Note that many of the 55 subblocks have the same expected asymptotic growth rate; thus, there are 15 distinct asymptotic growth rates (colors) in (A), of whichfive are positive. The black curve in the upper panel shows how the trait value varies along the introduced block. Thex-axis represents the positionsiof the loci on the block and they-axis represents the cumulative contribution of all loci from½0;i;thus, any segment with a positive slope represents a subblock with a net positive contribution to trait value and vice versa. (B) Expected numbers of each of the 55 fragments contained within the 10-locus block in (A), as a function of timet. Black curves represent fragments with asymptotically negative growth rates; curves in other colors represent fragments with asymptotically positive growth rates, which increase in number at long times. All fragments with the same asymptotic (positive) growth rate are represented by the same color. All curves are calculated by iterating Equation 1. (C) Asymptotic growth rates of various fragments of a block withL¼2048 loci and map lengthy0¼0:4:The net trait value associated with the block is 0 and variance per unit map length ffiffiffiffiffiffiV0
p
¼0:05 (which impliess2¼0:001=L). The two axes of the plot represent the map positionsy
probability of a fragment in the largetlimit, is just itsfixation probability. A fragment with fixation probability Pwould be found in two replicate populations with probabilityP2; thus, any fragment with high introgression probability is also a rep-licable fragment. Note that the introgression probability is not the same as the survival probabilityP1;L;which was calculated in Equation 4. The latter refers to the probability that the block
f1;Lg;introduced as a single copy att¼0;is not fully lost from a very large population, but has at least one surviving descen-dant subblock.
Data availability
FORTRAN 95 codes used to generate the simulated data can be found at: https://git.ist.ac.at/himani.sachdeva/source_ codes_replicability_introgression_patterns/snippets.
Results
To gain insight into how the ultimate fixation probability of different parts of the introduced genome is shaped by the early dynamics (as encapsulated by the expected initial growth rates)vs. long-term dynamics (characterized by se-lection on multiple, linked successful fragments), we first analyze one representative example in detail. This illustrates key features of the introgression process, which hold more generally.
Introgression probabilities of different fragments of the genome: an example
Consider an introduced block with L¼2048 loci, uni-formly spaced over map lengthy0 ¼0:4:The contributions of different loci are drawn from a normal distribution with mean 0 and variance s2¼0:001=L; using an iterative scheme that ensures that the contributions sum to S1;L¼0 [see also Sachdeva and Barton (2018)]. Figure 1C depicts all fragments of this block that have a positive expected growth rate. Note that these fragments are quite small; longer fragments of a nearly neutral introduced block are split by recombination faster than they are am-plified by selection, and hence have negative expected growth rates.
In this example, we simulate a diploid population of size N¼4000; with initial frequency p0¼0:005 of the intro-duced haplotype, such that there are 2Np0 ¼40 introduced blocks in the population at t¼0; and, hence, 40 approxi-mately independent realizations of the initial introgression process within any one population. The dynamics of early introgression in such a population would thus be close to the prediction of Equation 2. By contrast, with a single in-troduced blockðp0¼1=2NÞ;all or some of the introduced genome, including beneficial fragments, may be lost from the population while present in low numbers, which causes the dynamics of individual populations to differ markedly from the expected dynamics. The parameter 2Np0thus governs the extent to which the initial dynamics of any individual popu-lation is deterministic.
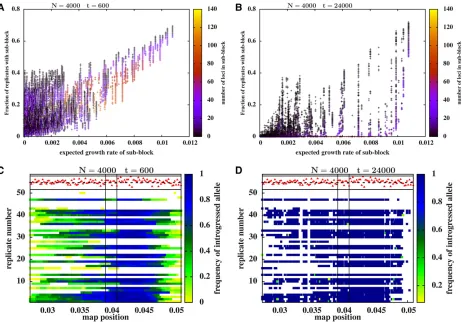
Figure 2, A and B show the introgression probability of different fragments of the introduced genome vs. their expected growth rates (as calculated above) for two different time instants:t¼600 (Figure 2A) andt¼24;000 (Figure 2B). Each point represents a particular fragment; the color of the point encodes the length of the fragment or, alterna-tively, the number of equally spaced selected loci that it contains (see accompanying color scale). The introgression probability of any fragment is the fraction of replicates in which the fragment is present, considering only those rep-licates in which at least some part of the introduced block survives at long times. We only show introgressing frag-ments with positive expected growth rates, as fragfrag-ments with negative growth rate fail to introgress in the long run within a large population.
The introgression probabilities of different fragments at t¼600 are highly correlated with their expected growth rates (correlation coefficient r¼0:82), while the correla-tion is somewhat weaker ðr¼0:46Þ but still nonzero at t¼24;000:The weaker correlation at longer times is due to substantial differences in the long-term introgression prob-abilities of different fragments that have thesameexpected growth rate (note the much higher scatter along they-axis in Figure 2B relative to Figure 2A). Note that we use the corre-lation coefficient purely as a descriptive statistic: thus, anr value of 0.8 implies that 64% of the total variance of intro-gression probabilities can be explained by a linear regres-sion with the expected growth rates. However, this does not provide a complete description, since the introgression probabilities are not normally distributed about the linear prediction.
Figure 2B suggests that the introgression of shorter frag-ments is more replicable than that of longer fragfrag-ments within any family of fragments with the same expected growth rate; note the higher introgression probabilities associated with black as compared to blue points within each vertical column of points. To investigate this in more detail, we zoom into a small window of the genome that contains a large number of replicable fragments. Figure 2, C and D show snapshots of this genomic window for 50 replicate populations att¼600 and t¼24;000, respectively. Each horizontal band corre-sponds to one replicate population and the colors along each such band encode the frequencies (in that population) of introgressed variants at different map positions. The red tri-angles depict selective effects of individual variants.
At long times (Figure 2D corresponding tot¼24;000), multiple, disjointed fragments of the introduced genome are
deleterious variant in the middle. This new combination of fragments would then have out-competed the original seg-ment, as it is associated with a larger selective advantage than the original segment, while having the same (low) prob-ability of being split by recombination. In a subsequent sec-tion, we analyze this process in more detail for a toy example with three loci.
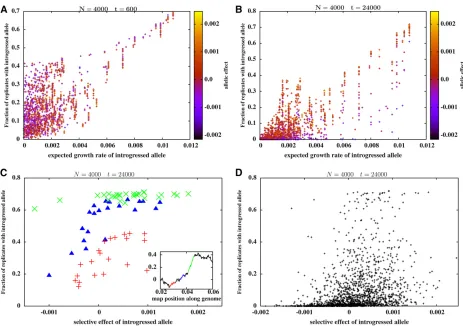
To avoid comparing fragments of different sizes, many of which are overlapping or even fully contained within other fragments, we compare introgression probabilities of different single-locus variants embedded within the introduced ge-nome. Figure 3, A and B show introgression probabilities at single loci (which constitute a subset of the fragments shown in Figure 2, A and B) vs. their expected growth rates, for
t¼600 andt¼24;000:As before, the expected growth rate of a locus is the growth rate of the fastest-growing subblock that contains it. The introgression probability at individual loci shows high correlation with the expected growth rate, at both t¼600 (with correlation coefficientr¼0:74) and at t¼24;000 (withr¼0:82). However, at longer times, there is a substantial scatter among loci with the same expected growth rate, with deleterious loci (purple dots) having lower introgression probabilities than beneficial loci (orange dots) within any particular cluster of such loci.
To explore how long-term introgression probabilities at individual loci depend on their own selective effects, we consider three separate windows of the introduced ge-nome (shown in green, red, and blue in the inset of Figure 3C).
Figure 2 Introgression probabilities of differentfragmentsof the genome shown in Figure 1C (withS1;L¼0;y0¼0:4;
ffiffiffiffiffiffi V0 p
The main plot in Figure 3C shows the long-term introgres-sion probabilities of single-locus variants contained within each of these three segments vs. their selective effects, with green, red, and blue points depicting loci contained in the corresponding segments shown in the inset. Figure 3C suggests that within loci with the same expected growth rate, long-term introgression probabilities are sensitive to the selective effect of the locus. In particular, the introgres-sion probabilities of deleterious loci decline with their selective disadvantage (note especially the red and blue points).
In the early phases of introgression, tightly linked loci contained within the same exponentially increasing subblock have the same fate (as evident in the limited scatter of in-trogression probabilities among loci with the same expected
growth rate in Figure 3A). At early times, selection does not “see”individual loci, since recombination has not had suffi -cient time to separate tightly linked variants. However, at longer times, recombination generates smaller and smaller fragments of successful subblocks, and also reconstructs var-ious combinations of these fragments, some of which would lack deleterious variants present in the original parent block. Such combinations would supplant the original successful block, thus also eliminating some of the deleterious loci con-tained within this block. Note that this kind offine-grained separation of tightly linked beneficial and deleterious vari-ants within a block over long time scales can only occur if the block has not alreadyfixed in the population. For instance, the subblock corresponding to the green segment in Figure 3Cfixes very rapidly, which does not allow enough time for
Figure 3ffiffiffiffiffiffi Introgression probabilities of different single-locus variants embedded in the genome shown in Figure 1C (with S1;L¼0; y0¼0:4;
V0 p
embedded deleterious variants to recombine away and get eliminated.
Does the substantial decline in introgression probability with the selective effect of individual loci within limited genomic windows lead to a correspondingly strong depen-dence on individual effects across larger map distances? Fig-ure 3D shows introgression probabilities (at t¼24;000) of single-locus variants across the entire blockvs.their selective effects. Even in the long run, single-locus introgression prob-abilities are only weakly correlated with selective effect across the whole block (correlation coefficientr¼0:37 in Figure 3D), in contrast to the much stronger correlation with expected growth rates (r¼0:82 in Figure 3B). This is consis-tent with our explanation that the ultimatefixation probabil-ity is shaped by linked selection (or selection on clusters of loci) in the early phases of introgression, which then con-strains the extent to which selection can distinguish between individual variants within these clusters in the later phases of introgression. Note further that the most replicable variants are associated with a range of selective effects (see also Fig-ure 4) and can even be deleterious, which makes it mislead-ing, at least within this model, to infer that high replicability implies adaptive significance.
Dependence of introgression probabilities on the
distribution offitness effects
This raises the question: are long-term introgression proba-bilities of single-locus variants more strongly correlated with their own selective effects when these effects are larger? In other words, as the distribution of fitness effects (DFE) becomes wider (largers2), is there an approach to an effec-tive single-locus regime where selection on the focal locus, rather than linked selection, determines introgression out-comes? In examining this question, we must distinguish be-tween the variance of fitness effects s2; and the genic variance per unit map lengthV0¼s2=c;which depends on boths2and the density of selected loci on the genome. The genic varianceV0influences the extent of linked selection; a fragment of lengthy(emerging from an introduced genome with S1;L0) has a typical (positive or negative) contribu-tion that scales as ffiffiffiffiffiffiffiffiV0y
p
: Thus, successful fragments have higher expected growth rates (on average) and correspond-ingly shorter fixation times whenV0 is larger. On the other hand, the per locus variances2determines the extent to which selection can discriminate between loci of different effects at
fine recombination scales at long times. Thus, larges2 and largeV0 are expected to influence the correlation between in-trogression probabilities and selective effect differently. While larger s2 implies higher efficacy of selection in separating tightly linked beneficial and deleterious loci, higherV0results in higher growth rates of successful blocks, which causes tightly linked loci tofix together before they can be taken apart by recombination and seen individually by selection.
To clarify the roles ofs2andV0in determining long-term introgression probabilities, we compare two blocks with the same density of selected variants (i.e., with the same number
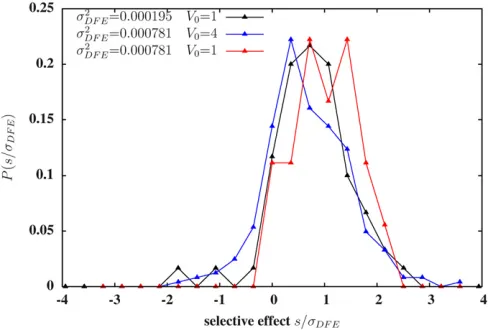
Lof selected loci and the same recombination ratecper lo-cus), but with the variance offitness effects of individual loci on one block being four times the corresponding variance for the other block. It then follows that the genic variance per unit map lengthV0 for thefirst block is also four times the corresponding variance for the second block. We consider all variants with long-term introgression probabilities.0.5 within each block and plot the distribution of their selective effects (Figure 4). Strikingly, the distribution has a very sim-ilar shape in the two cases (black vs. blue curves), but is shifted toward slightly weaker selective effects (relative to
sDFE) when the block has a wider DFE and a correspondingly high genic variance V0 (blue), than when the block has a more narrow DFE and a lower value ofV0(black). The mean selective effect of such strongly replicable loci is 0:662sDFEin thefirst case (blue curve) and 0:754sDFEin the second case (black). Moreover, the fraction of strongly replicable loci that aredeleteriousis slightly higher (0.156vs.0.117) for the in-troduced block with largers2
DFEandV0. This suggests that for a given (high) density of selected variants on the genome, a wider DFE results in more extensive hitchhiking of deleteri-ous loci during introgression and, thus, reduced power to pinpoint adaptive loci from patterns of replicability.
We also compare two blocks characterized by the sameV0; but with different values of s2DFE and L. Since V0 governs initial introgression, both blocks are expected to show very
Figure 4 The distribution of selective effects of single-locus variants that introgress with probability .50%: The three distributions correspond to three different introduced blocks with map length y0¼0:4 and
S1;L¼0:0:Thefirst block (distribution in black) hasL¼2048 loci with effects drawn from a distribution with variances2
DFE¼0:001=L;resulting in genic variance per unit map lengthV0¼s2DFEL=y0¼0:0025:The sec-ond block (blue) hasL¼2048 loci, with the allelic effect of each locus exactly twice the effect of the corresponding locus in block 1; thus, block 2 has s2DFE¼0:004=LandV0¼0:01:The third block (red) hasL¼512 loci. The allelic effect of thei th locus in this block isP4k¼1g4i2k;wheregi is the effect of theith locus on block 1; thus, block 3 hass2DFE¼0:004=L butV0¼0:0025:Note that loci with negative selective effects are least likely to establish for the third block (red) that has fewer and larger effect loci. All plots are obtained from simulations of replicate populations with
similar short-term patterns of introgression. However, a pop-ulation that receives the block with wider DFE (and lower density of selected variants) should undergo more efficient elimination of deleterious loci in the long run. This is indeed observed in simulations; the distribution of selective effects of strongly replicable variants is shifted toward higher effects (mean selective effect 1:0285sDFE) for the block with wider DFE (red curve), as compared to the block that has a nar-rower DFE but the same V0 (black curve). Further, the fraction of strongly replicable loci that are deleterious is neg-ligible for the red curve, as compared to 0.117 for the black curve. This is consistent with the general expectation that direct selection on loci should affect their introgression out-comes more strongly than linked selection when the contri-bution of a genomic region is determined by fewer, larger effect loci.
Note that, in the present example, the recipient population is sufficiently large or recombination between neighboring selected variants sufficiently frequent that individual variants can be isolated. More generally, selection and recombination are expected to weed out regions of some typical lengthl9from within successful blocks, wherel9would depend on popula-tion sizeNand the growth rate of the successful block. The selective effects associated with replicable loci would then depend on the DFE of segments of lengthl9, rather than the DFE of individual variants. Understanding howl9depends on population sizeNandV0is nontrivial, and we do not attempt to address this question here.
Dependence of introgression probabilities on population size
The size of the recipient population is important in determin-ing the probability of stochastic loss and hence the extent to which the spread of an advantageous allele is predictable. The
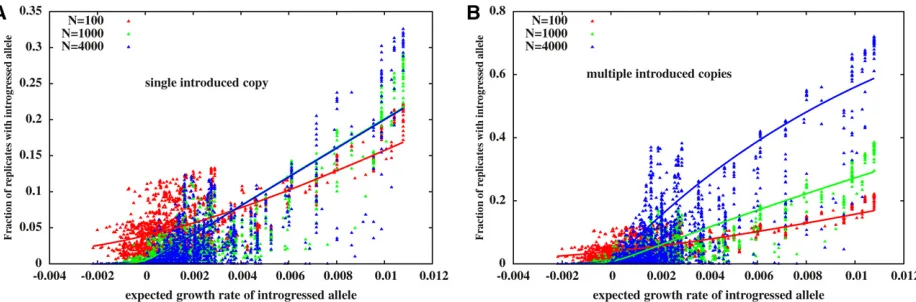
fixation probability of an unlinked allele with selective effects, introduced into a population of sizeNat a frequencyp0, was derived by Kimura (1957). This fixation probability ap-proaches a limit that is independent ofNforNs1:when a single copy of the allele is introduced ðp0¼1=2NÞ; the asymptotic fixation probability is 2s for s1: Thus, most beneficial alleles are lost in a single population. On the other hand, when a beneficial allele is introduced at afixed fre-quencyp0;its asymptoticfixation probability is 1 for largeN. To what extent are these single-locus predictions relevant to a scenario where the introduced genome consists of mul-tiple, linked, beneficial and deleterious loci? We investigate the dependence of long-run introgression probabilities onN by comparing introgression of the same genome into popu-lations of different sizes for two scenarios: one where a sin-gle copy of the block is introduced into the population (p0¼1=2N;see Figure 5A) and the second where multiple copies of the same block are introduced at a fixed initial frequency (p0 independent of N, Figure 5B). Figure 5, A and B show the introgression probabilities (at t¼24;000) of single-locus variantsvs.their expected growth rates in the two cases, for various population sizes. Solid lines show the
predictions of a modified version of Kimura’s formula, where the introgression probabilityPiof the introduced variant at locusiis assumed to be:
Pi¼
12e24p0seff;iN
12e24seff;iN
(5)
whereseff;iis the expected growth rate at locusi, rather than the selective effect of the locus.
Interestingly, Equation 5 can explain 40–70% of the vari-ance of introgression probabilities (see also caption of Figure 5), suggesting that clusters of loci identified as having the same expected initial growth rate are, in some sense, natural linkage units into which the genome can be decomposed. To a first approximation, each such unit can be considered as unlinked to others. However, note that there is considerable scatter of the introgression probabilities (about the predic-tion of Equapredic-tion 5), especially in large populapredic-tions. As we argue above, the differential introgression of tightly linked loci within a genomic fragment depends on its time tofi xa-tion relative to the time scale at whichfine-scale recombina-tion within the fragment becomes effective, which in turn depends on population sizeN.
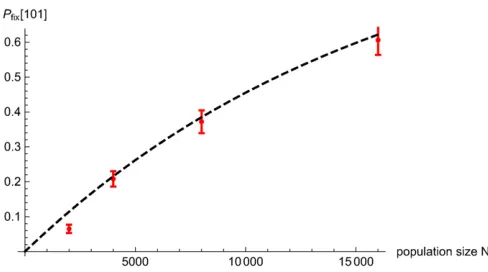
We now examine this dependence on Nin detail for an introduced block withL¼3 loci. Assume that the selective effects at the three loci satisfys1.0;s2,0;ands3.0;such that the expected growth rate of the full block is higher than the growth rates of any of its single- or double-locus frag-ments. However, if recombination were to bring together introgressing variants at the first and third locus without the deleterious (s2,0) variant in the middle, then this dou-ble recombinant would befitter than the introduced parent block and can supplant the latter.
An approximate expression for thefixation probability of this“101”recombinant (carrying introgressed variants at thefirst and third loci) can be obtained using the semideter-ministic approach of Hartfield and Otto (2011) (details in Appendix). The 101 recombinant is mostly generated by recombination between the full parent block, and a descen-dant block carrying an introgressed variant at just thefirst or the third locus. The frequencyPemerge101 ðtÞof such recombi-nation events (that lead to the emergence of the 101 recombinant in generationt) can be computed by assuming deterministic dynamics for genotypic frequencies. We then use a BP framework to calculate the probability PfixðtÞ that a 101 recombinant, emerging at timet,fixes in the population in the long run. Note that the time at which the recombinant emerges determines itsfitness relative to the recipient pop-ulation, since the mean fitness of the recipient population itself changes as the introgressed genome spreads through it. The probability that none of theNPemerge101 ðtÞrecombinants (generated in generation t) fix is then: ½12PfixðtÞNP
population of sizeNis justexp½2NRtN¼0dt Pemerge101 ðtÞPfixðtÞ This implies that the double recombinantfixes with prob-ability 12exp½2NRtN¼0dt Pemerge101 ðtÞPfixðtÞ, which increases with the size of the recipient population and approaches 1 for largeN, for afixedp0:Thefixation probability of the 101 recombinant in individual-based simulations matches the semideterministic prediction quite well (see Appendix). Thus, large populations typically have a larger number of recombinants that combine variousfit fragments of a success-ful subblock (before it fixes). This makes it increasingly probable that at least one of these recombinants establishes and supplants the parent subblock in the population, thus eliminating deleterious variants embedded in the parent subblock.
Role of net selective effect of introduced block
So far, we have considered the case where the introduced block is neutral with respect to the recipient population
ðS1;L¼0Þ:However, when the introduced block is deleteri-ous as a whole ðS1;L,0Þ; any of its constituent fragments (including those with a high, positive expected growth rate in the long run) experience an initial selective disadvantage. Many of the 2p0N copies of the introduced block are lost from the population before the beneficial fragment is sep-arated from the deleterious background and amplified by selection, which suggests that the actual introgression prob-ability in this case would be lower than that predicted by Equation 5.
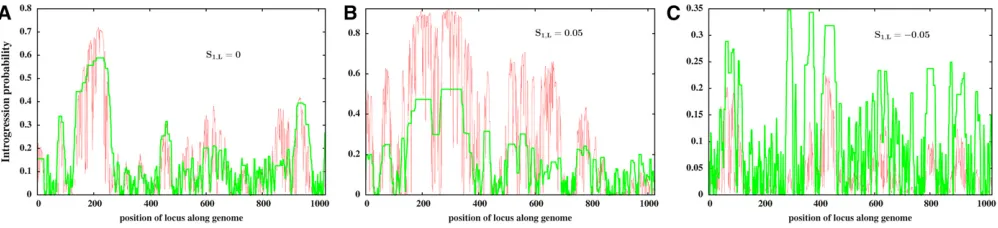
Figure 6 compares introgression probabilities obtained from simulations with the predictions of Equation 5 for a neutral (Figure 6A), beneficial (Figure 6B), and deleterious (Figure 6C) block. As expected, Equation 5 broadly captures the variation of single-locus introgression probabilities along the neutral block, but systematically overestimates (or under-estimates) these when the block is deleterious (or beneficial).
Note that introgression probabilities of single-locus variants are highly correlated with the expected growth rate, even for blocks with S1;L6¼0 (where the correlation coefficient is r¼0:8 for the beneficial block shown in Figure 6B and some-what lower at r¼0:58 for the deleterious block in Figure 6C). However, Equation 5 no longer accurately describes the relationship between the two quantities.
More generally, since the rate of increase of a subblock itself changes over time, before approaching a constant (asymp-totic) value (see Figure 1B), a more accurate predictive ap-proach needs to explicitly consider the establishment of any fragment under a time-varying effective selection coefficient (e.g., see Uecker and Hermisson 2011) instead of a con-stantseff (as used in Equation 5). An interesting question is whether the effect of totalfitnessS1;Lof the introduced block can be partially captured by a constant factor (corresponding to a genome-wide barrier to geneflow) that attenuates (or inflates) the introgression probabilities of all fragments of the block by the same amount. Explicit expressions for bar-rier strength have been derived by Bengtsson (1985) and Barton and Bengtsson (1986) for the simpler case of a neutral locus embedded in a genome with all deleterious loci.
Dependence of long-term selection response on population size and linkage
Directional selection on standing genetic variation results in a net phenotypic advance, which depends on population size N. When selection acts on a very large number of polymor-phicunlinkedloci (as in the standard infinitesimal model), additive genetic variance declines at a rate1=2Nper gen-eration due to drift. This constrains the net advance, which scaleslinearlywithN(Robertson 1960). The situation is more complex for selection on linked loci (Robertson 1970, 1977). Tightly linked variants wouldfix together rapidly in a small population, but be broken apart and seen by selection in a
Figure 5 Introgression probabilities of single-locus variantsvs.their expected growth rates, for recipient populations of different sizes when (A) a single copy of the introduced block enters the population att¼0. (B) Multiple (2p0Nwithp0¼0:005) copies of the block are introduced att¼0:Each point represents the introgression probability of a single-locus variant, as obtained from individual-based simulations forN¼100 (red),N¼1000 (green), and
N¼4000 (blue). Note that the blue points in (B) are the same as those shown in Figure 3B. Lines represent predictions of Equation 5. These predictions explain 52:4; 63:4, and 67:8% of the variance of introgression probabilities forN¼100;1000, and 4000, respectively, in (A), and 52:4; 65:6, and 42:6% of the corresponding variance in (B). The same block (withS1;L¼0;y0¼0:4; ffiffiffiffiffiffiV0
p
larger population. Thus, in this case, increasing population size tunes drift as well as the extent of hitchhiking.
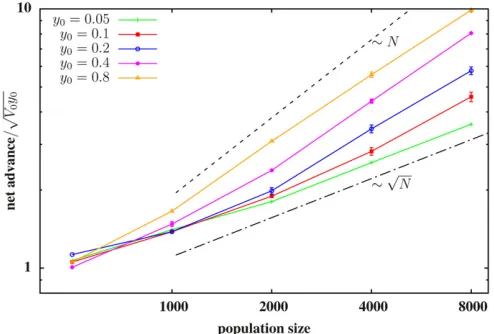
We investigate the scaling behavior of net advance for different degrees of linkage by simulating a particular set of L¼2048 loci, with net trait value S1;L¼0; spread across blocks of different map lengthsy0:Multiple (i.e., 2p0N) cop-ies of the block are introduced into a population of sizeNat t¼0:We then measure the net advance under selection
(de-fined as the average trait value in the limitt/N) in a pop-ulation and average over replicate poppop-ulations. To assess the effect of linkage on net advance, we do simulations where the sameL¼2048 loci are uniformly spaced across blocks with differenty0;the allelic effects of the loci are scaled withpffiffiffiffiffiy0 such that the genic variance per unit map length
ðV0¼s2L=y0Þand the trait value relative to the total genic varianceðS1;L=
ffiffiffiffiffiffiffiffiffiffi
V0y0
p
Þis the same for blocks of different map lengths. Figure 7 shows the average net advancevs. popula-tion sizeNfor blocks of different lengths. The net advance is normalized by the probability of survival of at least some part of the introduced block.
Figure 7 shows that the net advance scales sublinearly with Nfor the shortest blocks (tightly linked loci), but approaches a linear dependence with increasing block length. Based on the above arguments, efficientfine-scale separation of beneficial and deleterious loci should also occur within short blocks in a sufficiently large population, resulting in asymptotically linear scaling of net advance with N. However, this is difficult to confirm in simulations. More importantly, this limit might not be realized in typical scenarios involving populations of a few thousand (as in Figure 7), when introduced variants are tightly linked. Thus, sublinear scaling of net advance with the size of the recipient population may be commonly observed.
Discussion
Selection on linkage blocks
The nature of genetic change (substitutionsvs.minor shifts in allele frequency) at individual loci during polygenic
adaptation and the resultant genomic signatures of such adaptation have attracted much interest recently (Pritchard et al. 2010). A key challenge is to disentangle the effect of selection on the allele frequency dynamics of the selected locus from the effect of linked selection due to nearby loci. Our anal-ysis shows that these two kinds of selection act over different time scales and together shape thefixation probability of dif-ferent variants on a single genome introduced into a geneti-cally homogeneous population. We identify sets of loci that share the same short-term fate, by decomposing the genome into contiguous blocks that grow faster (under directional se-lection) than any parent block containing them. Each such block acts as a linkage unit: the initial introgression of loci within a block is governed by the rate of spread of the block (rather than the selective effects of individual loci) and is largely independent of other such blocks.
While the expected growth rates of linkage blocks provide a usefulfirst estimate for the variation of introgression proba-bility along the genome, a more refined estimate needs to account for several other factors, such as thefine-scale var-iation within successful fragments, the effects of linkage be-tween multiple successful fragments, and the effect of the background genome, which could attenuate or inflate the effective number of blocks introduced into the population.
The idea that a recombining genome under selection can be viewed as a collection of unlinked, effectively asexual seg-ments or linkage blocks is quite powerful, and allows for the calculation of neutral diversity using theoretical results for asexual populations (Neher et al. 2013; Good et al. 2014; Weissman and Hallatschek 2014). In our formulation, the intrinsic growth rate of a fragment of map lengthyand se-lective effectSyis proportional toSy2y;which is of the order of ffiffiffiffiffiffiffiffiV0y
p
2y; if the full introduced block is neutral
ðS1;L¼0Þ: This is the maximum for a characteristic map lengthy*}V0or, alternatively, for a characteristic number of loci given byL*s2=c2;wheres2is the variance of selective effects of individual variants andcthe rate of recombination between adjacent selected variants. Thus, on average, blocks of map length y* should grow faster than any parent block
Figure 6 Introgression probability of the single-locus variant at locusion the introduced blockvs. i, as obtained from individual-based simulations (red) and as predicted by Equation 5 (green), for an introduced block that is (A) neutral with respect to the recipient populationðS1;L¼0Þ, (B) beneficial
ðS1;L¼0:05Þ, or (C) deleteriousðS1;L¼ 20:05Þ:Each of the three blocks has map lengthy0¼0:4 andL¼2048 loci, with selective effects drawn from a distribution with meanm¼S1;L=Land variances2¼0:001=L(subject to the constraint that the effects of all loci add up toS1;L). In each set of
containing them. This heuristic derivation for the length of linkage blocks is consistent with the expectations of Neher et al.(2013) (see Equation 5 in that study), modulo a loga-rithmic correction arising from the dependence offitness var-iance on population size. However, unlike earlier work, our analysis does not just yield anaveragelinkage scale, but ex-plicitly decomposes a specific genome into linkage blocks of different sizes by accounting for local variations of selective effect along the genome.
Selection on individual loci and net advance under selection
While the expected growth rate of linkage blocks shows a high correlation with the long-termfixation probability of individual variants within these (Figure 3B) and can capture the coarse-grained variation of introgression probabilities along the intro-duced block reasonably well (see Figure 6A), there can be con-siderable fine-scale variation of introgression probabilities of individual variants within each such linkage unit. In fact, this
fine-scale variation often reflects differences in selective effect of variantswithina successful block (Figure 3C). As we illustrate by means of a toy example, the efficacy of selection atfine scales depends on the rate at which afit blockfixes in the population, relative to the rate at which recombination can generate and bring together fragments of the block into evenfitter combina-tions that lack some of the deleterious variants present in the original block. In larger populations, the latter rate is larger, resulting in finer-scale sifting of deleterious variants with in-creasing population size at long time scales.
The extent to which selection can eliminate individual deleterious variants embedded within a favorable background
determines the net response under selection. Robertson (1970) derived approximate expressions for the net advance due to selection acting on standing variation contributed by linked loci of equal effects (spread over map length l) and found that the net advance in a population of sizeNis signif-icantly reduced relative to the advance under free recombina-tion, whilelis less than the selection intensity. Importantly, for tight linkage, the net advance scales sublinearly with Nfor small N, but approaches a linear dependence for larger N. Our results are broadly consistent; the net advance increases with increasing map length. Further, it scales approximately linearly with Nfor the longest block (weakest linkage), but shows a much weaker (sublinear) dependence onNfor tighter linkage between loci (Figure 7).
Selective effects associated with highly replicable loci
Our analysis shows that highly replicable substitutions may be associated with a wide range of selective effects, and can even be deleterious if the density of selected variants on the genome is high (see Figure 3D or Figure 4). The fraction of deleterious substitutions during adaptation is lower when the trait value is determined by fewer, widely-spaced loci of stronger effect. In this case, a typical linkage block contains fewer (}s2=c2) loci; thus, the selective effect of a locus makes a larger pro-portional contribution to, and hence shows a stronger corre-lation with, its expected growth rate. Then, deleterious loci are less likely to be present in an initially successful fragment and to hitchhike during the initial phase of introgression. Moreover, even those deleterious variants that attain high frequencies have a greater chance of being eliminated in the long run (oncefine-scale recombination starts isolating individual loci), due to stronger selection against individual variants. However, note that a wider DFE actually results in a higher fraction of deleterious substitutions (due to stronger hitchhiking), unless the density of selected variants is corre-spondingly low (Figure 4).
Interestingly, differences in replicability among tightly linkedvariants are informative about the effect sizes of these variants; missing or polymorphic variants (that decline in frequency) within genomic regions with high overall intro-gression probability are typically associated with deleterious effects. By contrast, differences in introgression probabilities of loosely linked loci (that belong to different linkage blocks) reflect how the strength of linked selection varies along the genome and cannot be explained by differences in selective effects of individual loci (contrast Figure 3, C and D). In general, our study underlines the need for a cautious ap-proach toward interpreting patterns of introgression or ad-aptation in replicates, and suggests that it is more difficult to ascribe adaptive significance to individual substitutions than to clusters of such substitutions. While genomic re-gions with multiple replicated substitutions (which corre-spond to successful blocks in our model) are typically important for adaptation, individual substitutions within these may be nearly neutral (even if they occur across rep-licates, see Figure 3D).
Figure 7 The net advance relative to ffiffiffiffiffiffiffiffiffiffiV0y0 p
;vs.sizeNof the recipient population, for introduced blocks of different lengthsy0:A given block consists ofLuniformly spaced loci; the allelic effects are drawn from a Gaussian distribution with mean 0 and variances2¼0:4=L(for the block of lengthy0¼0:05), such that the effects across all loci sum to 0. For the other (longer) blocks, we scale the allelic effects with ffiffiffiffiffiy0
p
Interpreting genomic islands of divergence
Genomic regions where the native haplotype persists (i.e., for which the introduced haplotypes fail to introgress) would appear as islands of divergence between the recipient and source population (Strasburget al.2012). In our model, such regions are associated with introduced fragments that have a negativeexpected growth rate in the recipient population. Note that such fragments need not have deleterious effects; negative growth rates can also be associated with moderately beneficial fragments that are nevertheless broken up faster by recombi-nation than they are amplified by selection. Such fragments may be completely lost from the population, especially when introduced at a low frequency into the recipient population. Thus, in this model at least, the hybridization history (steady geneflowvs.sporadic migration events) can be an important factor determining whether extended regions of differentiation are necessarily correlated with barriers to geneflow.
Replicability during adaptation to a phenotypic optimum
Our model considers an additive trait under directional se-lection, and thus ignores epistasis and genetic redundancy, which can strongly influence replicability (Yeaman 2015). A common scenario is one where the additive trait is under sta-bilizing selection toward a different optimum in the recipient population. If introduced haplotypes are far from thefitness optimum, then they effectively experience directional selection, causing adaptive fragments within these to be amplified, much as in the present model. In the long run, closer to the optimum, the redundancy of different genomic fragments that make sim-ilar contributions to the phenotype may play an important role. Understanding how the initial spread of adaptive fragments constrains long-term introgression patterns along the genome in this case is an interesting direction for future work.
Genetically heterogeneous donor and recipient populations
Our model assumes that the recipient population is genetically homogeneous and that the initial hybridization event involves introduction of multiple copies of thesamegenomic block into the recipient population. Further, all replicate populations receiveidenticalgenomes from the donor population. Thus, these assumptions effectively ignore variation within the source and recipient population, and just focus onfixed differ-ences between the two. Most theoretical work on introgression and barriers to geneflow makes similar assumptions (Barton and Bengtsson 1986; Ueckeret al. 2015). However, genetic heterogeneity within the donor and recipient populations is likely to qualitatively impact patterns of introgression and the extent to which these are convergent across replicate pop-ulations, and is thus a natural extension to consider.
The present analysis provides some intuition in a scenario where a few nonidentical haplotypes are introduced into a genetically homogeneous recipient population: genomic fragments that have high expected growth rates and are present in multiple copies among the introduced haplotypes
are expected to introgress with high probability. However, genetic variation within the donor and recipient populations can have other important consequences. Small recipient pop-ulations may exhibit significant inbreeding depression due to segregation of deleterious recessive alleles. Alleles from a diverged population then have a heterotic advantage, even if they are deleterious within the recipient population. In fact, heterosis has been suggested as a possible reason for the persistence of Neanderthal-derived variants in modern hu-man populations (Harris and Nielsen 2016).
Efficacy of selection
We have considered the contribution that a single intro-duced genome makes to a homogeneous population. A nat-ural extension is to consider the efficacy of selection within a heterogeneous population. Initially, there is a set of genomes, each carrying alleles at very many loci that have a distribu-tion of effects, both positive and negative. We can focus on one of these genomes and ask what contribution it makes to the final selection response; the expected response of the whole population is the sum of the expected contributions of each initial genome. The key differences from the analy-sis presented here are that a genomefinds itself competing against other genomes that are themselves improving under selection, and that itfinds itself associated with other genomes that have random effects on the trait. Afirst step might be to simply treat the rest of the population as having a mean and variance determined by classical quantitative genetics, and ask whether an analysis focused on a single genome in this variable background can give a good approximation.
We have contrasted two regimes: one where the fate of an allele depends on its own selective effect and another where selection acts on fragments of genome whose effects onfitness depend on very many loci. This contrast is closely related to the more practical question of when we can detect individual causal alleles, by genetic mapping or an association study, or instead can only attribute genetic variance to regions of the genome. An important question for the future is tofind ways to determine when it is appropriate to deal with discrete loci rather than take a statistical approach; or better, how to combine these two representations of genetic variation to understand real genetic architectures.
Acknowledgments
We thank Christelle Fraisse for useful comments on the manuscript.
Literature Cited
Barton, N. H., 1995 Linkage and the limits to natural selection. Genetics 140: 821–841.http://www.genetics.org/content/140/ 2/821
Barton, N. H., A. M. Etheridge, and A. Véber, 2017 The infi nites-imal model: definition, derivation, and implications. Theor. Popul. Biol. 118: 50–73.https://doi.org/10.1016/j.tpb.2017.06.001
Bengtsson, B. O., 1985 Theflow of genes through a genetic bar-rier, pp. 31–42 inEvolution Essays in Honour of John Maynard Smith, edited by J. J. Greenwood, P. H. Harvey, and M. Slatkin. Cambridge University Press, Cambridge, UK.
Bulmer, M. G., 1980 The Mathematical Theory of Quantitative Ge-netics. Oxford University Press, Oxford.
Burke, M. K., J. P. Dunham, P. Shahrestani, K. R. Thornton, M. R. Roseet al., 2010 Genome-wide analysis of a long-term evolu-tion experiment with Drosophila. Nature 467: 587–590.
https://doi.org/10.1038/nature09352
Chan, Y. F., F. C. Jones, E. McConnell, J. Bryk, L. Büngeret al., 2012 Parallel selection mapping using artificially selected mice reveals body weight control loci. Curr. Biol. 22: 794–800.
https://doi.org/10.1016/j.cub.2012.03.011
Conte, G. L., M. E. Arnegard, C. L. Peichel, and D. Schluter, 2012 The probability of genetic parallelism and convergence in natural populations. Proc. Biol. Sci. 279: 5039–5047.https:// doi.org/10.1098/rspb.2012.2146
Eigen, M., J. McCaskill, and P. Schuster, 1988 Molecular quasi-species. J. Phys. Chem. 92: 6881–6891.https://doi.org/10.1021/ j100335a010
Elyashiv, E., S. Sattath, T. T. Hu, A. Strutsovsky, G. McVickeret al., 2016 A genomic map of the effects of linked selection in Dro-sophila. PLoS Genet. 12: e1006130. https://doi.org/10.1371/ journal.pgen.1006130
Good, B. H., A. M. Walczak, R. A. Neher, and M. M. Desai, 2014 Genetic diversity in the interference selection limit. PLoS Genet. 10: e1004222.https://doi.org/10.1371/journal.pgen.1004222
Harris, K., and R. Nielsen, 2016 The genetic cost of Neanderthal introgression. Genetics 203: 881–891.https://doi.org/10.1534/ genetics.116.186890
Hartfield, M., and S. P. Otto, 2011 Recombination and hitchhik-ing of deleterious alleles. Evolution 65: 2421–2434.https://doi. org/10.1111/j.1558-5646.2011.01311.x
Hermisson, J., and P. S. Pennings, 2005 Soft sweeps: molecular population genetics of adaptation from standing genetic varia-tion. Genetics 169: 2335–2352.https://doi.org/10.1534/genetics. 104.036947
Kimura, M., 1957 Some problems of stochastic processes in ge-netics. Ann. Math. Stat. 28: 882–901.https://doi.org/10.1214/ aoms/1177706791
Lässig, M., V. Mustonen, and A. M. Walczak, 2017 Predicting evolution. Nat. Ecol. Evol. 1: 77.https://doi.org/10.1038/s41559-017-0077
Manceau, M., V. S. Domingues, C. R. Linnen, E. B. Rosenblum, and H. E. Hoekstra, 2010 Convergence in pigmentation at multiple levels: mutations, genes and function. Philos. Trans. R. Soc. Lond. B 365: 2439–2450.https://doi.org/10.1098/rstb.2010.0104
Neher, R. A., T. A. Kessinger, and B. I. Shraiman, 2013 Coalescence and genetic diversity in sexual populations under selection.
Proc. Natl. Acad. Sci. USA 110: 15836–15841. https://doi. org/10.1073/pnas.1309697110
Nordborg, M., B. Charlesworth, and D. Charlesworth, 1996 The effect of recombination on background selection. Genet. Res. 67: 159–174.https://doi.org/10.1017/S0016672300033619
Pritchard, J. K., J. K. Pickrell, and G. Coop, 2010 The genetics of human adaptation: hard sweeps, soft sweeps, and polygenic ad-aptation. Curr. Biol. 20: R208–R215.https://doi.org/10.1016/j. cub.2009.11.055
Robertson, A., 1960 A theory of limits in artificial selection. Proc. R. Soc. Lond. B Biol. Sci. 153: 234–249.https://doi.org/10.1098/ rspb.1960.0099
Robertson, A., 1970 A theory of limits in artificial selection with many linked loci, pp. 246–288 inMathematical Topics in Popu-lation Genetics, edited by K. Kojima. Springer, Berlin.https:// doi.org/10.1007/978-3-642-46244-3_8
Robertson, A., 1977 Artificial selection with a large number of linked loci, pp. 307–322 in Proceedings of the 1st Interna-tional Conference on Quantitative Genetics, edited by E. Pollak, O. Kempthorne, and T. B. Bailey Jr. Iowa State University Press, Ames, IA.
Sachdeva, H., and N. H. Barton, 2018 Introgression of a block of genome under infinitesimal selection. Genetics 209: 1279– 1303.https://doi.org/10.1534/genetics.118.301018
Stern, D. L., 2013 The genetic causes of convergent evolu-tion. Nat. Rev. Genet. 14: 751–764. https://doi.org/10.1038/ nrg3483
Storz, J. F., 2016 Causes of molecular convergence and parallel-ism in protein evolution. Nat. Rev. Genet. 17: 239–250.https:// doi.org/10.1038/nrg.2016.11
Strasburg, J. L., N. A. Sherman, K. M. Wright, L. C. Moyle, J. H. Williset al., 2012 What can patterns of differentiation across plant genomes tell us about adaptation and speciation? Philos. Trans. R. Soc. Lond. B Biol. Sci. 367: 364–373.https://doi.org/ 10.1098/rstb.2011.0199
Uecker, H., and J. Hermisson, 2011 On thefixation process of a beneficial mutation in a variable environment. Genetics 188: 915–930.https://doi.org/10.1534/genetics.110.124297
Uecker, H., D. Setter, and J. Hermisson, 2015 Adaptive gene in-trogression after secondary contact. J. Math. Biol. 70: 1523– 1580.https://doi.org/10.1007/s00285-014-0802-y
Weissman, D., and O. Hallatschek, 2014 The rate of adaptation in large sexual populations with linear chromosomes. Genetics 196: 1167–1183.https://doi.org/10.1534/genetics.113.160705
Yeaman, S., 2015 Local adaptation by small-effect alleles. Am. Nat. 186: S74–S89.https://doi.org/10.1086/682405
Yeaman, S., K. A. Hodgins, K. E. Lotterhos, H. Suren, L. K. Gray
et al., 2016 Convergent local adaptation to climate in distantly related conifers. Science 353: 1431–1433. https://doi.org/ 10.1126/science.aaf7812