University of Windsor University of Windsor
Scholarship at UWindsor
Scholarship at UWindsor
Electronic Theses and Dissertations Theses, Dissertations, and Major Papers
2008
Wind tunnel study on the wake bubble of model trucks
Wind tunnel study on the wake bubble of model trucks
Dongqing Yang University of Windsor
Follow this and additional works at: https://scholar.uwindsor.ca/etd
Recommended Citation Recommended Citation
Yang, Dongqing, "Wind tunnel study on the wake bubble of model trucks" (2008). Electronic Theses and Dissertations. 8253.
https://scholar.uwindsor.ca/etd/8253
This online database contains the full-text of PhD dissertations and Masters’ theses of University of Windsor students from 1954 forward. These documents are made available for personal study and research purposes only, in accordance with the Canadian Copyright Act and the Creative Commons license—CC BY-NC-ND (Attribution, Non-Commercial, No Derivative Works). Under this license, works must always be attributed to the copyright holder (original author), cannot be used for any commercial purposes, and may not be altered. Any other use would require the permission of the copyright holder. Students may inquire about withdrawing their dissertation and/or thesis from this database. For additional inquiries, please contact the repository administrator via email
WIND TUNNEL STUDY ON THE WAKE BUBBLE OF
MODEL TRUCKS
By
Dongqing Yang
A Thesis
Submitted to the Faculty of Graduate Studies through the Department of Mechanical, Automotive and Materials Engineering in Partial Fulfillment of the
Requirements for the Degree of Master of Applied Science at the University of Windsor
Windsor, Ontario, Canada 2008
1*1
Library and
Archives Canada
Published Heritage
Branch
395 Wellington Street Ottawa ON K1A0N4 Canada
Bibliotheque et
Archives Canada
Direction du
Patrimoine de I'edition
395, rue Wellington Ottawa ON K1A0N4 Canada
Your file Votre reference ISBN: 978-0-494-47019-0 Our file Notre reference ISBN: 978-0-494-47019-0
NOTICE:
The author has granted a
non-exclusive license allowing Library
and Archives Canada to reproduce,
publish, archive, preserve, conserve,
communicate to the public by
telecommunication or on the Internet,
loan, distribute and sell theses
worldwide, for commercial or
non-commercial purposes, in microform,
paper, electronic and/or any other
formats.
AVIS:
L'auteur a accorde une licence non exclusive
permettant a la Bibliotheque et Archives
Canada de reproduire, publier, archiver,
sauvegarder, conserver, transmettre au public
par telecommunication ou par Plntemet, prefer,
distribuer et vendre des theses partout dans
le monde, a des fins commerciales ou autres,
sur support microforme, papier, electronique
et/ou autres formats.
The author retains copyright
ownership and moral rights in
this thesis. Neither the thesis
nor substantial extracts from it
may be printed or otherwise
reproduced without the author's
permission.
L'auteur conserve la propriete du droit d'auteur
et des droits moraux qui protege cette these.
Ni la these ni des extraits substantiels de
celle-ci ne doivent etre imprimes ou autrement
reproduits sans son autorisation.
In compliance with the Canadian
Privacy Act some supporting
forms may have been removed
from this thesis.
Conformement a la loi canadienne
sur la protection de la vie privee,
quelques formulaires secondaires
ont ete enleves de cette these.
While these forms may be included
in the document page count,
their removal does not represent
any loss of content from the
thesis.
Canada
Bien que ces formulaires
Declaration of Co-Authorship/Previous Publication
I. Co-Authorship Declaration
I am aware of the University of Windsor Senate Policy on Authorship and I
certify that I have properly acknowledged the contribution of other researchers to
my thesis, and have obtained written permission from each of the co-author(s) to
include the above material(s) in my thesis.
I certify that, with the above qualification, this thesis, and the research to
which it refers, is the product of my own work.
II. Declaration of Previous Publication
This thesis includes one original paper that has been previously published for
publication in peer reviewed conference, as follows:
Thesis Chapter
Chapter 3,4
Publication title/full citation
Dongqing Yang, Shaohong Cheng, David S-K Ting, Wind Tunnel Study on the "Wake Bubble" of Model Truck, SAE Technical Series, 2008010739,2008
Publication status*
I certify that I have obtained a written permission from the copyright owner(s) to include the above published material(s) in my thesis. I certify that the above material describes work completed during my registration as graduate student at the University of Windsor.
I declare that, to the best of my knowledge, my thesis does not infringe upon anyone's copyright nor violate any proprietary rights and that any ideas, techniques, quotations, or any other material from the work of other people included in my thesis, published or otherwise, are fully acknowledged in accordance with the standard referencing practices. Furthermore, to the extent that I have included copyrighted material that surpasses the bounds of fair dealing within the meaning of the Canada Copyright Act, I certify that I have obtained a written permission from the copyright owner(s) to include such material(s) in my thesis.
I declare that this is a true copy of my thesis, including any final revisions, as approved by my thesis committee and the Graduate Studies office, and that this thesis has not been submitted for a higher degree to any other University of Institution.
Abstract
Acknowledgements
I would like to express my sincere thanks to Dr. Shaohong Cheng and Dr. David S-K Ting for their invaluable supervision, patience, encouragement and guidance
throughout this research. Sincere gratitude is also expressed to my committee members: Dr. R. Carriveau and Dr. G. Rankin for their helpful comments, suggestions and their valuable time.
The technical support from Mr. Andrew Jenner and Mr. Patrick Seguin is much appreciated. I would also like to thank the staff in technical support center for
their suggestions and helpful assistance. Special thanks to Ms. Yaoyao Zhang for her assistance during the flow visualization work.
I am also grateful to the research grants from the Natural Sciences and Engineering Research Council of Canada (NSERC) for this study.
Table of Contents
Declaration of Co-Authorship/Previous Publication iii
Abstract v Acknowledgements vi
List of Tables x List of Figures xi List of Abbreviations, Symbols, Nomenclature xv
3.1.1 Wind Tunnel 1 9 3.1.2 Elevated Plate 1 9 3.2 Vehicle Models 22
3.2.1 Truck Model Design 22 3.2.2 Truck Models 24 3.2.3 Sedan Model 27 3.3 Hotwire System 28 3.4 Flow Visualization Setup 30 Chapter 4 Results and Discussion 32 4.1 Shape Details Impact 32 4.2 Elevated Plate Impact 41 4.3 Three Dimensional Wake Bubble 45 4.4 Sedan and Truck in Tandem Arrangement 51 4.5 Reynolds Number Effect 53 4.6 Flow Visualization Using Tuft Grid 57 Chapter 5 Conclusions and Recommendations 61 References 6 4 Appendix A. Calculation of displacement thickness (wind tunnel board) 68 Appendix B. Uncertainty of a velocity sample 69 Appendix C. Sensitivity analysis 71 Appendix D.Traverse program (motion control of the traverse system) 77
-List of Tables
Table 2.1 Increasing the effective Re by screen application 11 Table 3.1 Comparison regarding elevated ground plate 21 -Table 3.2 Relative surface roughness of the simplified truck models (rectangular
block, rounded front model and generic model) 2 7 Table 4.1 Parameters in the first series of tests 34 -Table 4.2 Recirculation length of the models at Re=7x10⁵ 38 Table 4.3 Parameters in the rest series of tests 41 -Table 4.4 Recirculation length of the models (Re=7x10⁵, w i t h / without elevated
plate) 4 5 Table 4.5Detection of bubble for different truck models 50 Table 4.6 Detection of bubble on the real shape model 52 Table 4.7 Extrapolating the results (recirculation length of real shape model) 54 -Table 4.8 Comparison of recirculation length of the models between two
techniques (hotwire vs. tuft grid, under Re=7x10⁵, with elevated plate) 59
List of Figures
Figure 2.1 Ways for representing the road in a wind tunnel [Hucho, 1993] 7 Figure 2.2 Trailing vortices in the wake of a car [JSME, 1988] 8
Figure 2.3 Setup of road vehicle in the open test section [Wiedemann, 1989] 9 -Figure 2.4 Pressure distribution on a road vehicle at different Re: no screen
[Wiedemann, 1989] 1 0 -Figure 2.5 Pressure distribution on a road vehicle at different Re:Turbulence
modified by a screen [Wiedemann, 1989] 1 0
-Figure 2.6 Drag coefficient of a road vehicle without ground plane vs. Re
[Wiedemann, 1989] 11 Figure 2.7 Bluff bodies used for vehicle modeling [Allan,1981] 1 2 Figure 2.8 Ahmed body [Ahmed et al, 1984] 13 Figure 2.9 Sample of truck model [McCallen, 1999] 1 4 -Figure 2.10 Effect of slanting the blunt base of 3D bodies on drag coefficients
[Losito & Nicola, 1983] 15 -Figure 2.11 Horse shoe vortex system in the near wake region of an Ahmed body
1 6 -Figure 2.12 Schematic view of the road vehicle model and bubble length at two
Figure 3.2 Application of elevated plate (not to scale) 2 0 -Figure 3.3 Velocity profiles at 5 stations downstream of the elevated plate leading
edge and measured boundary layer along the plate 22 -Figure 3.4 Rounded front model Current study (solid line) vs. Duell & George's work (dash line) [1999] 23 -Figure 3.5 Three view drawings and the real picture of the rectangular block....-24-Figure 3.6 Three view drawings and the real picture of the rounded front model
2 5 Figure 3.7 Side and front views and the real picture of the generic model 26
Figure 3.8 Side and front views of scaled specific model 26 Figure 3.9 Side and front view of sedan model 28
-Figure 3.10 Hot-wire system [CTA: Dantec Streamline 55C90, I/O: shielded I/O connector block for DAQ devices, A/D: PCI6071E] 28 Figure 3.11 Experimental arrangement for smoke visualization 31 Figure 3.12 Experimental arrangement for tuft visualization 31 -Figure 4.1 Experimental arrangement for studying wake of the truck model: single
truckvertical central plane without elevated plate 32 Figure 4.2 Grid for data collection 33 Figure 4.3 Wake centerlines 35 -Figure 4.4 Near wake time averaged velocity distribution at the vertical central
plane and recirculation length 35
Figure 4.5 Bubble shape of the rectangular block and corresponding mean velocity
contour in the wake at Re=7x10⁵ 36
-Figure 4.6 Bubble shape of the rounded front model and corresponding mean
velocity contour in the wake at Re=7x10⁵ 36 -Figure 4.7 Bubble shape of the generic model and corresponding mean velocity
contour in the wake at Re=7x10⁵ 37
-Figure 4.8 Bubble shape of the real truck model and corresponding mean velocity
contour in the wake at Re=7x10⁵ 37
-Figure 4.9 Streamwise velocity distribution at the horizontal line where
Figure 4.19 Application of perforated plate 53 Figure 4.20 Bubble shape under different Re,"smooth flow" 55 Figure 4.21 Bbubble shape under different Re,"turbulent flow" 55 Figure 4.22 Recirculation length vs. Reynolds number (real shape model) 56 Figure 4.23 Tuft visualization: U=4.2m/s (left) and U=8.2m/s (right) 57 Figure 4.24Tuft visualization: U=11.5m/s (left) and U=14.7m/s (right) 58 Figure 4.25 Tuft visualization: U=4.2m/s (left) and U=8.2m/s (right) 5 8 Figure 4.26 Tuft visualization: U=11.5m/s (left) and U=14.7m/s (right) 5 8 Figure 4.27 Tuft visualization: X=0.5H downstream, 14m/s freestream 59 Figure 4.28 Tuft visualization: X=H downstream, 14m/s freestream 6 0 Figure 4.29 Tuft visualization: X=1.5H downstream, 14m/s freestream 6 0
List of Abbreviations, Symbols, Nomenclature
Acronyms
A/D
CTA DAQ GM HWA I/O RB RF RS 2-D 3-D
Analogue/Digital
Constant Temperature Anemometer
Data Acquisition Generic Model
HotWire Anemometry
Input/Output
Rectangular Block model
Rounded Front model Real Shape model Two-dimensional Three-dimensional
English symbols
Cd
c
Pe/D
H L
Re Tu Um
u„
V W X
Reynolds number=VL/ u Turbulent intensity (%)
Local mean velocity (m/s) Free stream velocity (m/s) Velocity (m/s)
Width of the model (m)
Distance between model base and downstream
Greek symbols
Point (m)
Kinematic viscosity of air (m2/s)
V Slant angle (°)
W,
Critical slant angle (°)
Chapter 1 Introduction
1.1 Background
Rarely are vehicles on the road alone. They typically pass or follow each other in close proximity, whether on the highway or on a racing track. The flow field of each vehicle is thus influenced by the presence of the other vehicles; in other words, the flow fields interact with each other [Hucho, 1998]. Large road vehicles generate relatively large wakes, the characteristics of which are worth studying as far as highway safety is concerned. In spite of many years of progress, our understanding on the flow characteristics in the near wake of the tractor-trailer shape vehicle, a common vehicle type on the road in North America, is still very immature.
1.2 Motivation
To better understand the fluid mechanics which affects vehicle fuel consumption, vehicle safety, and passenger comfort, it is necessary to study the time dependent near wake flow field behind ground vehicle bodies [Duell & George, 1999]. As far as vehicle aerodynamics is concerned, drag is always the focus of the research work, for a reduction in drag would lead to a reduction in fuel consumption. In general, there are two main kinds of drag a vehicle encounters on the road: the pressure drag and the friction drag. The drag of a road vehicle is primarily caused by the pressure deficit in the wake. Thus, among the flow fields of a road vehicle, the flow region in the near wake plays a key role on the aerodynamic performance of a road vehicle.
Many research works have been done to understand how flow around a vehicle affects its driving stability and drag [Allen, 1981& Ahmed, 1984]. Aerodynamic interaction between multiple bluff bodies, such as two cubes of the same geometrical size [Martinuzzi & Havel, 2004], has been extensively studied due to its practical significance in many engineering applications. Till now, the relevant works in studying the aerodynamic interference between vehicles of different sizes were mainly based on pressure measurement [Azim, 1994] and force measurement [Hammache et al, 2001]. Information obtained from detailed velocity
-measurement is expected to complement these studies, significantly advancing
present knowledge on road vehicle aerodynamics.
Moreover, the knowledge of how the details of vehicle shape affect the
aerodynamic performance is still lacking, and how much shape detail is needed to
maintain the real aerodynamic characteristics is also worth studying.
In short, a better understanding of wake bubble of the road vehicle is necessary, be
it a single one or following other vehicles, since the low-frequency oscillation inside
the vehicle wake bubble can affect the stability of the driver-vehicle combination.
Furthermore, once the relation between the wake bubble and the drag is
1.3 Objectives
1) For the single truck model measurement:
• Obtain the bubble length in the near wake of four truck models with
various levels of model details;
• By comparing the results, find out how the shape details affect the near
wake of truck models;
• Find out the impact of application of elevated plate on the characteristic of
the wake bubble.
• Extend the measurement to the side vertical planes to investigate the 3D
bubble feature.
2) For the sedan and truck in tandem arrangement (sedan in the front):
Conduct the hotwire measurement behind the truck model in order to find out
the impact of spacing of sedan and truck model on the wake structure.
3) Study the Reynolds number effect
-Chapter 2 Literature Review
2.1 Wind Tunnel Testing
The advantage of wind tunnel test is that data can be obtained on models (even in reduced scale) in a very early development phase, which allows an estimate of the dynamics of a vehicle concept long before drivable prototype is available.
However, wind tunnel tests cannot perfectly simulate the on road conditions [Hucho, 1998].The main limitations are:
i) The relative motion between vehicle and road is hardly reproduced; the floor should move with wind.
ii) On the road, a vehicle moves through a space of infinite dimensions ("free air"). In contrast, the dimensions of a wind tunnel test section are limited and comparatively small.
iii) Reynolds number which represents the real life scenario can hardly be reached.
2.1.1 Ground Simulation
building with a cross-sectional area at least several hundred times the model frontal area. This idea, while not impossible, is however, not economically practical [D. S. Gross et al, 1966]. In general, there are several ways to achieve the on road simulation.The simplest and conventional way is with a solid and fixed ground floor [Figure 2.1, a]. The drawback is that it may have considerable boundary layer effect; an improved method is raised, an elevated plate is applied so as to reduce the boundary layer effect [Figure 2.1, e], the length of the elevated plate required depends on the models to be tested but is commonly made the length of test section. The typical height will be three to five times the thickness of the floor boundary layer [Barlow et al, 1999]. A new and therefore thinner boundary layer begins along the plate; there is also mirror image method [Figure 2.1, b], model costs have to be doubled, moreover, the flow is not necessarily symmetrical. The moving belt [Figure 2.1, c] seems to represent a perfect approach as mentioned, despite lots of issues needed to be addressed properly: is the belt strong enough to support the weight of the model, how to synchronize the moving speed of the belt etc. There are other approaches dealing with boundary layer effect as well, such as boundary layer suction [Figure 2.1, d &g] and lift model above the boundary layer [Figure 2.1,f].
-Figure 2.1 Ways for representing the road in a wind tunnel [Hucho, 1993]
2.1.2 Flow Visualization
Flow visualization is an extremely powerful experimental technique for gaining
insight into the fluid flow [Granger, 1985]. A variety of flow visualization methods have been applied in vehicle aerodynamic field, such as smoke, tufts etc.
Smoke is the conventional way for flow visualization. By blowing smoke into an airstream,the course of airflow becomes visible. However, smoke cannot be used in recirculating flows. The smoke also tends to obscure parts of a three-dimensional model, so it is most often used to visualize two-dimensional models in narrow tunnels. Furthermore, smoke is awkward to handle.
up to 30m/s. If the tufts are in a wake, they will flutter around and point in random directions, often into the incoming free air stream [Smith, 1992].
Figure 2.2 Trailing vortices in the wake of a car [JSME, 1988]
2.1.3 Reynolds Number Effect
The scaling problem is frequently encountered in the aerodynamic research field since most wind tunnels are not big enough to accommodate full scale vehicles. The results from scaled model may be very misleading since the kinematic similarity can not be met. On the other hand, due to the high cost and uncontrollable environmental conditions, there are rare cases in which a full scale vehicle can be ground tested to operational speed. So methods of extrapolation are very important [Barlow et al, 1999].
In other words, the advantage of working with reduced-scale models are realized only if the results achieved with them can reliably be transferred to full scale. There are generally two paths leading to this target: Reynold' s law has to be strictly observed or by making use of other effects, a higher Re can be simulated. In road
-vehicle testing, it is fairly difficult to maintain the desired Re when scaled model is used, even the top speed is satisfied, the Mach number effects become noticeable at relatively low wind speed [Hucho, 1998].
In 1989, Wiedemann proved that for a complex configuration like road vehicle, it is effective to manipulate the turbulence of the oncoming flow in order to decrease the "effective" Re (For sphere, it was already proved by Dryden in 1936). More specifically, when a screen of adequate mesh and bar size in the wind tunnel inlet is used, pressure distribution corresponding to different Reynolds numbers nearly fall onto a single curve that is equivalent to an increase of the effective Reynolds number, see Figure 2.3-2.5 for details.
»,o-o t s
© •
— O . S
- 1 . S S
-st.o-—
se.s-- a . o 3 . S
-F l o x W * M o d e l s c a l e
-2 . 7
* • *
r T ~
-3 . -3 2 . 7
1:-» Jn;2.S
•
3 . 3
1 : 2 J S
r~*
i
5 . 2 I I r S L S J
Figure 2.4 Pressure distribution on a road vehicle at different Re: no screen [Wiedemann, 1989]
I J A«9 « 1 06
M o d o l s c a t o
—~ »i . 2 . 1 [ SL.7 | 12.7'
1 : 4 • l : - » l l r a . S ' *
«*
3 . 3
i : 2 - S 4 S 1:38. S
« < r « o s c r e w i ) 3.3S •"1:2.5
Figure 2.5 Pressure distribution on a road vehicle at different Re:Turbulence modified by a screen [Wiedemann, 1989]
There is a strong dependence of the pressure coefficient Cp on the Re, as can be seen in Figure 2.4. Figure 2.5 shows the pressure distribution for the same range of Re but with a screen mounted at the inlet. This time the results nearly fall onto a single line, which means there is no significant Re effect on pressure distribution if screen is applied. Moreover, it shows that the results of Re=5.2x10⁶ without screen case and Re=2.7x10⁶with screen case are almost identical.
0,32-0.48
0 44
0-36'
0.3.2-
0.S8-o . a * j .r . . , . . . .
OS OM 1.3 1.7 2.1 2.5 2-9 3,3 3.7 4 4 4J5 4,9 R e * 1 G6
Figure 2.6 Drag coefficient of a road vehicle without ground plane vs. Re
[Wiedemann, 1989]
For the drag coefficient measurement, see Figure 2.6, both screen 1 and 2 lead to a
considerable decrease of drag, the clean flow needs about Re=3.8x10
6to yield Cd=
0.3, using screen 1 for example, this can be achieved by Re=2.5x10
6. This is
equivalent to increase of the effective Re by a factor of 3.8/2.5=1.52.
Table 2.0.1 Increasing the effective Re by screen application
Screen mounted at the
wind inlet
Screen 1 Screen 2
Increase the effective Re by a factor of
[Pressure distribution on the model vehicle]
1.93* 1.93
Increase the effective Re by a factor of [Drag coefficient]
1.52 1.73
without screen mounted at the wind tunnel inlet. Thus the effective Re can be increased by a factor of 5.2x10⁶/2.7x106=1.93.
2.2 Road Vehicle Model
In vehicle aerodynamics, ground vehicles can always be termed as bluff bodies moving in close vicinity of the road surface. In the simplest case, a rectangular block can be used to model a road vehicle. Figure 2.7 shows some simple bluff bodies used by Allan [1981] when studying the flow field around the tractor-trailer type vehicle.
Figure 2.7 Bluff bodies used for vehicle modeling [Allan,1981]
The main problem with simplified bluff shapes is that they may not accurately reflect the complex aerodynamic shape of vehicles. In order to obtain the essential features of the flow field around a real vehicle, Ahmed body [Ahmed et al, 1984], as
illustrated in Figure 2.8, was developed for studying aerodynamics of passenger vehicles. Ahmed body is a simple model which can provide the strong
-three-dimensional flow in the front, relative uniform flow in the middle and large
structured wake at the rear of a real passenger car, without worrying about the unique features associated with different vehicle models.
H » t 8 2 - *
WW
210
610-.83
202
Unit: mm
388-470 H»163, SKA
6
Figure 2.8 Ahmed body [Ahmed et al, 1984]
Figure 2.9 Sample of truck model [McCallen, 1999]
2.3 Wake Structure of A Road Vehicle
Based on flow visualization and interpretation of the aerodynamic force measurements, vehicle wake can be classified into four categories depending on
the rear slant angle W [Losito & Nicola, 1983], see Figure 2.10 for details.
1. W=90° (square back type): Axisymmetric wakes with well organized bubble flows in the near wake.
2. Wc<xI;< 9 0o (where ^ c is the critical angle): Three-dimensional wakes without embedded vortices.
3. W< Vc. Three-dimensional wakes with strong embedded longitudinal vortices.
4.0< w < WC: Three-dimensional wakes with weak vortices.
-, o . 5 . 3 , 1
-BASE SLANTED BODIES
/r
>
0
*
/ 1 , ( 1,
i
I 1
i
3-D Wakes w i t h s t r o n g embedded v o r t i c e s
3-0 Wakes wi Cheat ambeddecf v o r t i c e s
J
- a J L _ ™ j _ „..__ x _
•3 < l 4»rnme 11" i c Wakes
2 0
3 - 0 Whites w i t h w e a k v o r t i c e s
•40 * _
V o r t e x Breakdown
SO *
Figure 2.10 Effect of slanting the blunt base of 3D bodies on drag coefficients [Losito& Nicola, 1983]
According to case 1 listed above, in the near wake region of a tractor trailer, well established large bubbles with a recirculating flow is evident.
is a very complex separation region characterized by shear layers, unsteadiness,
recirculation and streamwise vorticity.
Figure 2.11 Horse shoe vortex system in the near wake region of an Ahmed body
Figure 2.11 illustrates the near wake region of a typical Ahmed body: "A" and "B"
are the two recirculatory regions; "C" is the longitudinal vortex, the "separation
bubble" is indicated by "D". Both "A" and "C" depend mainly on the slant angle
while "B" depends primarily on the ground clearance gap [Ahmed et al, 1984]. For a
model without slant angle, which is the case considered in this study, the vortex "C"
hardly occurs.
An important characteristic of the near wake recirculation region is the
recirculation length, X
r. It is defined as the distance between the model base and
the mean location of the free stagnation point, as depicted in Figure 2.12. The
location of the time-averaged free stagnation point can be deduced from the
minimum of U
m/Uoo, (where U
mis the local mean velocity and U» is the free stream
velocity) or, the maximum of the root mean square fluctuating velocity intensity.
-16-N e a r w a k e region with V o r t e x u p p e r a n d lower t r a p p e d period doubling
vorticies in s h e a r l a y e r
D e v e l o p i n g far w a k e
region
G r o u n d p l a n e F r e e stagnation point
U .
C
V o r t e x s h e d from s h e a r layer
Figure 2.12 Schematic view of the road vehicle model and bubble length at two successive time [Duell & George, 1999]
The free stagnation point of a separated flow is a quasi-periodically fluctuating point that shifts as vortices are shed from the shear layer that bounds the recirculation region [Duell & George, 1999], see Figure 2.12. The near wake velocity distribution is worth measuring since it determines the near wake size and locates the free stagnation point.
2.4 Wake Investigation Using Hot-wire Anemometry
It is generally recognized that hot wire anemometry is not ideal for velocity measurements in recirculating flows for two reasons: first, this technique can only measure the velocity magnitude normal to the hotwire but not associated flow directions. Also, the measured value of the local mean velocity becomes less accurate in highly turbulent flow fields. However, the velocity distribution obtained can still indicate the recirculation region. Measuring the near wake velocity distribution is important because it indicates the size of the near wake and can show any fundamental changes that have occurred to the near wake [Duell & George, 1993].
-Chapter 3 Experimental Details
3.1 Test Setup
3.1.1 Wind Tunnel
In the present study, the experiments were conducted in a closed-loop wind tunnel as shown in Figure 3.1. The wooden-ground, steely-top test section of the wind tunnel has an overall dimension of 4m (Length) X 0.76m (Width) X 0.76m (Height). The free stream flow at the wind tunnel inlet is relatively smooth (Tu=0.5%) and the
maximum obtainable velocity is around 20m/s.
Figure 3.1 Wind tunnel
3.1.2 Elevated Plate
According to Garni [2003], a fixed tunnel board is adequate for the study of ground vehicle as long as the displacement thickness of the ground boundary layer
clearance. Current displacement thickness of the boundary layer at the location of rear truck corresponds to 6% of the vehicle model ground clearance. Therefore, the effect of the fixed tunnel board is expected to be small. See Appendix A for details. Nevertheless, an elevated ground board is fairly often used, mainly when a large wind tunnel is used for small-scale experiments [Hucho, 1998], since at the leading edge, a new boundary layer starts growing, but at zero thickness which results in a better boundary layer condition.
Figure 3.2 Application of elevated plate (not to scale)
The elevated plate is made of wood, it has a painted smooth surface, and the leading edge is sharpened as can be seen in Figure 3.2 in order to minimize the up wash flow. The overall geometry of the elevated plate is 1.52m (L) X 0.73m (W) X 0.02m (H). The length of the plate is twice the length of truck model; full span is used: the width of the plate is 0.03m (1 inch) less than the width of the tunnel for the sake of easy installation; the thickness of the plate is set to minimize possible vibration.
-Barlow [1999] suggested that the clearance of the plate should be three to five times the thickness of the floor boundary layer. The measured floor boundary layer thickness is 0.04m (1.5 in) at the location of rear truck. So the clearance should fall in between 0.11-0.20m (4.5-7.5 in). The ground clearance of elevated plate is finally set to be 0.15m (6 in) after several trials of boundary layer thickness measurement.
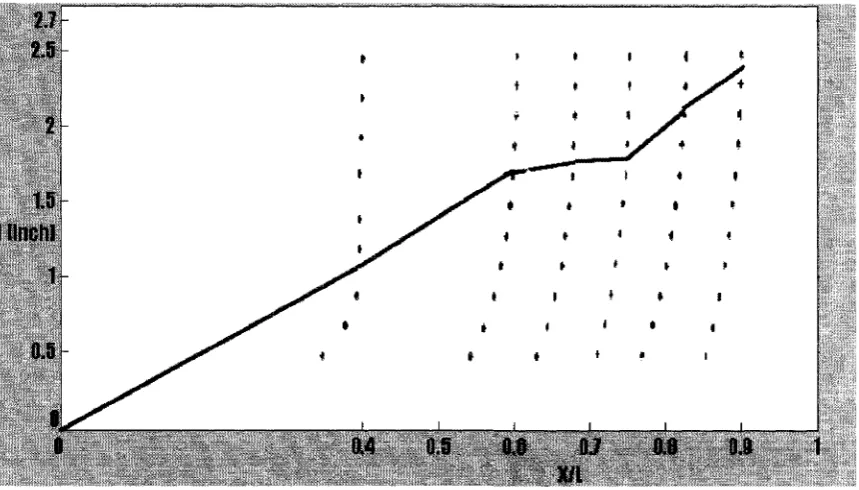
Table 3.1 shows the comparison of current work with Garry's work [1991 ] regarding the elevated ground plate. The overall dimensions are quite close. Figure 3.3 illustrates the boundary layer growth along the elevated plate measured by hotwire system. The dimensionless distance X/L has been used, where X is the distance from the leading edge and L is the length of the elevated plate.
Table 3.0.1 Comparison regarding elevated ground plate
Current study
Garry, 1991
Test section
m X m
(inXin)
0.76X0.76
(30X30)
0.91X0.91
(36X36)
Thickness of the plate
m(in)
0.02
(0.75)
0.02
(0.87)
Clearance of the plate
m(in)
0.15
(6)
0.18
(6.89)
span
full
2.7 2.5
0.4 0.5 0.6 U
X/L
1.8 0.1
Figure 3.3 Velocity profiles at 5 stations downstream of the elevated plate leading edge and measured boundary layer along the plate
3.2 Vehicle Models
3.2.1 Truck Model Design
There is no typical or classical truck model developed by previous works. In this study, the "rounded front" truck model is proposed following the idea of the Ahmed body used for passenger vehicles. It has the same size as the real shape truck model, which is 1:24 scaled down. The rounded front end is based on the
scale of the Ahmed body in order to generate a strong three dimensional
-displacement flow at the front. The slant angle at the back of the Ahmed body is kept as zero to maintain the box shape of the road truck at its back.
Typically, the ground clearance of a road-going truck is very large when compared to the thickness of a controlled boundary layer on the floor of a modern wind tunnel. Hence, the correct ground flow conditions have been considered less critical than for low-ground-clearance vehicle (sedan) [Barlow et al, 1999]. Usually a good boundary layer suction system can be used to improve the ground flow conditions. In this study, four simple stilts are utilized (the model body is above the boundary layer at the measuring position) to support the model body since the underbody flow condition is not the main concern.
; j
i n r
IFD—
inrtn?
O
,« s~
• n 1 " o
* =
_» * • " """ "^ - • a r ;
I
1
O 1
Figure 3.4 Rounded front model Current study (solid line) vs. Duell & George's work (dash line) [1999]
width, the main difference is that our model is about twice the length of Duell and Geroge's model.
3.2.2 Truck Models
In order to investigate the model shape effect, four truck models with various levels of model details are used in present study. Listed from simple to complex, they are:
Rectangular block (1:24, wood)
The rectangular block, similar to that used by Duell and George [1999], is used as an idealized bluff body. The details of this model are portrayed in
Figure 3.5.
t
0.173 m
11'
front view
050 m
1
top view
ft
1
V
A
V
ieai
side view 0,101a
Figure 3.5 Three view drawings and the real picture of the rectangular block
-• Rounded front model (1:24, wood)
This proposed model is a modification of the rectangular block. The only difference is the rounded front end, see Figure 3.6. The ratio of the radius to body height is based on that used in the Ahmed body [Ahmed et al, 1984].
t
i:
L
r
r -'R»W)l3s
V
0.050 m
r
R«0«3w
front view
[
top view
' ' y i '
i
u
rear end
side view
O.WSm
Figure 3.6 Three view drawings and the real picture of the rounded front model
Generic model (1:24, foam)
0.762 m 0.108 m
r* -t
r
^ ^ T A
l . v . v ' v k ^
Figure 3.7 Side and front views and the real picture of the generic model Scaled specific model-Kenworth T-600B
(1:24 die—cast metal & ABS resin)
The detailed model truck is a 1:24 scale replica produced from original engineering drawing of Kenworth and Great Dane, which represents a typical tractor-trailer type on the North American road. Figure 3.8 shows the side and
front views of this model.
Figure 3.8 Side and front views of scaled specific model
The model has a frontal area of 0.0187m2 and the cross sectional area of the wind tunnel is 0.5806 m2, thus the blockage ratio is 3.2%. With the elevated plate, this value goes up to 4.1%, which is still less than the upper limit of 5% blockage ratio, beyond which corrections of blockage effect should be applied [Hucho 1998].
Table 3.2 shows the comparison of surface roughness of the three simplified truck models. The data was collected using a SJ-2019 Surface Roughness Tester. As can be seen from the table, the overall relative surface roughnesses of the three
simplified truck models are all in the order of 106.
Table 3.0.2 Relative surface roughness of the simplified truck models (rectangular block, rounded front model and generic model)
Relative
roughness: e/D *
Rectangular block Rounded front model
Generic model
Top
6x10"6 10x10-6
13X10"6
Front
5x10"6 7x10"6
10X106
Side
7x10⁻⁶ 8x10⁻⁶
5x10⁻⁶
Overall
6x10⁻⁶ 8x10⁻⁶
9x10⁻⁶
Note: e is the absolute magnitude of the surface roughness, which was collected using the SJ-201P surface roughness tester (Unit: urn); the magnitude of the model height D=177.8mm.
3.2.3 Sedan Model
Scaled specific model-Nissan skyline R34 GT-R (1:24 scale)
MOTrn
Figure 3.9 Side and front view of sedan model
3.3 Hot-Wire System
Hot-wire anemometry (HWA) is likely to remain the principle research tool for most turbulent air flow studies. It is based on convective heat transfer from a heated wire or film element placed in a fluid flow. Any change in the fluid flow condition that affects the heat transfer from the heated element will be detected virtually instantaneously by a constant-temperature HWA system. HWA is used in this study to quantify the flow fluid around the truck model. Figure 3.10 is a photo of the hot-wire system used in this study.
Figure 3.10 Hot-wire system [CTA: Dantec Streamline 55C90, I/O: shielded I/O connector block for DAQ devices, A/D: PCI-6071E]
-Constant Temperature Anemometer (CTA)
The current hot-wire anemometer is the Dantec Streamline® 55C90 CTA modules
installed within a Dantec 90N10 frame. The 55C90 module contains a constant temperature anemometer and a signal conditioner. The 90N10 frame is used as
power supply, controller and a temperature transducer. PCI-6071EA/D board
The current A/D converter installed on the motherboard of the CPU is National Instrument PCI-6071E. It is a multifunction data acquisition board which has a 12 bit resolution.
SCB-68
The communication between the hot-wire anemometer and the A/D board is made
possible via a National Instrument SCB-68 shielded I/O connector block. It is for data acquisition devices with 68-pin connectors which can provide rugged, very low-noise signal termination.
Traverse system
The traverse system for the hot-wire probe and the temperature probe support and movement is an Animatics® SmartMotor SM2315D. It is mounted downstream of the tested truck model and fixed on the wind tunnel floor using screws. It can be controlled manually or by computer using the 2D smartmotor motion program. Calibration
B15 Essex Hall coupled with a Pitot static tube as well as a digital manometer for velocity measurement reference. Before each experiment, the calibration is conducted to establish the relationship (4th order polynomial) between the air velocity and the output voltage of the hot-wire probe. The pitot tube system is replaced by a new auto calibrator from Dantec during the remaining work.
Data acquisition
Data acquisition software developed by Rui Liu will be utilized with modifications according to different experimental tasks. The motions of the traverse system and data collection are programmed to be automatically carried out. The motion control of the single normal probe and data acquisition is well coordinated; the task is accomplished with two programs (see Appendices C, D).
3.4 Flow Visualization Setup
To assist in identifying the truck wake structure, flow visualization was performed by using fog machine and tuft grids. As can be seen in Figure 3.11, the fog machine is placed beneath the wind tunnel board, and fast dissipate solution is used. The smoke was injected in front of the model.
-dark background digital wind
H>
-smoke model board fog machiner
Figure 3.11 Experimental arrangement for smoke visualization
Visualization of tuft grid is depicted in Figure 3.12. The tuft grid is mesh of wire, with tiny string tied at each intersection. Two sets are used, one with 1 inch grid size, the other one with 1/3 inch grid size.
free stream.
o
model tuft grid V V x x X . X X . X X . V V V xl X , X V X V X X x X. X ' X • x
' x .
x . x V, X X V X X V x. 'x x . X x X. X 'x •x x . X . X ' X X x X , X \ elevated plate
Figure 3.12 Experimental arrangement for tuft visualization (vertical central plane)
free stream I
model
3C
tuft grid Pa \ elevated plateChapter 4 Results and Discussion
4.1 Shape Details Impact
The first series of wind tunnel tests aims at studying the impact of model details on the wake characteristics of a truck model. The truck model was placed right at the central line of the wind tunnel ground board, see Figure 4.1. The testing area covers the vertical central plane right behind the truck model.
Figure 4.1 Experimental arrangement for studying wake of the truck model: single truck-vertical central plane without elevated plate
During the tests, the single hot-wire probe was mounted (along with a temperature probe for correcting the fluid density and viscosity change from the calibrated conditions) on the traverse system downstream of the model, the movement of which was controlled by a smartmotor program.
-The grid used for hot-wire measurement is illustrated in Figure 4.2. -The area covered is 5.25 inch (0.133m) in width and 5 inch (0.127m) in height. The starting position of the probes is 1 inch (0.025m) downstream from the model base in order to avoid potential probe breakage. The height of the area covered by the testing grid is the same as that of the model body.
Klin
model truck
? i n
< 5 . 2 5 i n —s.
5 in
il.x
x—^—^—\ \—^—^—v—\ \—s;—^—^ v
Figure 4.2 Grid for data collection
For each model, two grid systems were used. Each grid is 11 by 11, resulting in 242 measurement points in total. The two grid systems span the same vertical range, and overlap 0.25 inch (0.635m) in the horizontal direction. The reason for using this two-grid-system scheme is to make sure the suggested trend of near wake mean velocity distribution (see Figure 4.7) exists in single grid as well as in the two-grid-system. During the experiment, at each grid point, the instantaneous velocity was recorded over a period of approximately 28 seconds. The data was sampled at 75 kHz and subsequently, low-pass filtered at 30 kHz. The sampling number was chosen to be 2,097,152 to ensure that no important information was
value is sufficient, the ideal sampling number is around 1,600,000 (See Appendix C
and Table 4.1 for details).
Table 4.0.1 Parameters in the first series of tests
Sampling number
2097152
Sampling frequency
75 kHz
Free stream wind speed
14m/s
Max Reynolds number
7x10E5
Blockage ratio
3.2 %
As depicted in Figure 4.2, there are 11 lines in the horizontal direction of the grid system. The distribution of the mean velocity at each line can be determined from measured data along these lines. The near wake mean velocity distribution along some of these 11 lines is similar to that obtained by Duell and George [1993], as can be seen in Figure 4.4. Therefore, the recirculation length Xr was deduced from the distance between the model rear end and the grid point where the first derivative of the velocity with respect to streamwise distance x is zero and the second derivative is positive. In other words, Xr is the distance from the model rear end to the point where the slope of velocity profile in the streamwise direction is 0 and curvature is upward (positive), see Figure 4.4. This stagnation point [Duell & George, 1993] can be obtained via curve fitting.
-.. _,, « w
^^^*
I" r ***>
• I 1 C '
Y
L-^x
>v >v V V \ ^v s. V X. \
Figure 4.3 Wake centerlines
5 ^
I
.-^
^ ^ V s ^
~« o . •* Si o . ^ ^ o - ass
o - %
«»
« — —
t - y ^ - * «r>
1
•Figure 4.4 Near wake time averaged velocity distribution at the vertical central
plane and recirculation length
Current study (upper one) vs. Duell & George's work [1993]
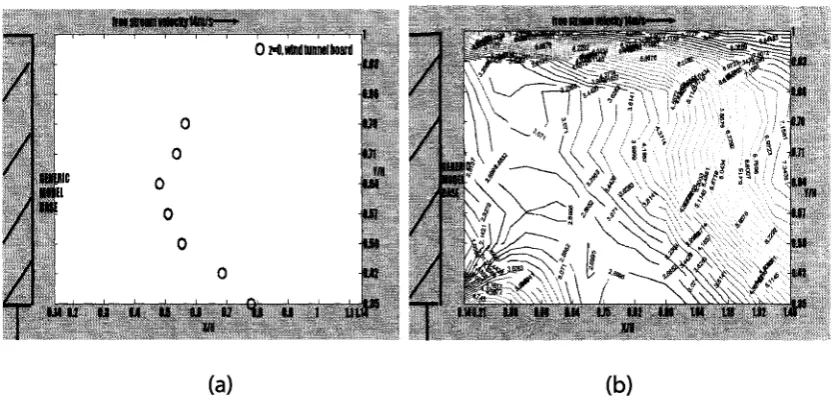
curve fitting. The mean velocity contour and derived bubble shape for the four
truck models at Re=7x10⁵are plotted in Figures 4.5 - 4.8. Table 2 presents the summary of recirculation length Xr of these different truck models obtained from the current work.
/ / / /
T
KthMt•LOCK iun
0 o
1
0 >o.wlnltunrwlboatd u i
MS U I i n M UI M l an
i l "
/
/
/
/
T
IICTUCifl iUCIt n
mmmmtiWi—->•,•€--- ' A - • I
\N
/ / .
2K
-?
^B fAftw ™i"Wl4 610038
IIH
WH
i n
. M l
Ml
M l
m i * Ml ui "'«£''jpiiiig;. <* d»~-,«», imA"
(a) (b)
Figure 4.5 Bubble shape of the rectangular block and corresponding mean velocity contour in the wake at Re=7x10⁵
immmmmmmp-/
/
/
T
O z-O.wHidtuiuialbaard 0 Oi M M l M l M l «,V " '
UI U I u i M l m ua i si Ml I I I
/
/
/
/
f
W-. - ^ • J ^ I B a B r a1
' y ^ ^ - 4 \ ' • / ; * '•/ , 5 i S r :5 & ^ S i ? ^
• . a 4 -!
360111 , ^% I
1H U t
H I
t
:
'
(a) (b)
Figure 4.6 Bubble shape of the rounded front model and corresponding mean velocity contour in the wake at Re=7x10⁵
-36-frostrwnwfcteilm/s- _tMW«ilPWI / / / 0 Hwlndtiiniteltoaid IEKIIC UIEI INI
1.11 U M M U U K Hi U I LILll IiH (a) us Ul 1.1 U) Ul • 58 III as
, V \ J I Tl * • 1
/ \
-u"?'
v \ \ \
\M.-T"
» / ' 5 = 'w
Ml
we I
471
IN I *
>*c
Ml 1
Ml
t
J M
Mill 111 I I I I I I M I I I IN IH 119 Id* 1
vt
4"
(b)
Figure 4.7 Bubble shape of the generic model and corresponding mean velocity contour in the wake at Re=7xl 05
MTnilUl«ttl!K»IMWW«Mlft——» / / / /
T
0 z-0. wind tunnel beard
UK IIIFE WDEL IUE 0 c Ul I H
.Vf
U l U l MSI.H U l III UP Ul III 1° if
MIPS/ /
i
in
Ml Ul
~<\>»r , ui
/
/
* T
v
•\\f
Mill Ul Ul III I I Ml IN Ui I I Ul
W Ul Ul Ml IH uP
(a) (b)
Figure 4.8 Bubble shape of the real truck model and corresponding mean velocity
Table 4.0.2 Recirculation length of the models at Re=7x10⁵ Model/
Recirculation length
Xr/H
RB
0.64
RF
0.78
GM
0.78
RS
1.02
Note: RB=Rectangular Block, RF=Rounded Front model, GM=Generic Model, RS=Real Shape model.
/
/
/
MODEL BASE
* * * *
D rectangular block O rounded front model
A A A
AA
<$#o<>^
A
0.6
0.5
0.4
0.8
0.2
0.1
X/H
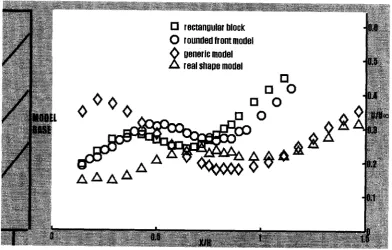
Figure 4.9 Stream wise velocity distribution at the horizontal line where recirculation length can be determined
-/
/
/
/
T
free stream velocity
14m/s-D
O ractannulBr Hottc raumiaitlMit nodal 1 ooneiltmottef
§
MODEL BASE A OO a
0 o
AO
O A O A0.14 0.20 0.43 0.57
X/H
0
0.71 0.80 A A 1 0.93 0.86 0.70 0.71 0.04 0.57 0.5Y/H 0.42 0.351.1
J
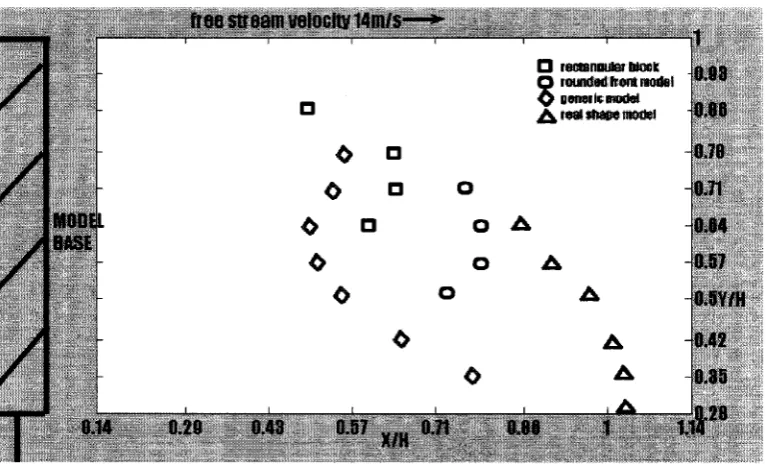
2flFigure 4.10 Comparison of bubble shapes of all the truck models
The shapes of the wake bubbles as shown in Figures 4.5 and 4.6 are similar to that obtained by Duell and George [1999] (compare Figures 4.5 and 4.6 with Figure 2.12). For the rounded front model and the rectangular block, the extents of the wake bubble are in the proximity of the horizontal centerline of the models. The
difference between these two sets of results is that the rounded front model has a relatively larger (longer) near wake region than that of the rectangular block, i.e., a recirculation length of 0.78 versus 0.64 —the reason may be that the flow separation is delayed for the rounded front model.
The largest discrepancy exists in the generic model case— two bubbles can be identified in the near wake with the upper one being relatively small. The demarcation of these two bubbles is near the horizontal centerline. As for the shape, the lower bubble appears to have a different curvature, i.e., concaving downstream.
To sum up, the real shape model has the longest near wake region in the streamwise direction, while the rectangular block has the shortest. The length of the wake bubble of the rounded front model is literally identical to that of the generic model, and they are larger than the wake bubble of the rectangular block but shorter than that of the real shape model. Concerning the shape of the wake bubble, the bubble moves downward and away from the model base as more model details are included. The generic model appears to show a double- (or dual-) bubble, but this has not been confirmed in the real truck model case. See Figure 4.7 and 4.8 for details.
-Figure 4.11 Smoke visualization of wake flow behind a real shape truck model
4.2 Elevated Plate Impact
The remainder of the wind tunnel tests is with an elevated plate. Table 4.3 shows the parameters used. There are minor changes compared with Table 4.1.
Table 4.0.3 Parameters in the rest series of tests
Sampling number
1600000
Sampling frequency
75kHz
Free stream wind speed
14m/s
Max Reynolds number
7x10E5
Blockage ratio
4 . 1 %
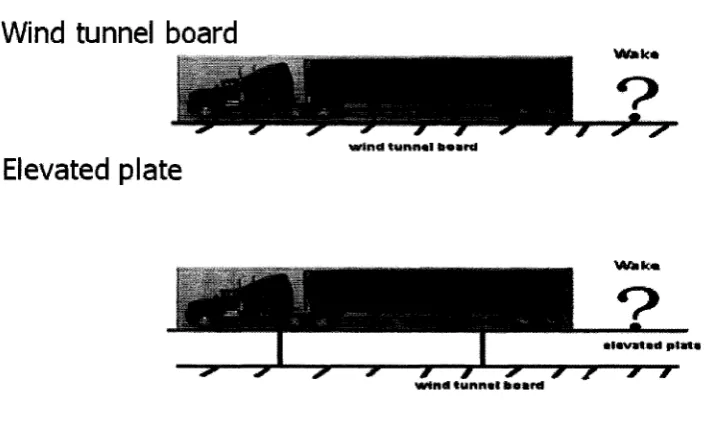
Wind tunnel board
wintt tunnai Hoard
Elevated plate
wtnif tunnal board
Figure 4.12 Different ground simulations
The results obtained in the first series of tests are in the central plane which is plane z=0.
As mentioned before, the hotwire measurement in the first series of tests has been
repeated after the elevated plate is applied. Figure 4.13 shows the bubble shape of all the four models under two different ground simulations.
Generally speaking, there is not much difference between two sets of results regarding the central plane bubble shape despite minor discrepancies, which somehow proves the effect of boundary layer is small, see Appendix A for details.
-I T M straam wioclty Mtn/s
I
4
U C H W 6 D U I •LOCK
• M E
0.14 (US OQ HD DD D O O
• " x/. 0J1
a
z*9. wind ttmwi board *-*. with afairaMd plateB M 1 1
)1 M l : M S
0J8 0J1 M 4 V/M M 7 M O M 2 0.85 L
JP
Figure 4.13(a) Bubble shape of the rectangular block
wind tunnel board vs. elevated plate
/
fraa sti earn wtacNy
Mm/s-BBBrtQEO n)0NT
/
/
I « « MO M l M7 »J1
X/M
E» *»0, «rtn« tunnel board O z«0. elevated slate O
E© d
oo
DM l 1 1 M 1 i M S M S •0JI •OJt •AM ' V/R 0JB7 -MO • M 2 M S
tiH
8tree stream wttoclty Mm/s
-8ENERIC
MftBEl BASE
O i-6. with atouaiwl plate
u i-B. wind tunnel Board <0JJ
O 0JBB
On
BJIC O 0J7
O • OJBD
0 D 042
0.M 8.2 0.3 04 OS 04 OJ S j M 1 t l l l P
X/H
Figure 4.13 (c) Bubble shape of t h e generic m o d e l
W i n d t u n n e l b o a r d vs. elevated plate
nm True* raocfet «mn tender, tr ee uream wtoetiv Mm/s •
.1
5
/
/
/
O i-0.\«tli««uaifliniato 0 4 *
REM SHAPE •BBEL BASE BJH X/B BJt
O n
o
fip
On
KBI I 048 0J0 BJI 04« 04? MB 04! 0461.JP
B.M MB 04*Figure 4.13 (d) Bubble shape of the real shape model
Wind tunnel board vs. elevated plate
-For the remaining series of tests, the real shape model has been changed to a similar model with fender. It seems that for the recirculation length, there is no difference.
See Table 4.4 for comparison of the two ground simulations (with and without
elevated plate) regarding recirculation length.
Table 4.0.4 Recirculation length of the models (Re=7x10⁵, w i t h / without elevated plate)
Model/
Recirculation length
Xr/H
RB
0.64/0.66
RF
0.78/0.78
GM
0.78/0.65
RS (new model with
fender)
1.02/1.02
4.3 Three Dimensional Wake Bubble
wind "tunnel • t e c * s e c t i o n
• t r a v e r s e ys-fcen
Figure 4.14 Experimental arrangement for studying wake of the truck model: single truck case-vertical side planes
The three dimensional characteristic of the wake bubble is also a main concern in this study. The wake region of the truck models has been divided by several vertical planes. Due to the symmetry of the incoming flow throughout the truck model, only the positive side (z=w/8, w/4, 3w/8, w/2) have been investigated, see Figure 4.15.
• | .
• i *
> •w1
1
1
1
1
1
1
1
1
1
I
1
1
1
«»»«.«, p,a„a j
1
1
1
1
1
u
Figure 4.15 Back view of vehicle model
-46-It turned out that at some of the vertical planes, there are also bubble shapes that
can be deducted. Basically, the bubble shrinks and vanishes as the plane moves
from the central plane (z=0) to the side edge (z=w/2), the bubble is fully three
dimensional. See Figure 4.16 for more information.
Rectangularblock
z^w/8 z=0
U=14m/s
ST"
L-»IT"
m « tit i a I n rs Kf •J"' >. »
O
Or o r^
IV ., IN
• I I 1
lift
11 O f
in
m • 1 1 . I k l
» - •
, i i "
IIIN M l
• M J
Wfl
i ir
Rounded front model
z=-w/4 z=-w/8 2=0
U=14m/s
E
Ml
nth'
n i l tvll h i I .fell
I—
! • • •
LV
Figure 4.16 (b) Three dimensional bubble of rounded front model
-z=-w/8 z=0
^ i f
U=14m/s
o
a
a
o
i u 11 rj M •i ft IJ nj u 1
\
Real shape model
^ > „ .
14m/si i i 3 i a « • «• an ft.
tlH 411 I I " i.Tl J I
U 9 i n JLII IIR >;» • • • I M Kit I ftl* L i t
I U HE
Figure 4.16 (d) Three dimensional bubble of real shape model Table 4.0.5Detection of bubble for different truck models
location Central plane Z=0 Z=±1/8W Z=±1/4W Z=±3/8W (close to the
side edge) Rectangular block Yes Yes No No Rounded front model Yes Yes Yes No Generic model Yes Yes No No Real truck model Yes Yes No No
-It seems that the rounded front model has the largest bubble region, which extends to z = ± w/4. While for the rest of the models, it extends to z = ± w/8, which means the bubble vanish somewhere between w/8 and w/4.
4.4 Sedan and Truck in Tandem Arrangement
A sedan model is introduced, and sedan and truck in tandem case has been studied. The result shows the bubble shrinks at the central plane (z=0) while extends at the side plane (z=±w/8) as the spacing between the leading sedan and followed truck decreases. Furthermore, the scope of the bubble does not change because of the presence of the leading sedan. See Figure 4.18 for more details.
Table 4.6 presents the existence of bubble for the sedan and truck in tandem case.
Table 4.0.6 Detection of bubble on the real shape model
location Central plane Z=0 Z=±w/8 Z=±w/4 Spacing: 0.5H Yes Yes No Spacing: H Yes Yes No no sedan Yes Yes No \
Real shape model
U=14m/s
••>••£
an Rfe ^ ! rijaIII IIP WJ HI III M l I iff
• • 1fc • * •
• • ^ y •*•
• » ^ * * ^ i n
0.5H spacing H spacing no sedan \ • • • • • • • • ^ ^
• B i l l 1 * f l < l
v.S"
• * 1 «M
v.n ix w >.K M M l
Figure 4.18 Three dimensional bubble of real shape model: Sedan and truck in tandem
-4.5 Reynolds Number Effect
The Reynolds number effect has also been investigated.
The last set of experiments concerns the Reynolds number effect. All the results
presented so far in this study are under the condition of 14 m/s free stream velocity,
which corresponds to approximate 3km/h for the real life scenario. Thus,
extrapolating the result is necessary. Based on the turbulence manipulation
method (Wiedeman, 1989), we conducted a set of measurements attempting to
find a way to reduce the Reynolds number effect in this study.
A perforated plate is applied, the detailed dimension is shown in Figure 4.19, and it
basically covers the whole cross section of the wind tunnel.
30 inch t £
30 ind O O O O O O O O O O O i
^w—v*™v—*TT—y*,"'''-v'"Y^^ i n c n
Here we define the tests with no screen mounted at the wind tunnel inlet as "smooth flow" case, if screen is on, then it is "turbulent flow" case. The distance between the screen and the front of the truck model is about 30 inch; the turbulent intensity generated is 3.0% as measured. Table 4.7 shows the cases tested for extrapolation, for both "smooth flow" and "turbulent flow" cases, the recirculation lengths are almost identical within the range of Re=4x10⁵ to 7x10⁵.
Table 4.0.7 Extrapolating the results (recirculation length of real shape model)
Re based on the model
length
Smooth flow
[X/H]
Turbulent flow [X/H]
2x10s (4m/s)
1.23
0.91
4x10⁵ (8m/s)
1.00
0.99
5X10⁵ (11 m/s)
1.03
1.06
7x10⁵ (14m/s)
1.02
1.01
As can be seen in Figure 4.20 and 4.21, it seems that if screen is applied, then the bubble shape can be preserved well under lower Re.
-/
/
/
/
T
Q 4B1/S flailA t t a t l t
REM SHUfPE MODEL MSE
0.14 020 040 0.S7 fender
0.71
X/H
A
A 0
& i *
. -1.14D
• • i
I I I
M l «.»
*n
9.84 V/M 8.J7 O.S0 •OJ42 •.ISI *
-/
/
Figure 4.20 Bubble shape under different Re,"smooth flow"
D 4m/s Q 8m/s O Hm/s A 14m/s REAL SHAPE MODEL RASE
0.14 0.20 0.43 0.97 fender
<¥®
4*>
n
O^A
A
O A
X/H 1,14 1 0.03 0.00 0.70 0.71 0.04 V/H 0.57 0.50 0.42 0.05
1.
2P
0.9
0
— turnuient now
Figure 4.22 shows recirculation length vs. Reynolds number in a testable range for a
single real shape model case.
1.25- -- —
:1.2-
LB11
-lecfrculsdon
teflflffi
m
105-
1-0.95
MJE5 MJE5 M M
RmnoUsnunlNf
MKfl
10E6
Figure 4.22 Recirculation length vs. Reynolds number (real shape model) All in all, taking consider both recirculation length and bubble shape, and based on Wiedeman's work in 1989, we may say that we can use Re=4x10⁵ with screen case (recirculation length=0.99) to extrapolate Re=7x10⁵ Clear flow (recirculation length
:1.02).
-56-4.6 Flow Visualization Using Tuft Grid
Since smoke is hard to handle and it is difficult to tell the bubble shape from the
smoke visualization at the preliminary stage, see Figure 4.11, a tuft grid is used.
All the tuft grid visualization was done using the real shape model. See Figures
4.23-4.26 for visualization in the vertical central plane.
Figures 4.27-4.29 illustrate the transverse plane visualization, the horse shoe type of
vortex occurs though it is not very clear.
Figure 4.23 Tuft visualization: U=4.2m/s (left) and U=8.2m/s (right)
Figure 4.24 Tuft visualization: U=11.5m/s (left) and U=14.7m/s (right) 1 inch grid size
Figure 4.25 Tuft visualization: U=4.2m/s (left) and U=8.2m/s (right) 1/3 inch grid size
Figure 4.26 Tuft visualization: U=11.5m/s (left) and U=14.7m/s (right) 1/3 inch grid size
![Figure 2.1 Ways for representing the road in a wind tunnel [Hucho, 1993]](https://thumb-us.123doks.com/thumbv2/123dok_us/1503001.1183975/24.616.167.491.74.284/figure-ways-representing-road-wind-tunnel-hucho.webp)