HIGHLIGHTED ARTICLE
| INVESTIGATION
Bayesian Inference of the Evolution of a Phenotype
Distribution on a Phylogenetic Tree
M. Azim Ansari* and Xavier Didelot†,1 *Oxford Martin School, University of Oxford, Oxford OX1 3BD, United Kingdom, and†Department of Infectious Disease Epidemiology, Imperial College London, London W2 1PG, United Kingdom
ABSTRACTThe distribution of a phenotype on a phylogenetic tree is often a quantity of interest. Many phenotypes have imperfect heritability, so that a measurement of the phenotype for an individual can be thought of as a single realization from the phenotype distribution of that individual. If all individuals in a phylogeny had the same phenotype distribution, measured phenotypes would be randomly distributed on the tree leaves. This is, however, often not the case, implying that the phenotype distribution evolves over time. Here we propose a new model based on this principle of evolving phenotype distribution on the branches of a phylogeny, which is different from ancestral state reconstruction where the phenotype itself is assumed to evolve. We develop an efficient Bayesian inference method to estimate the parameters of our model and to test the evidence for changes in the phenotype distribution. We use multiple simulated data sets to show that our algorithm has good sensitivity and specificity properties. Since our method identifies branches on the tree on which the phenotype distribution has changed, it is able to break down a tree into components for which this distribution is unique and constant. We present two applications of our method, one investigating the association between HIV genetic variation and human leukocyte antigen and the other studying host range distribution in a lineage of Salmonella enterica, and we discuss many other potential applications.
KEYWORDSchangepoint model; inheritability; phenotypic plasticity; phylogenetic tree; trait evolution
U
NDERSTANDING phenotypic variations and their rela-tive association with genotypic variations is one of the central aims of molecular biology. The expression of a phe-notype is usually dependent on both genetic and environ-mental factors, with heritability measuring their relative importance (Visscher et al.2008). When the heritability is nonzero, genetically similar individuals are more likely to have similar phenotypes, and this is especially relevant for species that reproduce clonally, so that closely related individ-uals are virtually identical genetically. However, genotype– phenotype maps are usually complex and phenotypic plasticitymeans that phenotype expression can differ even for geneti-cally identical individuals due to dependency on environmen-tal factors (DeWitt et al. 1998; Agrawal 2001). Conversely, observing closely related individuals with the same phenotype does not necessarily imply a low importance of environmental factors, since close relatives are also likely to live in the same environmental conditions (Visscher et al. 2008). The same effect also occurs in sexually reproducing species as evolution-ary forces such as spatial population structure, environmental pressures, and inbreeding result in groups within which indi-viduals are more genetically homologous, and therefore more phenotypically similar, than individuals from different groups (Pritchardet al.2000; Lawsonet al.2012).
To understand the relationship between a phenotype and a genotype, it is necessary to investigate how the phenotype is distributed according to genotypic values. This requires quan-tifying how the genotypes are related to each other, which is often achieved using phylogenetic trees (Yang and Rannala 2012). For clonal organisms, the tree may represent the clonal genealogy of how individuals are related with one another for nonrecombinant regions (Didelot and Falush Copyright © 2016 Ansari and Didelot
doi: 10.1534/genetics.116.190496
Manuscript received April 18, 2016; accepted for publication July 7, 2016; published Early Online July 11, 2016.
Available freely online through the author-supported open access option.
This is an open-access article distributed under the terms of the Creative Commons Attribution 4.0 International License (http://creativecommons.org/licenses/by/4.0/), which permits unrestricted use, distribution, and reproduction in any medium, provided the original work is properly cited.
Supplemental material is available online atwww.genetics.org/lookup/suppl/doi:10. 1534/genetics.116.190496/-/DC1.
1Corresponding author: Department of Infectious Disease Epidemiology, Imperial
2007; Didelotet al.2010). For sexual organisms, the phylog-enies may be built for individual genomic loci, resulting in so-called gene trees by contrast with the species tree that contains them (Maddison 1997). Visual inspection of a phy-logenetic tree with tips annotated by phenotypes gives afirst impression of their relationship, and this type offigure fea-tures heavily in the molecular biology literature of both clonal and sexual organisms. A more quantitative approach is, however, needed if the tree is too large to be shown, if the interesting patterns are too subtle to be seen, or to estimate evolutionary parameters and test competing hypotheses.
Phylogenetic comparative methods can be used, for exam-ple to test the phylogenetic signal in a phenotype (Hillis and Huelsenbeck 1992; Blomberget al.2003) or to compare the association between two phenotypes given the phylogeny (Garlandet al.2005), but do not provide a complete descrip-tion of the phenotype distribudescrip-tion on a tree. One of the most popular phylogenetic comparative methods is ancestral state reconstruction of the phenotype given the tree (Cunningham
et al.1998; Pagel 1999). Application of this method can pro-vide quantitative insights, for example an estimate of the phenotypic evolutionary rate. The maximum-likelihood ap-proach to ancestral state reconstruction (Yang et al.1995) has been extended in many ways by refining the model of phenotypic evolution on the tree, for example by allowing the detection of branches where the phenotypic evolutionary rate changes (Revell 2008; Revellet al.2011). However, an-cestral state reconstruction is problematic for any phenotype with imperfect heritability: Identical genotypes can then have different phenotypic values, implying an infinitely high rate of phenotypic evolution between them that is not biologically meaningful. Other difficulties arise if the phylogeny is imper-fectly reconstructed or the phenotype inaccurately measured, which is always a possibility. Consequently, ancestral state reconstruction does not always provide reliable results, for example when applied to phylogeography (De Maio et al.
2015).
When heritability is not complete, a phenotypic measure-ment can be seen as just one realization from the phenotypic distribution of a given individual, with this distribution being what evolves on the tree rather than the phenotypic measure-ment itself. Based on this idea, here we present a novel Bayesian statistical method that takes as input a phylogenetic tree and discrete tip phenotype measurements and iden-tifies the branches on which the phenotype distribution has changed. The tree is therefore divided into monophyletic and paraphyletic groups that have unique distributions over the phenotype space. We also perform Bayesian hypothesis testing (Kass and Raftery 1995) to assess whether there is evidence for different parts of the tree having distinct pheno-type distributions. We build a stochastic model in which changepoints occur on a phylogenetic tree (Didelot et al.
2009), each of which affects the distribution of observed phenotype for the descendent leaves. Careful parameteriza-tion enables the use of a fixed-dimension Markov chain Monte Carlo (MCMC) algorithm (Gilkset al.1995) to sample
from the posterior distribution of the model parameters, and we reserve reversible jumps (Green 1995) to compare the model with a model without any changepoint. In the follow-ing sections we present our model, our inference procedure, and the results of simulation studies to measure the sensitiv-ity and specificity of our method. Finally we present the ap-plication of our method to two real data sets in human immunodeficiency virus (HIV) evasion and bacterial ecology.
Model and Methods
Description of the model
We consider that changepoints happen as a Poisson process with ratelon the branches of the input tree. For a phenotype withKcategories, we model each changepoint event as a new probability mass function q¼ ðq1;. . .;qKÞthat specifies the
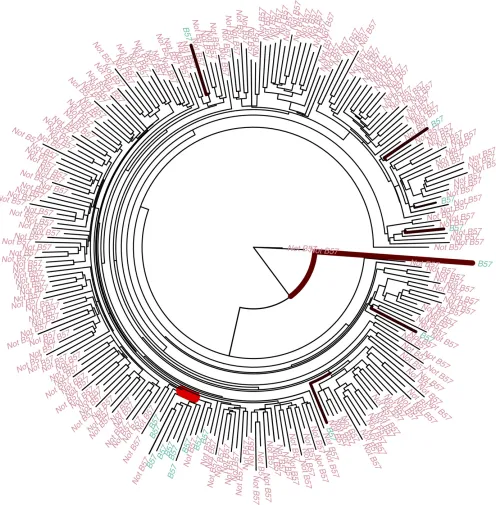
probability of having each of theKphenotypes for the indi-viduals affected by the changepoint. Figure 1 illustrates the model forK¼2:The observed phenotype of each individual is shown on the tips of the tree, which are colored black and red. Changepoints have happened on three branches that divided the tree into four sections (white, blue, green, and yellow). All individuals in the same section have the same distributionqover the phenotype space.
LetNandBdenote the number of tips and branches in the tree, respectively (if the tree is bifurcating, thenB¼2N22). We defineb¼ ðb1;. . .;bBÞas a binary vector withBelements
that represent the branches of the tree. If branchiholds at least one changepoint, thenbi¼1;otherwisebi¼0:Letm
denote the number of sections of the tree divided according tob(Figure 1). The likelihood of the observed phenotypes of the individualsDis given by
pðDjq1;. . .;qm;bÞ ¼ YK
j¼1 qx1j
1j⋯ YK
j¼1 qxmj
mj; (1)
where qi¼ ðqi1;. . .;qiKÞ and qij gives the probability
that an individual in section i expresses phenotype j, so that PKj¼1qij¼1 for i¼1;. . .;m: We also define xi¼ ðxi1;. . .;xiKÞ;wherexijis the number of observed
indi-viduals in sectionithat have expressed phenotypej, so that
Pm i¼1
PK
j¼1xij¼N:
Assuming that the length of branchiis known, the prior probabilities of branchihaving no or at least one changepoint are respectively Prðbi¼0jlÞ ¼e2lli and Prðbi¼1jlÞ ¼
12e2lli;so that
PrðbjlÞ ¼Y
B
i¼1
e2lli
12bi 12e2lli
bi
: (2)
We consider a flat Dirichlet prior for all qi such that
pðqiÞ ¼GðKÞand an exponential prior onlwith mean 1=T;
whereT¼PBi¼1liis the sum of the branch lengths of the tree.
We are now in a position to describe the posterior distri-bution of the model parametersqi;. . .;qm;bandl:
pðq1;. . .;qm;b;ljDÞ ¼pðDjq1;. . .;qm;b;lÞpðq1;. . .;qm;b;lÞ=pðDÞ }pðDjq1;. . .;qm;bÞpðq1Þ. . .pðqmÞpðbjlÞpðlÞ }ðGðKÞÞmQm
i¼1
QK j¼1
qxij ij
QB s¼1
e2lls12bs12e2llsbsTe2Tl: (3)
The dimensionality of the model parameters changes withbas the number of sections on the tree depends on band each section has its own distribution over the phenotype space. This could potentially be addressed using reversible jumps (Green 1995). Instead we marginalize all the qi;which
re-sults in afixed-dimension model. The marginal posterior den-sity forbandlis given by
pðb;ljDÞ ¼Rq1⋯ R
qmpðDjq1;. . .;qm;bÞ
3pðq1Þ⋯pðqmÞdq1⋯dqmpðbjlÞpðlÞ=pðDÞ
}ðGðKÞÞmQm i¼1
QK j¼1
R1 0q
xij ijdqij Te2Tl
QB s¼1
e2lls12bs12e2llsbs
}ðGðKÞÞmQm i¼1
QK
j¼1Gðxijþ1Þ
GKþPK
j¼1xij
Te2TlY B
s¼1
e2lls12bs12e2llsbs:
(4)
Inference
We use a MCMC (Gilks et al. 1995) to sample from the posterior distribution ofbandl. We use a symmetric pro-posal forbwhere the proposed valueb⋆ is the same asb
except for one randomly chosen branch i for which
b⋆i ¼12bi: Therefore if the randomly chosen branch i
holds a changepoint in b;it does not hold a changepoint inb⋆and vice versa. To updatelwe propose from a normal density with mean equal to the current value of l and variance equal to 0.1;i.e.,l⋆jl N ðl;0:1Þ:When the pro-posed l⋆ is lower than zero, the move is rejected and the chain stays at l. The calculation of the Metropolis–
Hastings acceptance ratios is given in Supplemental Mate-rial,File S1.
Model selection
We want to assess whether there is any evidence for differ-ential distribution of phenotypes on different parts of the tree. We compare our model (indexed 1) against the null model (indexed 0) of no changepoints on the tree, which is equivalent to l¼0; by calculating the Bayes factor (Kass and Raftery 1995) for the two models. To do this we use reversible-jump moves (Green 1995) to sample from the joint distributionpððj;ujÞjDÞ;wherejis the index of the model and
uj is the parameters of model j. For a move from null to
alternative (0 to 1) model, to match dimensions we generate two random variables u and v and map them such that ðl⋆;b⋆Þ ¼ ðu;vÞ:In addition we set the proposal distribution for uandv;qðu;vÞin model 0 to be the same as the prior distribution onlandbin model 1. Thus for a proposed move from model 0 to model 1 we have
qðu;vÞ ¼qðuÞqðvjuÞ ¼Te2TuY B
i¼1
e2uli
12vi 12e2uli
vi :
(5)
The probability of acceptance of this move is given by
hðð0Þ/ð1;ðl⋆;b⋆ÞÞÞ ¼1∧ pð1;ðl
⋆;b⋆ÞjDÞpð1/0Þ
pð0jDÞpð0/1Þqððu;vÞj0Þ
@@ðlðu⋆;;bv⋆ÞÞ
¼1∧ pð1;ðu;vÞjDÞpð1/0Þ
pð0jDÞpð0/1Þqððu;vÞj0Þ31
¼1∧pðDjðu;vÞ;1Þpððu;vÞj1Þpð1Þpð1/0Þ
pðDj0Þpð0Þpð0/1Þqððu;vÞj0Þ
¼1∧pðDjðu;vÞ;1Þpð1/0Þ
pðDj0Þpð0/1Þ :
(6)
A move from model 1 with parameters ðl;bÞ to model 0 is made deterministically and is accepted with probability
hð1;ðl;bÞÞ/ð0Þ¼1∧ pðDj0Þpð0/1Þ
pðDjðl;bÞ;1Þpð1/0Þ: (7)
We set pð1/0Þ ¼0:05 andpð0/1Þ ¼0:5 and we assume the prior probabilities of the two models are equal,
pð0Þ ¼pð1Þ ¼0:5:
Simulation studies
To investigate the performance of our method, we performed two simulation studies, each of which involved repetition over many simulated data sets. In all of these simulations for simplicity we used a binary phenotype and sampled from the posterior distribution of the model parameters, using 107
iterations of our MCMC algorithm. All of these simulations were implemented for a single genealogy simulated using the coalescent model (Rosenberg and Nordborg 2002) with 1000 leaves shown in Figure S1. First, we tested how the number of individuals affected by a changepoint and the magnitude of the change in phenotype distribution affect the statistical power to detect a changepoint. Second, we tested the model selection procedure and the relationship between the posterior expectation of number of changepoints and the true numbers of changepoints. Third, we quantified the effect of threshold on the point estimate ofb:
Data availability
All the methods described in this article are implemented in a software package called TreeBreaker, which is freely available for download at https://github.com/ansariazim/ TreeBreaker.
Results
Simulation study of statistical power
This simulation study was designed to assess the power of the method to detect changepoints on the branches of the tree. The power depends on two factors: the magnitude of the change in the distribution over the phenotype categories, which we refer to asp, and the number of individuals affected by the changepoint, which we refer to asn. The probability of each phenotype is 0.5 before the changepoint, and after the changepoint the probability of one phenotype increases byp
whereas the probability of the other phenotype decreases by
p. Changepoints with smallpare difficult to detect as they result in small changes to the observed pattern of distribution of phenotype that are likely to happen by chance alone. Changepoints with small n are also difficult to distinguish as lack of data makes the inference more uncertain. We ex-pect that changepoints with largepand largenare easier to detect.
The space of n3p was divided into a grid where n¼
ð10;30;60;130;330;500Þ and p¼ ð0:1;0:2;0:3;0:4;0:5Þ: For each node of the gridðni;pjÞ;50 data sets were simulated
where in each case an appropriate branch of the tree shown in Figure S1 was chosen to have a changepoint, with the remaining branches not having any changepoints. Figure 2
shows for each node of the grid the mean marginal posterior probability of having a changepoint for the branch with the changepoint. A changepoint that causes large changes to the distribution of the phenotype categories and affects a large number of individuals is inferred with a high posterior prob-ability. Changepoints that cause small changes in the distri-bution or affect few individuals or both result in small posterior probability of having a changepoint.
Simulation study of model and parameter inference
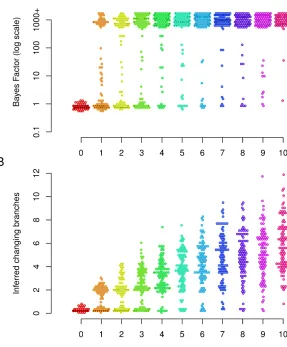
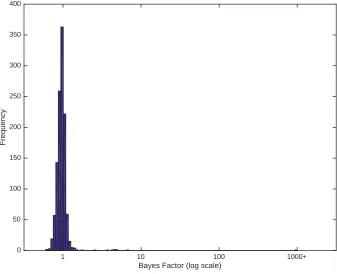
This simulation study was designed to assess our model selection procedure, the effect of number of changepoints on the inference, and the effect of cutoff threshold on the point estimate ofb:We simulated 100 data sets for each case of 0, 1,. . ., 10 changing branches in the tree. The distribution over the phenotypes was uniformly sampled in each case. For each simulated data set the Bayes factor of our model against the null model was estimated (Figure 3A). For the 100 data sets with no changepoint on the tree, all the estimated Bayes factors supported the null model (no changepoint on the tree). Changepoints that result in small changes in the distri-bution or affect a small number of individuals will not be detected. Therefore for some of data sets with a single chang-ing branch there is no support for the alternative model, but for some there is strong support for the alternative model. As the number of changing branches on the tree increases, the number of data sets with posterior support for the alternative model increases. Overall, our method is conservative and should not result in significant evidence for the existence of changepoints unless there are substantial data to support it. Next, we used the simulations to gauge the relationship between the true number of simulated changing branches and its posterior expectation, estimated using Bayesian model averaging (Hoeting et al. 1999). Figure 3B illustrates the results. In the absence of any changepoint, the mean of pos-terior expectation of number of changing branches is always close to zero. When there are changing branches on the tree, the posterior expectation is downward biased compared to the real value. This is expected as our method cannot detect a changepoint that results in small changes in the distribution or affects few individuals or both. As a result our method is conservative in estimating the number of changepoints on the tree.
threshold is a trade-off between minimizing the number of incorrectly inferred changepoints and maximizing the num-ber of correctly inferred changepoints. This choice depends on the application and the weight given to sensitivity and specificity in the application.
To test the sensitivity of our method to inaccuracies in the input phylogenetic tree, we repeated the runs for the same simulated data sets described above but using for inference a tree that had been randomized as follows. Patristic distances were computed for all pairs of leaves in the original tree, each pairwise distance d was replaced with a uniform random draw from interval½0:1d;1:9d;and a new tree was computed from these new distances, using UPGMA. Both model selec-tion (Figure S2A) and the inference of the number of change-points to have happened on the tree (Figure S2B) remained accurate in spite of the randomization of the tree, which shows that our inference method is relatively robust to small inaccuracies in the phylogenetic reconstruction.
Detecting cytotoxic T-lymphocytes escape mutations in HIV
Human leukocyte antigen (HLA) type I genes encode proteins that are present on the surface of almost all human cells. When a cell is infected with a virus, the viral protein is cleaved and small segments of it called epitopes are presented on the cell surface by the HLA-encoded proteins. These proteins have a certain amount of affinity and thus in people with the same HLA allele, the same epitope will be recognized and presented on the cell surface. Cytotoxic T lymphocytes (CTLs) are part of the adaptive immune response and recognize these epitopes before destroying the infected cell. A mutation in one of these epitopes can result in no or weak binding of the peptide to the HLA-encoded protein or result in lack of recognition by the T-cell receptor. Such mutations lead to the virus escaping
the immune response of the host. As these mutations can have a fitness cost on transmission to a host with different HLA repertoire, they may revert back to the wild type (Leslieet al.
2004). Thus the escape mutations on the virus genome are correlated with the host’s HLA alleles.
However, to detect these associations one has to account for the possible geographical structuring that could be present in the data. For instance, the distribution of HIV subtypes is different in various parts of the world and HLA allele profiles are also distinct in different populations across the world. When sampling is across different countries or ethnic groups, it is possible that HLA alleles will be associated with specific clusters of the virus simply because of geographical structur-ing. Several methods have been suggested to account for the nonrandom distribution of HLA alleles on the tips of the phylogenetic tree (Bhattacharya et al. 2007; Carlson et al.
each run. Only the distribution of HLA allele B57 on the tree of the first region of the HIV genome had a Bayes factor conclusively rejecting the null model of no association (Fig-ure 4). There is a clade of 12 viral individuals where 10 of the hosts have the B57 allele, whereas across the rest of the tree there are only 7 other hosts with B57 alleles. This clear
nonrandom distribution of the HLA allele B57 could be due to transmission of the virus between closely related people. However, we do not detect the same association between the other 9 trees from the rest of the genome and HLA allele B57. An alternative explanation may be that HLA allele B57 has a significant effect on the evolution of thefirst 1000 nucleotides of the virus, since HLA allele B57 is associated with slow progression to disease following HIV infection (Altfeldet al.
2003; Miuraet al.2009).
Inferring host range within a lineage of Salmonella enterica
Salmonella enterica is a bacterial pathogen made of multi-ple lineages with different host ranges (Uzzau et al.2000; Didelot et al. 2011; Achtman et al. 2012). Many lineages can infect a wide range of animals, whereas some are mostly found in specific hosts and yet others have become restricted to a single host type, for example the Typhi and Paratyphi A lineages that evolved in convergence toward infecting only humans (Didelotet al.2007). The Typhimurium DT104 line-age has been responsible for a global multidrug-resistant ep-idemic since the 1990s in both humans and farm animals (Glynn et al. 1998; Mølbak et al. 1999; Threlfall 2000). Typhimurium DT104 can infect both animals and humans, but it is unclear whether there are sublineages within DT104 that infect one host type more than the other and to what extent the epidemics in animals and humans are associated. Traditional molecular typing techniques do not provide enough genetic resolution to answer this question. A recent study sequenced the whole genomes of 142 human strains and 120 animal strains isolated in Scotland between 1990 and 2011 (Matheret al.2013). A maximum-likelihood tree was computed based on the nonrecombinant core ge-nome, using RAxML (Stamatakis 2006), and the phenotype was taken to be animalvs.human source of isolation at the tips of the tree. We applied ancestral state reconstruction to this data set, using maximum likelihood under an equal-rates model (Figure S4). A high rate of state change was estimated, corresponding to an expected total of 981 changes through-out the tree. This rate was driven by short branches sep-arating human and animal isolates. Consequently, longer branches were expected to contain several changes, and the uncertainty about the state at ancestral nodes was high, with a nearly 50/50 probability for the animal and human states (Figure S4).
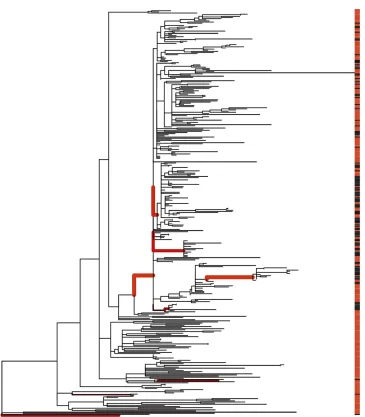
We then applied our own algorithm to this tree, to analyze the evolution of the phenotype distribution over the phyloge-netic tree. The null model of random distribution of hosts around the tree was decisively rejected in favor of the change-point model, with the reversible-jump MCMC never exploring the null model after initial burn-in. The posterior mean number of changing branches was 9.7, with the 95% credibility interval ranging from 5 to 16. Changes in the host range were especially evident on four branches (Figure 5), corresponding to poste-rior probabilities of 99%, 95%, 90%, and 72%, with two fur-ther branches with probability 54%, one with 39%, and all Figure 3 Simulation study of model and parameter inference. (A) Bayes
others,20%. Among the 4 branches with highest support, the oldest corresponds to an increase in the frequency of in-fection of animals for a large clade of 265 isolates within DT104. The other 3 branches all occurred within this clade and correspond to three separate further increases in the fre-quency of infection of animals for three subclades containing 12, 15, and 59 isolates, respectively. These results confirm and refine the original conclusions of the study in which the data were presented (Mather et al. 2013), that the epidemic of
DT104 in Scotland was not homogenous in humans and animals. Specifically, a sublineage increasingly became re-stricted to infecting only animals and not humans, which could be the result of either adaptation or niche segregation.
Discussion
may express depending on environmental factors, as a result of phenotypic plasticity (DeWittet al.1998; Agrawal 2001). We presented a model in which the phenotype distribution is allowed to change along the branches of a phylogenetic tree and an efficient Bayesian method to perform inference under this model. Our model for the evolution of the phenotype distribution is related to previous work on trait evolution with intraspecific variability, where the trait values recorded at the tips of a tree are drawn from a distribution whose parameters evolved as a Brownian motion on the branches of the tree (Felsenstein 2008; Revell and Reynolds 2012; Kostikova
et al.2016). A key difference, however, is that here we con-sidered that there are parts of the tree in which the underlying parameters remain constant, so that identifying these compo-nent parts becomes the main objective of inference. We showed using both simulated and real data that given pheno-type observations for the leaves of a phylogeny, our method can detect branches on which the phenotype distribution changed significantly. Consequently, a phylogeny can be de-marcated into lineages with distinct phenotype distributions.
There are many ways in which our approach could be extended, for example to be applicable to continuous rather than categorical phenotype measurements (Hadfield and Nakagawa 2010; Felsenstein 2012) or to allow the evolution of the phenotype distribution to be more progressive, for example by making the distribution after a changepoint to be correlated with, rather than independent from, the distri-bution before the changepoint. In our examples, the trees were estimated using maximum likelihood and therefore the branch lengths measure sequence distance rather than time. The relationship between such branch lengths and phe-notypic evolution is still an open question (Cunninghamet al.
1998). We did not attempt to model the potential for error in either the input phylogeny or the input phenotype mea-surements. Uncertainty about the tree could be accounted for by applying our method to a sample of trees from the posterior distribution of the trees that are produced by Bayesian phylogenetic software such as MrBayes and BEAST (Huelsenbeck and Ronquist 2001; Drummond et al.2012). However, we expect that a little inaccuracy in the tree would Figure 5 Application toSalmonella ecol-ogy. Shown is a maximum-likelihood phy-logenetic tree from a previous study of Typhimurium DT104 (Mather et al.
not drastically affect the result of our method and likewise for the phenotype measurement, because the results depend on phenotype distributions that are themselves stochastic. This is unlike methods that consider changes in the phenotype itself, such as ancestral state reconstructions (Yang et al.
1995), for which a mistake in a single phenotype mea-surement implies an additional evolutionary event for the phenotype. When considering phenotypes with imperfect heritability (Visscher et al. 2008), we argue that modeling the evolution of the phenotype distribution is more biologi-cally relevant than modeling the evolution of the phenotype measurement.
There are many research areas in which the method we proposed could be useful, and we presented two examples in HIV immunology and bacterial ecology. For example, our approach could help provide a definition of microbial species. Detecting incipient speciation requires distinguishing be-tween ecologically distinct populations in the same commu-nity (Ferris et al. 2003; Sikorski and Nevo 2005; Johnson
et al.2006). In this case the phenotype would be ecological or pathogenicity measurements, and the aim is to determine whether different phylogenetic clades have distinct distribu-tions over the measurable ecological quantities (Achtman and Wagner 2008; Fraseret al.2009). Another potential area of application is genome-wide association studies (GWAS) in organisms that reproduce clonally. Population structure is a confounding effect in GWAS (Marchiniet al.2004) and this is especially important for clonal organisms (Earleet al.2016). One way to account for this population structure would be to use our method tofind the clades on the phylogenetic tree where the phenotype of interest is uniquely distributed and perform GWAS stratified by those clusters.
Acknowledgments
The authors thank Remi Bardenet, Daniel Falush, Philip Maybank, and Gil McVean for their insightful discussions. This research was made possible by a James Martin fellow-ship (awarded to M.A.A.). X.D. received funding from the Biotechnology and Biological Sciences Research Council (BB/L023458/1) and the National Institute for Health Research (HPRU-2012-10080).
Literature Cited
Achtman, M., and M. Wagner, 2008 Microbial diversity and the ge-netic nature of microbial species. Nat. Rev. Microbiol. 6: 431–440. Achtman, M., J. Wain, F.-X. Weill, S. Nair, Z. Zhouet al., 2012 Multilocus sequence typing as a replacement for serotyping inSalmonella enterica. PLoS Pathog. 8: e1002776.
Agrawal, A. A., 2001 Phenotypic plasticity in the interactions and evolution of species. Science 294: 321–326.
Altfeld, M., M. M. Addo, E. S. Rosenberg, F. M. Hecht, P. K. Lee et al., 2003 Influence of HLA-B57 on clinical presentation and viral control during acute HIV-1 infection. AIDS 17: 2581–2591. Bhattacharya, T., M. Daniels, D. Heckerman, B. Foley, N. Frahm et al., 2007 Founder effects in the assessment of HIV
polymorphisms and HLA allele associations. Science 315: 1583–1586.
Blomberg, S. P., T. Garland, and A. R. Ives, 2003 Testing for phylogenetic signal in comparative data: behavioral traits are more labile. Evolution 57: 717–745.
Bradley, A. P., 1997 The use of the area under the ROC curve in the evaluation of machine learning algorithms. Pattern Recog-nit. 30: 1145–1159.
Carlson, J. M., Z. L. Brumme, C. M. Rousseau, C. J. Brumme, P. Matthewset al., 2008 Phylogenetic dependency networks: in-ferring patterns of CTL escape and codon covariation in HIV-1 Gag. PLoS Comput. Biol. 4: e1000225.
Carlson, J. M., J. Listgarten, N. Pfeifer, V. Tan, C. Kadie et al., 2012 Widespread impact of HLA restriction on immune con-trol and escape pathways of HIV-1. J. Virol. 86: 5230–5243. Cunningham, C. W., K. E. Omland, and T. H. Oakley, 1998 Reconstructing
ancestral character states. Trends Ecol. Evol. 5347: 361–366. De Maio, N., C.-H. Wu, K. M. O’Reilly, and D. Wilson, 2015 New
routes to phylogeography: a Bayesian structured coalescent ap-proximation. PLoS Genet. 11: e1005421.
DeWitt, T. J., A. Sih, and D. S. Wilson, 1998 Cost and limits of phenotypic plasticity. Trends Ecol. Evol. 13: 77–81.
Didelot, X., and D. Falush, 2007 Inference of bacterial microevo-lution using multilocus sequence data. Genetics 175: 1251– 1266.
Didelot, X., M. Achtman, J. Parkhill, N. R. Thomson, and D. Falush, 2007 A bimodal pattern of relatedness between the Salmo-nella Paratyphi A and Typhi genomes: Convergence or diver-gence by homologous recombination? Genome Res. 17: 61–68. Didelot, X., A. Darling, and D. Falush, 2009 Inferring genomic
flux in bacteria. Genome Res. 19: 306–317.
Didelot, X., D. Lawson, A. Darling, and D. Falush, 2010 Inference of homologous recombination in bacteria using whole-genome sequences. Genetics 186: 1435–1449.
Didelot, X., R. Bowden, T. Street, T. Golubchik, C. Spenceret al., 2011 Recombination and population structure in Salmonella enterica. PLoS Genet. 7: e1002191.
Drummond, A. J., M. A. Suchard, D. Xie, and A. Rambaut, 2012 Bayesian phylogenetics with BEAUti and the BEAST 1.7. Mol. Biol. Evol. 29: 1969–1973.
Earle, S. G., C.-H. Wu, J. Charlesworth, N. Stoesser, N. C. Gordon et al., 2016 Identifying lineage effects when controlling for population structure improves power in bacterial association studies. New Microbiol. 1: 16041.
Felsenstein, J., 2008 Comparative methods with sampling error and within-species variation: contrasts revisited and revised. Am. Nat. 171: 713–725.
Felsenstein, J., 2012 A comparative method for both discrete and continuous characters using the threshold model. Am. Nat. 179: 145–156.
Ferris, M. J., M. Kühl, A. Wieland, and D. M. Ward, 2003 Cyanobacterial ecotypes in different optical microenvironments of a 68 degrees C hot spring mat community revealed by 16S–23S rRNA internal transcribed spacer region variation. Appl. Environ. Microbiol. 69: 2893–2898.
Fraser, C., E. J. Alm, M. F. Polz, B. G. Spratt, and W. P. Hanage, 2009 The bacterial species challenge: making sense of genetic and ecological diversity. Science 323: 741–746.
Garland, T., A. F. Bennett, and E. L. Rezende, 2005 Phylogenetic approaches in comparative physiology. J. Exp. Biol. 208: 3015– 3035.
Green, P. J., 1995 Reversible jump Markov chain Monte Carlo computation and Bayesian model determination. Biometrika 82: 711.
Hadfield, J., and S. Nakagawa, 2010 General quantitative genetic methods for comparative biology: phylogenies, taxonomies and multi-trait models for continuous and categorical characters. J. Evol. Biol. 23: 494–508.
Hillis, D. M., and J. P. Huelsenbeck, 1992 Signal, noise, and reliabil-ity in molecular phylogenetic analyses. J. Hered. 83: 189–195. Hoeting, J. A., D. Madigan, A. E. Raftery, and C. T. Volinsky,
1999 Bayesian model averaging: a tutorial. Stat. Sci. 14: 382–401.
Huelsenbeck, J. P., and F. Ronquist, 2001 MRBAYES: Bayesian inference of phylogenetic trees. Bioinformatics 17: 754–755. Johnson, Z. I., E. R. Zinser, A. Coe, N. P. McNulty, E. M. S.
Wood-ward et al., 2006 Niche partitioning among Prochlorococcus ecotypes along ocean-scale environmental gradients. Science 311: 1737–1740.
Kass, R. E., and A. E. Raftery, 1995 Bayes factors. J. Am. Stat. Assoc. 90: 773.
Kostikova, A., D. Silvestro, P. B. Pearman, and N. Salamin, 2016 Bridging inter-and intraspecific trait evolution with a hierarchical Bayesian approach. Syst. Biol. 65: 417–431. Lawson, D. J., G. Hellenthal, S. Myers, and D. Falush,
2012 Inference of population structure using dense haplotype data. PLoS Genet. 8: e1002453.
Leslie, A. J., K. J. Pfafferott, P. Chetty, R. Draenert, M. M. Addo et al., 2004 HIV evolution: CTL escape mutation and reversion after transmission. Nat. Med. 10: 282–289.
Maddison, W. P., 1997 Gene trees in species trees. Syst. Biol. 46: 523–536.
Marchini, J., L. R. Cardon, M. S. Phillips, and P. Donnelly, 2004 The effects of human population structure on large genetic associa-tion studies. Nat. Genet. 36: 512–517.
Mather, A. E., S. W. J. Reid, D. J. Maskell, J. Parkhill, M. C. Fookes et al., 2013 Distinguishable epidemics of multidrug-resistant Salmonella Typhimurium DT104 in different hosts. Science 341: 1514–1517.
Miura, T., M. A. Brockman, A. Schneidewind, M. Lobritz, F. Pereyra et al., 2009 HLA-B57/B*5801 human immunodeficiency virus type 1 elite controllers select for rare Gag variants associated with reduced viral replication capacity and strong cytotoxic T-lymphocyte recognition. J. Virol. 83: 2743–2755.
Mølbak, K., D. Baggesen, F. Møller Aarestrup, J. Ebbesen, J. Engberg et al., 1999 An outbreak of multidrug-resistant,
quinolone-resistant Salmonella enterica serotype typhimu-rium DT104. N. Engl. J. Med. 341: 1420–1425.
Pagel, M., 1999 Inferring the historical patterns of biological evo-lution. Nature 401: 877–884.
Pritchard, J. K., M. Stephens, and P. Donnelly, 2000 Inference of population structure using multilocus genotype data. Genetics 155: 945–959.
Revell, L., 2008 On the analysis of evolutionary change along single branches in a phylogeny. Am. Nat. 172: 140–147. Revell, L. J., and G. R. Reynolds, 2012 A new Bayesian method for
fitting evolutionary models to comparative data with intraspe-cific variation. Evolution 66: 2697–2707.
Revell, L. J., D. L. Mahler, P. R. Peres-neto, and B. D. Redelings, 2011 A new phylogenetic method for identifying exceptional phenotypic diversification. Evolution 66: 135–146.
Rosenberg, N. A., and M. Nordborg, 2002 Genealogical trees, co-alescent theory and the analysis of genetic polymorphisms. Nat. Rev. Genet. 3: 380–390.
Rousseau, C. M., M. G. Daniels, J. M. Carlson, C. Kadie, H. Crawford et al., 2008 HLA class I-driven evolution of human
immunode-ficiency virus type 1 subtype C proteome: immune escape and viral load. J. Virol. 82: 6434–6446.
Sikorski, J., and E. Nevo, 2005 Adaptation and incipient sympat-ric speciation of Bacillus simplex under microclimatic contrast at “Evolution Canyons”I and II, Israel. Proc. Natl. Acad. Sci. USA 102: 15924–15929.
Stamatakis, A., 2006 RAxML-VI-HPC: maximum likelihood-based phylogenetic analyses with thousands of taxa and mixed mod-els. Bioinformatics 22: 2688–2690.
Threlfall, E. J., 2000 Epidemic Salmonella typhimurium DT 104—a truly international multiresistant clone. J. Antimicrob. Chemother. 46: 7–10.
Uzzau, S., D. J. Brown, T. Wallis, S. Rubino, G. Leori et al., 2000 Host adapted serotypes of emphSalmonella enterica. Ep-idemiol. Infect. 125: 229–255.
Visscher, P. M., W. G. Hill, and N. R. Wray, 2008 Heritability in the genomics era concepts and misconceptions. Nat. Rev. Genet. 9: 255–266.
Yang, Z., and B. Rannala, 2012 Molecular phylogenetics: princi-ples and practice. Nat. Rev. Genet. 13: 303–314.
Yang, Z., S. Kumar, and M. Nei, 1995 A new method of inference of ancestral nucleotide and amino acid sequences. Genetics 141: 1641–1650.
GENETICS
Supporting Information www.genetics.org/lookup/suppl/doi:10.1534/genetics.116.190496/-/DC1
Bayesian Inference of the Evolution of a Phenotype
Distribution on a Phylogenetic Tree
M. Azim Ansari and Xavier Didelot
Bayes Factor (log scale)
1 10 100 1000+
Frequency
0 50 100 150 200 250 300 350 400
− − − − − − − − − − − − − − − − − − − − − − − − − − − − − − − − − − − − − − − − − − − − − − − − − − − − − − − − − − − − − − − − − − − − − − − − − − − − − − − − − − − − − − − − − − − − − − − − − − − − − − − − − − − − − − − − − − − − − − − − − − − − − − − − − − − − − − − − − − − − − − − − − − − − − − − − − − − − − − − − − − − − − − − − − − − − − − − − − − − − − − − − − − − − − − − − − − − − − − − − − − − − − − − − − − − − − − − − − − − − − − − − − − − − − − − − − − − − − − − − − − − − − − − − − − − − − − − − − − − − − − − − − − − − − − − − − − − − − − − − − − − − − − − − − − − − − − − − − − − − − − − − − − − − − − − − − − − − − − − − − − − − − − − − − − − − − − − − − − − − − − − − − − − − − − − − − − − − − − − −
File S1:
Supplementary
material
MCMC moves
Proposal for
b
Assuming that
b
⋆divides the tree into
n
sections the Metropolis-Hastings ratio for this
move is given by
h
(
b
,
b
⋆):
h
(
b
,
b
⋆) = 1
∧
(Γ(
K
))
nQ
ni=1QK
j=1Γ(x⋆ij+1)
Γ(K+PK
j=1x⋆ij)
T e
−T λQ
2N−2s=1
(
e
− λls)
1−b⋆s(1
−
e
−λls)
b⋆s(Γ(
K
))
mQ
mi=1QK
j=1Γ(xij+1)
Γ(K+PK
j=1xij)
T e
−T λQ
2N−2s=1
(
e
−λls
)
1−bs(1
−
e
−λls)
bs= 1
∧
(Γ(
K
))
n−mQ
ni=1
QK j=1Γ(x
⋆ ij+1)
Γ(K+PK
j=1x⋆ij)
Q
2N−2 s=1(
e
−λls
)
1−b⋆s(1
−
e
−λls)
b⋆sQ
m i=1QK
j=1Γ(xij+1)
Γ(K+PK
j=1xij)
Q
2N−2 s=1(
e
−λls
)
1−bs(1
−
e
−λls)
bs(1)
Note that the prior on
λ
cancelled out from the Metropolis-Hastings ratio.
Proposal for
λ
This proposal distribution is symmetric and therefore the Metropolis-Hastings ratio is given
by:
h
(
λ, λ
⋆) = 1
∧
(Γ(
K
))
mQ
mi=1QK
j=1Γ(xij+1)
Γ(K+PK
j=1xij)
T e
−T λ⋆Q
2N−2s=1
(
e
− λ⋆ls)
1−bs(1
−
e
−λ⋆ls)
bs(Γ(
K
))
mQ
mi=1QK
j=1Γ(xij+1)
Γ(K+PK
j=1xij)
T e
−T λ
Q
2N−2s=1
(
e
− λls)
1−bs(1
−
e
−λls)
bs= 1
∧
e
−T λ⋆
Q
2N−2s=1
(
e
− λ⋆ls)
1−bs(1
−
e
−λ⋆ls)
bse
−T λQ
2N−2s=1
(
e
−λls