INVESTIGATION
Measuring Selection Coef
fi
cients Below 10
2
3
:
Method, Questions, and Prospects
Romain Gallet,* Tim F. Cooper,†Santiago F. Elena,‡,§and Thomas Lenormand*,1
*CEFE–UMR 5175 1919 route de Mende, F-34293 Montpellier, CEDEX 5, France,†Evolution and Ecology Group, Department of
Biology and Biochemistry, University of Houston, Houston, Texas 77204,‡Instituto de Biología Molecular y Celular de Plantas
(CSIC-UPV), 46022 València, Spain, and§Santa Fe Institute, Santa Fe, New Mexico 87501
ABSTRACTMeasuringfitness with precision is a key issue in evolutionary biology, particularly in studying mutations of small effects. It
is usually thought that sampling error and drift prevent precise measurement of very smallfitness effects. We circumvented these limits by using a new combined approach to measuring and analyzingfitness. We estimated the mutationalfitness effect (MFE) of three independent mini-Tn10transposon insertion mutations by conducting competition experiments in large populations ofEscherichia coli under controlled laboratory conditions. Usingflow cytometry to assess genotype frequencies from very large samples alleviated the problem of sampling error, while the effect of drift was controlled by using large populations and massive replication of fitness measures. Furthermore, with a set of four competition experiments between ancestral and mutant genotypes, we were able to decomposefitness measures into four estimated parameters that account forfitness effects of ourfluorescent marker (a), the mutation (b), epistasis between the mutation and the marker (g), and departure from transitivity (t). Our method allowed us to estimate mean selection coefficients to a precision of 2·1024. We also found small, but significant, epistatic interactions between the allelic effects of
mutations and markers and confirmed thatfitness effects were transitive in most cases. Unexpectedly, we also detected variation in measures ofsthat were significantly bigger than expected due to drift alone, indicating the existence of cryptic variation, even in fully controlled experiments. Overall our results indicate that selection coefficients are best understood as being distributed, representing a limit on the precision with which selection can be measured, even under controlled laboratory conditions.
M
UTATIONS of small effect can play an important role in evolution, but they are difficult to measure exper-imentally because the precision with whichfitness effects can be measured is relatively low. For this reason, it remains unclear to what extent mutations with small beneficial ef-fects contribute to fitness improvements (Orr 2005). It is also unclear how much deleterious mutations of small effect contribute to the genetic load and inbreeding depres-sion (Charlesworth and Charlesworth 1998; Bataillon and Kirkpatrick 2000). More generally, the existence and influence of mutations of small effect is at the heart of the neutralist– selectionist controversy (e.g., Nei 2005). This debate can be addressed experimentally only if the precision of fitness mea-surements is lower than the inverse of effective population size, which seems beyond reach for large populations (Kreitman1996). Finally, a low precision in fitness measures limits the ability to determine whether thefitness effect of a mutation varies across different environmental or genetic contexts and adds to other sources of stochasticity (Lenormandet al.2009) to make it difficult to reliably predict evolutionary trajectories. Precisely measuring fitness poses technical, conceptual, and statistical challenges. The technical challenge is to set up a technique that allows experiments to be carried out efficiently. Thefirst major advance was to use“population cages”with Drosophilaor other small animals (starting in the 1930s with the work of L’Heritier and Teissier 1937a,b). With such devices, environmental conditions are relatively controlled and geneflow can be eliminated. However, drift and indirect selection caused by loci under selection in link-age disequilibrium with the focal locus are difficult to account for. The same approach was applied to microorgan-isms (Dykhuizen and Hartl 1980), which can be made iso-genic save for a focal gene, thereby reducing indirect selection due to initial linkage disequilibrium (e.g., Carrasco
et al. 2007; Domingo-Calap et al. 2009 for distribution of mutationfitness effects; Elenaet al.1998; Sanjuanet al.2004;
Copyright © 2012 by the Genetics Society of America doi: 10.1534/genetics.111.133454
Manuscript received July 29, 2011; accepted for publication September 19, 2011 Supporting information is available online at http://www.genetics.org/content/ suppl/2011/10/31/genetics.111.133454.DC1.
1Corresponding author: CEFE–UMR 5175 1919 route de Mende, F-34293 Montpellier,
Peris et al. 2010) and can be propagated as large popu-lations, minimizing the effect of drift relative to selection. They can also be followed over many generations (Dykhuizen and Hartl 1983; Thatcher et al. 1998; Lunzer et al. 2002). Long-term monitoring increases the ability to detect small differences in fitness between competing genotypes, but adds the complication that newly arising mutations may perturb the assay (Dykhuizen and Hartl 1983). An impor-tant technical issue in all competition experiments is to de-termine the frequency of competing genotypes reliably and quickly. In many cases the idea is to link an easily recognized marker with the gene under scrutiny. It is, however, impor-tant to recognize that a marker can confer a selective differ-ence (a marker “cost”), which might vary with the genetic background (epistasis) or external environment (G·E inter-actions). Finally, inferring allelic selection coefficients against a common reference strain requires that genotypic
fitness is transitive. These potential complications require adding proper controls to competition experiments.
A key conceptual difficulty in measuring thefitness effects of mutations is to distinguish selection from drift (Beatty 1984; Millstein 2008), which is at the heart of several population cage experiments withDrosophila(Dobzhansky and Pavlovsky 1957). To account for the effect of drift, a selection coefficient can be defined from the expected change in allele frequency over one generation (e.g., Rousset 2004), which can be es-timated from the mean frequency change in independent competition experiments. Because of drift, replication is fun-damentally necessary to estimatefitness, and the precision of a given fitness measure must account for the interrepli-cate variance. Indeed, it is possible to count all organisms in an experimental population, so that the genotype frequen-cies are known without sampling error. Such an experiment would allow frequency variation to be determined“exactly,” but would clearly not account for the possibility that drift will cause different outcomes in different replicates. A fur-ther complication is thatfitness may vary because of chang-ing environmental conditions. Fluctuatchang-ing selection durchang-ing the course of a competition experiment or varying selection across replicates of a competition assay can mimic drift (Felsenstein 1976; Lynch 1987; O’hara 2005). If selection varies, and it probably always does to some extent (Bell 2008; Bell 2010), measuring selection requires measuring both a mean anda variance (the latter not including sam-pling error). The remaining variance can be caused by drift or by heterogeneity in selection, which are difficult to dis-entangle without extra information on the effective popula-tion size. In summary, measuring selecpopula-tion with precision requires estimating an expectation over several replicates, so that its variance can be decomposed into components due to sampling error, drift, and variable selection.
From a statistical point of view, selection coefficients in the field or in the laboratory are best estimated by using a fully specified selection model in a likelihood framework (e.g., Clark 1979; Wilsonet al.1982; Oakeshottet al.1983;
Manly 1985; Arnason and Lewontin 1991; Lenormand and Raymond 2000; Saccheri et al. 2008; Labbe et al. 2009), which can include drift if longitudinal data are available (Manly 1985; O’hara 2005; Bollback et al. 2008). When selection can be approximated by a continuous process through time in an isolated population, a simple approach is to regress Log(p/q) (wherepandqrepresent the frequen-cies of the two competitors) over time expressed in units of generations (Fisher 1930). The connection with logistic re-gression and general linear models is then straightforward (Arnason and Barker 1999) and more appropriate than the use of least squares. However, complications arise in the analysis of time series and correlated error in repeated mea-surement through time (Arnason and Barker 1999; O’hara 2005), especially when both drift and fluctuating selection cause frequency variation. The latter problems can be im-portant, particularly when analyzing multiple time point se-ries (e.g., arising in long-term population cage or chemostat experiments), although they are rarely taken into account. Often, replicated experiments are simply pooled, even if significantly different, and not analyzed to consider variance in the estimates of selection. The development of mixed models offers an attractive alternative to circumvent this problem and to measure selection and its variation.
We present an approach combining several features to improve and quantify the precision offitness measures. First, we use techniques that have proved to be among the most efficient to measurefitness: competition assay between large populations of Escherichia coli strains to minimize drift and engineered mutations to avoid the problem of indirect selec-tion. Specifically, we used three genotypes, each carrying a single mutation introduced by the integration of a mini-Tn10transposon. These mutations were considered neutral, relative to a common progenitor genotype, in a previous ex-periment (Elenaet al.1998). We use twofluorescent markers (Rosenfeld et al. 2005) combined with flow cytometry (Lunzer et al. 2002) to measure frequency variation with great precision, and thus minimize sampling error. Other studies have shown the utility of these approaches in mea-suring genotypefitness (Lunzeret al.2002; Zhuet al.2005; Leeet al.2009). Key aspects of our approach are as follows:
1. A comprehensive set of four competition assays enables us to separately estimate mutational selection coefficients (a), the cost of the marker (b), epistasis between muta-tion and marker (g), and transitivity (t).
2. We use short-term batch culture to facilitate massive rep-lication and to reduce the possibility thatde novo
bene-ficial mutations will occur.
3. We analyze the data in an integrated likelihood framework with random effects to partition sources of variation in our estimates (sampling errorvs.driftvs.variable selection).
mutation selection coefficients that were significantly larger than expected due to drift alone, indicating the action of some kind of cryptic variation during our competitions. This
finding implies that, in practice, selection coefficients should be considered as being distributed and that precise measures require evaluating both the mean andthe variance of this distribution. Furthermore, the variance in s indicates that some uncontrolled processes occur in these experiments (cryptic environmental or genetic variation), which impose a limit to further dissecting the differences seen across replicates. We discuss implications of these findings and the prospects of this high-throughput method for fitness measurement.
Materials and Methods
Strain construction
TheE. coliB strain used in this study, REL4548, was evolved in Davis minimal medium supplemented with 25mg/ml glu-cose (DM25) for 10,000 generations as part of a long-term evolution experiment (Elenaet al.1998).
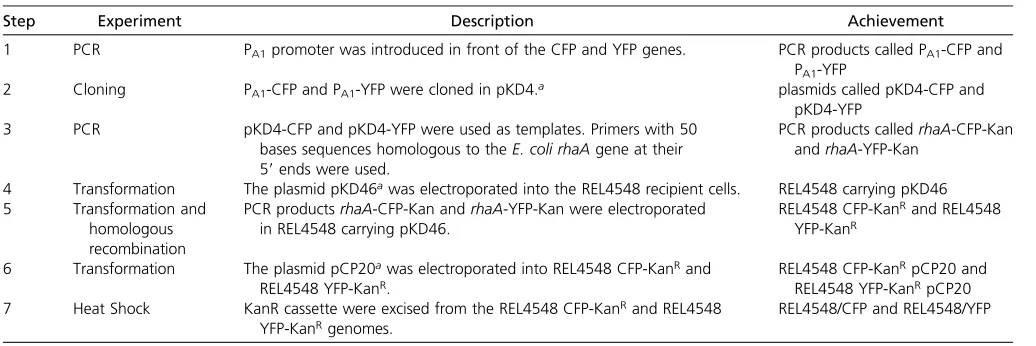
Insertions of the chromosomal fluorescent markers: The YFP and CFP genes (provided by the Yeast Resource Center of the University of Washington) were inserted at therhaA
locus of REL4548 using a technique developed by Datsenko and Wanner (2000). Table 1 gives a description of this method as applied to our experiments. A full description of the method is given in supporting information,File S1.
Mutant construction:The three mutants studied here were constructed by Elena et al. (1998) and were obtained by random single insertions of mini-Tn10derivative 104—which contains a tetracycline resistance cassette (Kleckner et al.
1991)—into REL4548. We chose mutations T63, T103, and T121 from this original collection because they were
identi-fied as neutral using the standard plating method. These mu-tations were transduced into REL4548/CFP and REL4548/YFP
by P1 transduction to have each mutation associated with each fluorescent marker. Since P1 transductions were per-formed between isogenic strains (except for the marker and the mobilized mutation), the risk of secondary mutations was low. Transductants were selected on LBA-Tet plates (LB agar plates supplemented 10 mg/ml tetracycline). We denote the wild-type genotype with CFP markerwc(wcfor wild-type cyan),wyfor wild-type YFP,mcfor mutant CFP,
myfor mutant YFP.
Competition experiments
Media:Lysogeny broth (LB) was used for routine molecular work and for reviving strains from storage (10 g/liter NaCl, 10 g/liter tryptone, 5 g/liter yeast extract; LB Agar LB + 15 g/liter agar). Davis minimal (DM) medium supplemented with 250mg/ml glucose (DM250) was used for all compe-tition assays (KH2PO43H20 7 g/liter, KH2PO4 2 g/liter, (NH4)2SO41 g/liter, sodium citrate 0.5 g/liter; pH was ad-justed to 7.0 with HCl or NaOH as necessary). Bottles were weighed before and after autoclaving and sterile milliQ wa-ter was added to compensate for evaporation. Afwa-ter auto-claving, DM was supplemented with: 2.5 ml glucose 10%, 1 ml MgSO42210%, 1 ml thiamine (vitamin B1) 0.2%. We call this medium DM250, which is equivalent to the one used by Lenski et al.(1991), in which the strain REL4548 grew for 10,000 generations, but with 10 times more glucose.
Glycerol stocks: All strains were grown overnight and a sample of 750ml of each culture was mixed to 250ml of 60% glycerol and kept at280for storage.
Culture: The relative fitness, W, of each mutant was esti-mated by measuring the change in its relative frequency in competition experiments. To measure the mutation fitness effect (MFE) and to control for potential marker effects and epistasis between the mutation and the marker, we per-formed four competition types for each mutant: (a)wc/wy,
Table 1 Strain construction description
Step Experiment Description Achievement
1 PCR PA1promoter was introduced in front of the CFP and YFP genes. PCR products called PA1-CFP and
PA1-YFP
2 Cloning PA1-CFP and PA1-YFP were cloned in pKD4.a plasmids called pKD4-CFP and
pKD4-YFP
3 PCR pKD4-CFP and pKD4-YFP were used as templates. Primers with 50
bases sequences homologous to theE. coli rhaAgene at their
59ends were used.
PCR products calledrhaA-CFP-Kan
andrhaA-YFP-Kan
4 Transformation The plasmid pKD46awas electroporated into the REL4548 recipient cells. REL4548 carrying pKD46
5 Transformation and
homologous recombination
PCR productsrhaA-CFP-Kan andrhaA-YFP-Kan were electroporated
in REL4548 carrying pKD46.
REL4548 CFP-KanRand REL4548
YFP-KanR
6 Transformation The plasmid pCP20awas electroporated into REL4548 CFP-KanRand
REL4548 YFP-KanR.
REL4548 CFP-KanRpCP20 and
REL4548 YFP-KanRpCP20
7 Heat Shock KanR cassette were excised from the REL4548 CFP-KanRand REL4548
YFP-KanRgenomes.
REL4548/CFP and REL4548/YFP
(b) mc/my, (c) my/wc, and (d) mc/wy. The rationale for performing all these competitions is presented below. Com-petitions were begun by growing the strains to be competed at 37overnight with shaking at 250 rpm in 24-well micro-titer plates (Greiner Bio—one 662102—suspension culture plates) containing 1 ml/well of DM250. We used DM250 as the growth medium to obtain large population sizes, which limit the effect of drift, and to facilitate the measurement of hundreds of thousands of cells without having to sample large volumes. To limit evaporation, each 24-well plate was placed in a 2-liter plastic box containing paper towels soaked with 100 ml water (at the bottom of the box). The next day, 10ml (100-fold dilution) of each culture was trans-ferred to a fresh plate and incubated for 24 hr under iden-tical conditions. On the third day, competitors were mixed at a 1:1 ratio (5 ml of each competitor) and transferred to a fresh plate under identical conditions. On day 4, 20 ml of each competition was transferred into 10 replicate wells containing 1980 ml of DM250. After mixing, 1 ml was re-moved from each well and placed in a plastic test tube at 4 for a subsequent flow cytometry measurement (performed 1 hr later), while the remaining 1 ml was kept in the micro-titer plate to be cultivated under the conditions described above. Finally, on thefifth day, a 100-ml sample was taken from each competition, diluted in DM (not containing glu-cose, thiamine, or MgSO422), and placed in a plastic test tube at 4 for a subsequent flow cytometry measurement (performed 1 hr later). Ten different types of competitions were performed:wc vs. wy,mT63c vs. mT63y,mT63c vs. wy,wc
vs. mT63y, mT103c vs. mT103y, mT103c vs. wy, wc vs. mT103y,
mT121c vs. mT121y,mT121c vs. wy,wc vs. mT121y. Each
experi-mental block consisted of each of these 10 competitions replicated 10-fold. Each experimental block was repeated at four different dates.
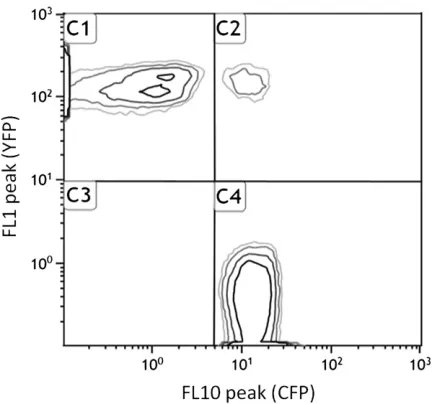
Flow cytometry: The relative frequency of competitors marked with CFP or YFP was measured using a Gallios Beckman Coulter flow cytometer at 0 and 24 hr following mixing of competing genotypes. We decided to separate competitor populations only on the basis of theirfluorescent markers, because CFP and YFP cell populations did not have the same distribution pattern on forward vs. side scatter plots. Thresholds were applied manually (since clustering algorithms often introduce more noise) on the CFP–YFP plots to determine the boundaries of each population (CFP, YFP, unmarked cells, and doubled marked objects) as shown on Figure 1. These thresholds were the same for all competition plots because in such a constant environ-ment, cell clusters were always localized in the same areas of the plot. The frequency of each marker type was calcu-lated using CFP and YFP population counts only. Unmarked and double-marked populations represented approximately 0.2 and 1% of the total population, respectively. For simplic-ity, “doublets” (objects composed of two cells) were ex-cluded from our frequency estimates. CC, YY, and CY doublets occur, but only the latter are detected in the C2 population (Figure 1). Furthermore, doublets may not form at random; doublets with the same color were often over-represented (data not shown). Nevertheless, even consider-ing these complications, ignorconsider-ing doublets only introduces a bias onsmeasures proportional tose, whereeis the frac-tion of the CY populafrac-tion (C2 in Figure 1). Under our con-ditions, e 1% making this bias negligible compared tos
(see File S1andFile S2for details).
Precision of frequency measures with cytometry
Our method is based on measuring the relative frequencyp
of two competing genotypes at different time points by countingC= 200000 cells. This largefigure, however, still represents a small fraction of the total population and, therefore, we estimate frequencies with sampling error. The theoretical expectation for this sampling error is
s2
e ¼pð12pÞ=C:
If nothing else contributes to measurement error, we should obtain this variance when measuring repeatedly the frequency in a given test tube. Preliminary experiments (not shown) indicated that much larger error could occur, in particular when test tubes were insufficiently mixed. This is an important technical issue and comparing actual mea-surement error to s2
e provides an internal check that mea-surement error is not inflated above the sampling error expectation. In the experiments presented here, we used measures of initial frequencies (p0) in our replicated com-petitions to estimate the variance of frequency measures performed with cytometrys2
obs. We found that s 2 obs/s
2 e was
0.94, 1.83, 1.07, and 0.95 for the four different dates where all the competitions were performed. Except for date 2, measurement error was very close to that inherent to sam-pling only. However, as shown bys2
obs at date 2 (and other preliminary assays showing more dramatic results), using cytometry does not guarantee that measurement error will be low. In particular, thorough mixing of test tubes through-out the growth cycle limits cell aggregation and is a crucial step in taking advantage of the advantages offered by the cytometric approach (or any other approach based on fre-quency variation).
Measure of genotypicfitness
We measured fitness on the basis of a continuous time model dp=dt¼spð12pÞ, which defines selection coefficient (s) on the basis of frequency (p) variation. This frequency variation was measured in the competition experiments de-scribed above. For a given competition assayk, the data are a vectornk¼ fn01k;n02k;nt1k;nt2kggiving the number of
geno-types 1 and 2 counted at time 0 (beginning) and t(end of the competition). The log-likelihood of this data given initial frequency of genotype 1 p0
1k and selection coefficient sk is
computed as
ln Prnkjp01k;sk
¼ X
i¼1;2
X
j¼0;t
nikjlnpikj
; (1)
wherep2jk¼1 2 p1jk and
pt1k¼esktp0 1k=
p02kþesktp0 1k
: (2)
The frequency variation is measured over 24 hr. To scale
fitness measurements per generation, we used the number of cell generations as the time unit. This measure is an average over the duration of the competition, which does not contradict the fact that conditions change with time in a given assay (e.g., the glucose becomes limiting) because it does so similarly in all replicates. Because populations ex-pand by binaryfission, we havet= ln(100)/ln(2) = 6.6 in Equation 2. Across replicates of the same competition, sk
might vary for reasons other than sampling error, owing, for example, to drift or to cryptic environmental variation. To measure this variation, we used the same logistic regres-sion approach (Equations 1 and 2), but including the as-sumption that s was normally distributed s Nðs;ssÞ among
replicates. The log-likelihood of this logistic regression with random slope is then
ln Prnjp01;s;ss
¼X
k
ln
ZN
2NN
s;ss;sY
i¼1;2
Y
j¼0;tn j ikln p
j ik ds;
(3)
wherenis the data matrix {n1;n2;n3;. . .},p01 the vector of all initial frequencies, andNðm;s;xÞdenotes the probability density function of the Normal distribution with mean m and standard deviation s. In all cases, parameters were estimated by maximizing the log-likelihood. Support limits for a given estimate were computed within 2 units of log-likelihood from the maximum with all other parameters be-ing freely fitted. An equivalent of standard error SEeqwas computed as a quarter of the support range (similarly, 95% confidence intervals are 6 1.96 SE). Computations were performed with Mathematica (Wolfram Research 2008).
Fitness transitivity, allelicfitness, and epistasis
To test whether a constant fitness can be attributed to a genotype irrespective of its competitor, we performed all possible combinations of competition assays for a given mutant. At afirst locus we have the wild-type (w) and mu-tant (m) alleles. At a second locus we have two allelescand
y (corresponding to the CFP and YFP marker proteins, re-spectively). Each competition assay requires competing gen-otypes to have different alleles at the marker locus. There are thus four possible combinations: (a)wc/wy, (b)mc/my, (c) my/wc, and (d)mc/wy. Table 2 indicates the selection coefficient expected in each of these cases if we assume that thefitness of genotypeswc,wy,mc, andmyare constant and equal toWwc,Wwy,Wmc, andWmy, respectively. When
mea-suring the marker effect in the same background (compet-itions a and b), we measured the selection coefficient of the CFP genotype. Otherwise, we measured the selection
coef-ficient of the mutant genotype against the wild type (com-petitions c and d).
Population genetics models usually assume thatfitness effects are transitive,i.e., that they could be deduced from some absolute value ranking of the different genotypes. However, this is an assumption that requires evaluation before attributing a selection coefficient to genotypes. Since competitions a, b, and c are sufficient to estimate all fitness if they are transitive, competition d can be used to measure departure from transitivity. Specifically, we in-troduce a parametertmeasuring this departure (see Table 2). Further reparameterization allows decomposing geno-typic fitness into allelic effects and their interaction (epista-sis). We note thatWwc=Wwy+a,Wmy=Wwy+b,Wmc=
Wwy+a+b+g.ais the “cost”of the CFP marker, bis
Table 2 Selection coefficient expected in the different combinations of competition assays:wc/wy,mc/my,my/wc, andmc/wy
Genotypes Wild-type CFP (wc) Wild-type YFP (wy) Mutant CFP (mc)
Wild-type YFP (wy) sa¼Wwc/Wwy21
Mutant CFP (mc) sd¼Wmc/Wwy–1 +t
Mutant YFP (my) sc¼Wmy/Wwc21 sb¼Wmc/Wmy21
the selective effect of the mini-Tn10mutation, andgis the epistasis between the two loci.
To fit this model, for each mutant, we used Equation 1 summed over the four competition assays and their repli-cates, with the parameterization indicated above. Support limits for estimates were computed within 2 units of log-likelihood, all other parameters being freelyfitted.
Expected amount of drift
In our experiments, population size increases by binary
fission. To compute the variance in frequency introduced by drift, wefirst determine that each bacteria division increases this variance by a quantitypq=n2, wherenis the population size at the time of this division. We then sum this variance to the end of population growth:
Xnf
n¼ni
pq n2¼pq
1
ni2
1
nf
þO
1
ni
2
: (4)
We thus expect the variance of selection coefficients contributed by drift to be
s2 s ¼
nf2ni
g2n fnipq;
(5)
where g is the number of generations (6.6 as explained above, over the time course of the competition experiment). The variance in frequency change caused by selective differ-ences among replicates is var(sgpq) = s2
sðgpqÞ
2
. In our experiments we havenf in the range 1082109 and ni 100
times less. These population sizes were estimated by serial dilution and plating (not shown), and these numbers repre-sent the extreme cases. Thus we expect ss to be between
1024 and 3·1024. Significantly larger s
s would indicate
that a source of variation, in addition to sampling error and drift, contributed to differences among replicate com-petitions (e.g., such as randomfluctuations in selection
coef-ficients among replicates).
Results
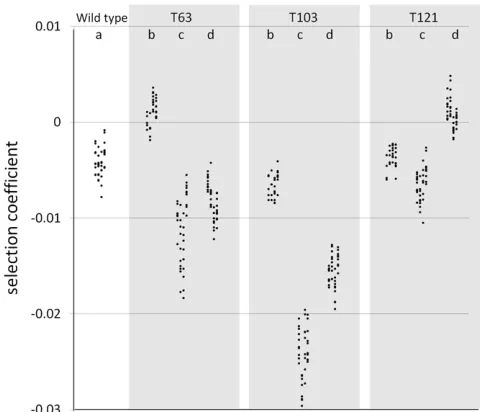
We used aflow cytometric approach to measure thefitness of three mutants, each carrying a single mutation, that were classified as being neutral with conventional methods (Elenaet al.1998). We performed 10 types of competition assays, each replicated 10-fold at each of 4 weeks, giving a total of 400fitness measures (Figure 2). A standard anal-ysis of deviance (Equations 1 and 2) revealed that 96.6% of the deviance was among competition assay types. There were significant week (0.6% of the total deviance), week· competition (1.3%), and replicate (1.4%) effects, although they accounted for a very small fraction of the total devi-ance. In particular, although detectable, the week effect was smaller than the replicate effect (well-to-well variation for the same competition during the same week), indicating that the experiments were repeatable from one week to another.
We also used a simple one-way ANOVA to test whether the standard deviation insmeasures among replicates was con-sistent when measured at different weeks. This was the case, although the repeatability was not extremely high. Specifi -cally, we found that 53% of the variance in this standard deviation was among competitions and 47% within competi-tion between weeks. This variacompeti-tion among competicompeti-tions is significantly larger than across dates for the same competition (F9,30= 3.7,P= 0.003). Repeatability of means and variance at different weeks is crucial for measuring fitness with pre-cision: it is fairly easy to obtain a very precise measure of frequency change in a single assay (or even an exact measure if all individuals in the competition are counted at the begin-ning and the end), but this is not equivalent to obtaibegin-ning an accurate measure of fitness, which must account for inter-replicate variance. As this example shows, analyzing a very large data set also provides sufficient statistical power for detecting very small biological effects, but it can also reveal
“nuisance”effects (almost anything tested becoming“signifi -cant”). To cope with these issues, we used an approach quan-tifying variance components in a mixed model (Equation 3 in
Materials and Methods).
Precision offitness measures
Competition assays provide a direct measure of thefitness of one genotype relative to a competing genotype. To de-termine if the differences we observed in fitness estimates between replicate competitions was biologically meaningful, as opposed to a sampling effect, we used a mixed model to directly estimate the amount of variation in s (ss) beyond
sampling error (Equation 3). This approach provides an es-timate of average selection intensity (s), a measure of bi-ological heterogeneity in selection among replicates (ss),
and standard errors associated with these two parameters. Beyond estimating average selection (s) with some preci-sion, it is important to indicate the magnitude of variation in s (ss) and the precision reached to estimate it. Table 3
presents these estimates for our 10 competition assays. Esti-mates of s (Table 3) range from 0.00088 (T121 YFP) to 20.024 (T103 CFP). Estimates of ss range from 0 to
0.0035, with 7 of 10 estimates being greater than zero. In all cases the precision of these estimates is about60.0002.
The origin of variation in s among replicates
There are four nonexclusive reasons that changes in the frequency of reference and mutant genotypes during com-petitions could be truly different among replicates: (1) experimental error unrelated to sampling (e.g., pipeting), (2) new mutations occurring in some replicated competi-tions, (3) drift, and (4) variation in selection intensity among replicates (e.g., due to cryptic environmental varia-tions). We consider each possibility in turn.
Experimental error is unlikely to be the source of the variation insin our experiment. We repeated each competition type at four dates andsswas consistently low and comparable
unlikely that systematic error would occur only for some com-petition types and even more unlikely that this pattern would be repeatable at different dates. The second hypothesis is that new deleterious or beneficial mutations, unrelated to the mu-tation of interest, may occur during the competition and
in-fluence the outcome. The case of deleterious mutations is not really problematic, because they are unlikely to reach high frequency in a large population and because, if many occur, they will occur equally in the two competing genotypes. The case of beneficial mutations may, atfirst sight, seem trickier. Let us consider a worst-case scenario of the early occurrence of a beneficial mutation providing a growth advantage of 10% per division. If we consider the appearance of this mutant at the very start of the preculture (i.e.,17 generations before the start of the competition assay), its frequency at the end of the competition will be,1025(assuming a competition of 6.6 generations and an effective population size of 106as used in this study), which is too low to have any impact on our measures. Significant frequency variation (above
0.02% in our case) would require a mutation to confer a benefit greater than30% (seeFile S1for details), which is very unlikely in a strain that has been adapted to the environment for 10,000 generations and for which no such mutations have been identified during the early stages of this adaptation, when fitness increases were most rapid (Barrick et al. 2009). Moreover, even if such large-effect mutations were available to our strains, they would have to occur repeatedly in many competitions because our ob-served var(s) is not due to isolated outliers (Figure 2). We note that some mutation types, notably genomic amplifi ca-tions, have been observed to occur at high frequencies and may sometimes confer beneficial effects either directly or indirectly by increasing the mutational target for new muta-tions to occur. However, if these mutamuta-tions occur at a very high rate, they would occur in both competitors and thus have a limited effect on var(s). Furthermore, if the occur-rence ofde novogenomic amplifications were increasing var (s) in our experiments, they should do so in all competition types, and not only in competitions c and d (Figure 3). In summary, we conclude that the rise and spread of new muta-tions is very unlikely to explain our results.
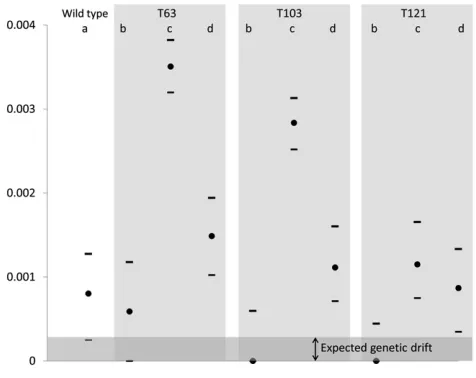
Drift can also cause variation in genotype frequency changes in the different replicates. This process scales with the inverse of population size and should effectively vanish in very large populations. In our experiments, we expect ss
to be between 1024 and 3 · 1024 if it was due to drift alone (seeMaterials and Methods). Our estimates ofss
(Ta-ble 3) varied among the competition assays. In competitions a and b, estimates of ss were not different from the
maxi-mum value that would be expected because of drift (3 · 1024, Figure 3). These competition assays correspond to CFPvs. YFP competitions within the same genetic back-ground. We thus conclude that the cost of expressing the differentfluorescent proteins is not significantly affected by uncontrolled cryptic environmental variation in our experi-ments. Other estimates ofss(in competitions c and d) are
much larger than the drift expectation (Figure 3). One
Table 3 Estimation of the mean (s) and standard deviation (ss) of genotypic selection coefficients per generation in the different competition assays (code infirst column)
ð·1023Þ s Inf Sup SE
eq ss Inf Sup SEeq
Wild type (a) 24.13 23.74 24.53 0.20 0.80 0.25 1.27 0.26
T63 (b) 1.16 1.58 0.74 0.21 0.59 0.00 1.18 0.29
T63 CFP (c) 212.23 211.93 212.63 0.18 3.51 3.20 3.82 0.16
T63 YFP (d) 28.28 27.28 26.28 0.29 1.49 1.02 1.94 0.23
T103 (b) 26.48 26.14 26.81 0.17 0.00 0.00 0.60 0.15
T103 CFP (c) 224.26 224.10 224.82 0.19 2.84 2.52 3.13 0.15
T103 YFP (d) 215.55 214.55 213.55 0.24 1.11 0.71 1.60 0.22
T121 (b) 23.60 23.39 23.80 0.10 0.00 0.00 0.44 0.11
T121 CFP (c) 26.40 25.92 26.87 0.24 1.15 0.75 1.65 0.23
T121 YFP (d) 0.88 1.88 2.88 0.21 0.87 0.35 1.33 0.25
Inf and Sup indicate the inferior and superior support limits of the estimates, respectively. SEeqgives a measure analogous to standard error and equals (sup2inf)/4. All figures are multiplied by 1000.
Figure 2 Selection coefficients (s) of the wild-type (REL4548) and mutant
strains (REL4548 T63, T103, or T121) measured in the (a)wc/wy, (b)mc/
my, (c)my/wc, and (d)mc/wycompetitions. Each point represents ans
measure estimated from a single competition experiment.smeasures are
possibility is that the effect of drift is greater than expected from consideration of population size alone. This may be the case if there was substantial phenotypic diversity in the com-peting populations so that a subset of the population con-tributed disproportionately to population growth. In fact, this explanation seems unlikely. We find a typical value of ssof about 0.001, which would require thatNewas reduced to9% of the actual population (from Equation 5) (Figure 3). This means that drift can explain our observedssonly if
more than 90% of the sampled population is not growing. (In the most extreme case, ,1% of the population would have to be growing (T63, competition c). Studies performed onE. colipopulations showing that only a few percent of the total population were in an “atypical”nongrowing physio-logical state during exponential population growth (Balaban
et al.2004; Levin and Rozen 2006) support the conclusion that phenotypic variation is not sufficient to account for variance among replicates in some of our competitions.
In cases where variation is too high to be explained by drift (competitions c and d), variation necessarily implies that selection intensity changes slightly among replicates, perhaps due to environmental variation among replicates. Further-more, ss estimates were larger for large jsj (Pearson r =
0.69), a situation that would be expected when different competitors have environmental tolerance curves with differ-ent slopes (i.e., aG · E effect). In this case environmental variation will not necessary affect both competitors with the same intensity. Thus, small environmental variations across replicated competitions can have a nonnegligible impact on ss. Both the high values ofss(compared to the drift
expec-tation) and its pattern of variation (larger in assays with large
fitness differences) support the conclusion that, even under
very controlled and standardized conditions, cryptic environ-mental variation has a detectable impact onfitness measures. Fitness transitivity
Population genetic models of selection usually consider
fitness effects to be transitive between competing genotypes. In this view,fitness can be associated with a given genotype rather than being defined locally relative to particular competitors. [There are, of course, particular frequency-dependent selection schemes that can generate nontransi-tivefitness measures (e.g., Sinervo and Lively 1996).] Meth-odologically, transitivity is also an important assumption in inferring allelic from genotypicfitness effects, as when using a marker to infer the effect of a mutation. Our experimental design allows us to test for departures from transitivity be-cause we measured relative fitness in four combinations of genotypes pairs (seeMaterials and Methods). Specifically, to test for transitivity, we need to make three estimates for a mutation: (1) the allelic cost of the marker, (2) the allelic effect of the mutation, and (3) the epistasis between both. With three competitions, we have three equations and three unknowns. Thus, adding one competition adds one equation and provides a means to estimate a departure from consis-tency (i.e., transitivity) among competition types. We found that t, a parameter measuring deviations from transitivity, was not significantly different from zero for competitions involving the T63 and T121 mutants (LRT; Table 4), mean-ing that fitness was transitive. By contrast, t was signifi -cantly different from zero for T103, but this departure was quite small (t = 20.00171 6 0.0003) and, more impor-tantly, very small compared to thefitness differences mea-sured in those competition assays (Table 4).
Allelicfitness and epistasis
To test for epistasis between our markers and the focal mutations, we decomposed genotypicfitness into the allelic effects of the marker and the mutation and their interaction
Table 4 Estimation of allelic selection coefficients per generation in the different competition assays (the subscript refers to the mutant T63, T103, or T121)
Parameter Estimate ð·1023Þ SE
eqð·1023Þ Sign.
a 24.13 0.14 ***
b63 212.27 0.22 ***
g63 5.28 0.22 ***
t63 20.13 0.30 NS
b103 217.89 0.22 ***
g103 22.23 0.22 ***
t103 21.71 0.30 **
b121 22.81 0.22 ***
g121 0.55 0.22 *
t121 20.48 0.30 NS
ais the cost of the marker (bacteria expressing thefluorescent proteins CFP having a 0.4% cost relative to those expressing YFP).bare the allelic effects of the three random mutations. gare the epistasis between the random mutations and the marker.tmeasures departure from transitive genotypicfitness. SEeqgives a measure
analogous to standard error and is a quarter of the support range. Sign. (signifi -cance) indicates whether the estimates are different from zero (LRT). NS, nonsignif-icant. Allfigures are multiplied by 1000.***P-value,0.001;**P-value,0.01.
Figure 3 Variance in selection coefficients (ss estimate bold point6 support limits indicated by bars) of the wild-type (REL4548) and mutant
strains (REL4548 T63, T103, or T121) measured in the (a)wc/wy, (b)mc/
my, (c) my/wc, and (d) mc/wy competitions. The predicted variation expected by genetic drift alone is represented by the shaded line at the
(epistasis). The expression of CFP was more costly than YFP (a 0.4% difference in the wild type) and the allelic effect of mutations was21.2%,21.7%, and20.3% for T63, T103, and T121, respectively (Table 4). However, we detected significant differences betweenfitness effects of the same mutations when measured in the CFP and YFP backgrounds, indicating the existence of epistasis between the marker and the three indi-vidual mutations. Even though the strength of epistatic inter-actions was quite small, it could represent an important part of the genotypic selection coefficients. For instance, for T63, epis-tasis was larger than the cost of the marker and represented 43% of the allelic mutational effect. For the two other muta-tions, the quantitative importance of epistasis was much smaller. A caveat to our interpretation of epistasis is that it is possible that we inadvertently introduced secondary mutations into genotypes during some step required for strain construc-tion (see Materials and Methods). Since we observed fitness differences with the three mutants we tested, the hypothesis of secondary mutation introduction supposes a very high rate of such mutations during P1 transduction.
Discussion
In a large population, even mutations with very smallfitness effects can play a role in the process of adaptation. However, studying them empirically is a significant practical chal-lenge. Measurement error and drift obviously limit the precision of fitness measures that can be obtained experi-mentally. Is it possible to measure selection up to a limit imposed by the noise produced by sampling error and drift? If not, how close to this limit can we go? We addressed these questions by performing competition experiments in large
E. coli populations (to minimize drift) and by tracking fre-quency changes usingflow cytometry to count marked cells (to minimize sampling error).
Our experiments are based on short-term batch cultures (6.6 generations). This design has several convenient features. First, it is a relatively simple experimental set-up that can be massively replicated. Second, it reduces, although does not eliminate, the complication of newly arising mutations. Third, it entirely accounts for the effect of the marker. Finally, it avoids the complication of using time series data.
Cryptic variation in s
A surprising, and we think important, result was that, for some competitions types, selection was variable across replicates, probably because of cryptic environmental vari-ation to which the competing genotypes had different sensitivity. Although not empirically excluded, the alterna-tive hypothesis that variation in estimates ofswas caused by beneficial mutations spreading in a large number of the batch cultures, seems unlikely for two reasons: (1) such mutations would have to confer a very large benefit (un-likely to appear in a strain that has evolved in the same environment for 10,000 generations) and (2) adaptive mutations would increase var(s) in all competition types,
not only in competitions c and d. Such variation arose de-spite considerable effort to perform all competitions in pre-cisely controlled conditions. In an absolute sense, this variation was not large (although much larger than our pre-cision), but it supports the idea that the effect of mutations can be strongly context dependent. For instance, it is possi-ble that if our experiment was performed in a different lab, thes andssmight be slightly different (because of
differ-ences in the average environment or in the magnitude of microenvironmental fluctuations, respectively). A fortiori, we expectssto be even larger under environmentally
het-erogeneous natural conditions. These observations raise the question of whether selection coefficients should be de-scribed by only their mean valuess, or more appropriately by distributions (with two parameterssandss), and
conse-quently if mutations are appropriately described as benefi -cial, neutral, or deleterious, since their effects are context dependent, even within controlled laboratory environments. So far, population genetic models do not typically consider thatsvalues are distributed, such that one mutation can have very different fates depending on itsss. For instance, the
prob-ability offixation of a mutation withs= 0 andss.0 will not
be driven by drift only, as described by the neutral theory, but will depend on the environmental pattern responsible forss.0 (see, e.g., Ewens 1979). In any case, much more
attention should be paid to variable selection coefficients and their evolutionary impact. The experimental design and statis-tical analysis we propose here offers an efficient and new approach to doing that.
Epistasis with the marker
In competition experiments with microbes, the neutrality of the marker is always verified; however, the potential epistatic interactions between the marker and mutations is not usually systematically investigated. Controlling for this issue requires switching the markers between backgrounds [to perform complementary competition assays (Dykhuizen and Hartl 1980)] and a high level of precision. We found epistatic inter-actions between the inserted mutations and the fluorescent marker in all cases, suggesting that epistatic effects, although perhaps very small, may be common. Such interactions com-plicate measures ofsbecause they require separating the MFE from the marker cost and the epistatic interactions between them. We note that if we had found that epistatic effects were of a similar size to (or larger than) the allelic effects it would have raised the concern that the compared strains may not have been isogenic. This was not the case in our experiment; nevertheless, we cannot formally exclude the possibility that transformation and P1 transduction manipulations did not introduce any secondary mutations.
Transitivity
organisms (Richmond et al.1975; Goodman 1979; Paquin and Adams 1983; De Visser and Lenski 2002; Bell 2008). The main conclusion is that fitness tends to be transitive unless special social interactions are present. Like for any
“null hypothesis,”it is, however, important to realize that the statistical power of an experiment gives an inherent limit to the detectable departure of transitivity. In our experiment, we tested this hypothesis and did not find consequential departures from transitivity in the genotypic fitness meas-ures (Table 4). Given our high statistical power, thisfinding represents a strong internal check that our experimental results are robust. The fact thatfitness effects are transitive is also an important result in simplifying experiments: with-out the need to check for transitivity, only three types of competition need to be performed to estimate allelic effects and epistasis (instead of four in our design).
Precision offitness measures and the statistics of selection
Although sampling error and drift can make it difficult to measure smallfitness effects, replicated measures will tend not to significantly differ from each other. Consequently, a singlefitness value can be legitimately attributed to a given genotype in a given environment and the precision of this estimate can be determined as the standard error of the mean fitness effect across replicates. New high-throughput counting methods alleviate limits due to sampling error and drift. Here, we show that such methods can reveal that replicated measures differ from one another for a given genotype in a given environment—i.e., that var(s) is signif-icantly greater than the value expected by drift and sam-pling error alone. This situation challenges the simple concept of precision mentioned above. When confronted with this problem, one approach is to do “as usual” and neglect the observation that replicates differ. In this case, providing only a meanfitness effect and its standard error do not reflect the actual precision of the experiment. In particular, it fails to acknowledge that replicates may differ beyond this standard error. The second approach is to admit that replicates actually differ and represent different draws in a distribution offitness effects, even if the environment is supposed constant. If selection coefficients are distributed, it is thus necessary to measure the mean effect, but also the variance, and possibly higher moments (skewness, kurtosis, etc.) of the distribution ofsvalues. The concept of precision in this case must incorporate estimates of these moments and their standard errors. This is the approach we have taken, introducing the use of a mixed model that allowed us to decompose sources of variation in frequency change (sampling error, drift, environmental variation ofs).
We measurefitness on the basis of frequency change as in classical population genetics (Dykhuizen and Hartl 1980; Arnason and Barker 1999), which differs from common practices in experimental evolution (Chevin 2010), where
fitness is measured as a ratio of growth rates (e.g., Lenski
et al. 1991). We also fully use the information on the
in-dividual precision of fitness estimates (determined by the sampling effort: the number of colonies counted when plat-ing, or the number of cells counted with flow cytometry), which is not usually reported with fitness competition experiments. Thus, we can discriminate between sampling error and other sources of variance across replicates (due to drift, variance in s, etc.), which greatly enhances the infor-mation that can be extracted from the data. By considering these factors, we were able to measure mean and variance in selection coefficients down to a precision of 0.02% (Tables 3 and 4). Regarding mean selection, this precision represents a 10-fold improvement over typical studies using flow cytometry (Lunzer et al. 2002; Ali and Yang 2006; Lee
et al. 2009) and is comparable to the precision reached in Zhuet al.(2005). More importantly, as explained above, the massive replication we used also provides a precise measure of the variance of selection coefficientss(60.02%).
Neutralist vs. selectionist
The neutral theory of molecular evolution proposes that the fate of many mutations is governed by the effect of drift (Kimura 1983). The development of precise fitness meas-ures was used in the neutralist/selectionist controversy on proteins to determine if allozymes differed in terms of selec-tion (Dykhuizen and Hartl 1980). Today, this debate has shifted toward smaller fitness effects at the molecular level (Kreitman 1996; Nei 2005). The analysis of sequence poly-morphism provides different indirect ways to confront neu-tralistvs.selectionist expectations. For most mutations, it is usually thought that there is no alternative to resolving this question. Measuring s with ever-increasing precision may start to change this perspective and may help to answer some of the key questions fueling this debate. As we have already seen in our study, mutations formerly considered as neutral (albeit in a slightly different medium, DM25 in Elena
et al. 1998) actually confer small, but significant, fitness effects. Importantly, even in an apparently constant environ-ment, their effect is best understood as being distributed, which complicates straightforward application of discrete classifications (deleterious/neutral/beneficial), and which would have to be accounted for in theoretical expectations,
e.g., for the analysis of sequence polymorphism.
was kept as consistent as possible. Increased sampling effort, larger population sizes, or longer lasting experiments are not likely to resolve this issue. It is thus unclear how far precision in fitness measurement can be improved. It all relies on understanding the sources of variation, and con-trolling them, whenever possible. Would it be possible to measure the fitness effects of synonymous mutations or mutations occurring in noncoding sequences? We cannot answer these questions yet; however, our method is a step in that direction and it will certainly help to bridge the gap between studies measuringsexperimentally and studies in-ferring s from genetic sequences (see Eyre-Walker and Keightley 2007 for review).
Acknowledgments
We thank E. Flaven, M.-P. Dubois for lab management, C. Duperray (IRB–Montpellier), C. Mongellaz (IGM, Montpellier), and the Montpellier RIO Imaging platform for training R.G. toflow cytometry and their help in designing the cytometer protocols, N. Le Meur for her help with the flowCore R package, and L. M. Chevin, P. A. Gros, G. Martin, and F. Rousset for fruitful discussions and insightful comments. We also thank two anonymous reviewers for useful com-ments. This work was supported by the European Research Council Starting Grant ‘Quantevol’ to T.L. and a National Science Foundation grant (IOS-1022373) to T.F.C.
Literature Cited
Ali, A., and O. O. Yang, 2006 A novel small reporter gene and HIV-1fitness assay. J. Virol. Methods 133: 41–47.
Arnason, E., and J. Barker, 1999 Analysis of selection in labo-ratory andfield populations, pp. 182–203 inEvolutionary Ge-netics: From Molecules to Morphology, edited by R. Singh, and C. Krimbas. Cambridge Univ. Press, Cambridge, UK.
Arnason, E., and R. C. Lewontin, 1991 Perturbation–reperturbation test of selectionvs.hitchiking ofthe 2 malor alleles of esterase-5 in Drosophila pseudoobscura. Genetics 129: 145–168.
Balaban, N. Q., J. Merrin, R. Chait, L. Kowalik, and S. Leibler, 2004 Bacterial persistence as a phenotypic switch. Science 305: 1622–1625.
Barrick, J. E., D. S. Yu, S. H. Yoon, H. Jeong, T. K. Oh et al., 2009 Genome evolution and adaptation in a long-term exper-iment withEscherichia coli. Nature 461: 1243–1274.
Bataillon, T., and M. Kirkpatrick, 2000 Inbreeding depression due to mildly deleterious mutations infinite populations: size does matter. Genet. Res. 75: 75–81.
Beatty, J., 1984 Chance and natural selection. Philos. Sci. 51: 183–211.
Bell, G., 2008 Selection: The Mechanism of Evolution. Oxford Univ. Press, Oxford.
Bell, G., 2010 Fluctuating selection: the perpetual renewal of ad-aptation in variable environments. Philos. Trans. R. Soc. B-Biol. Sci. 365: 87–97.
Bollback, J. P., T. L. York, and R. Nielsen, 2008 Estimation of 2N(e) s from temporal allele frequency data. Genetics 179: 497–502. Carrasco, P., F. de la Iglesia, and S. F. Elena, 2007 Distribution of
fitness and virulence effects caused by single-nucleotide substi-tutions in tobacco etch virus. J. Virol. 81: 12979–12984.
Charlesworth, B., and D. Charlesworth, 1998 Some evolutionary consequences of deleterious mutations. Genetica 103: 3–19. Chevin, L.-M., 2010 On measuring selection in experimental
evo-lution. Biol. Lett. 7: 210–213.
Clark, A., 1979 Effects of interspecific competition on the dynam-ics of a polymorphism in an experimental population of Dro-sophila melanogaster. Genetics 92: 1315–1328.
Datsenko, K. A., and B. L. Wanner, 2000 One-step inactivation of chromosomal genes inEscherichia coliK-12 using PCR products. Proc. Natl. Acad. Sci. USA 97: 6640–6645.
de Visser, J. A. G. M., and R. Lenski, 2002 Long-term experimental evolution inEscherichia coli. XI. Rejection of non-transitive in-teractions as cause of declining rate of adaptation. BMC Evol. Biol. 2: 19.
Dobzhansky, T., and O. Pavlovsky, 1957 An experimental study of interaction between genetic drift and natural selection. Evolu-tion 11: 311–319.
Domingo-Calap, P., J. M. Cuevas, and R. Sanjuan, 2009 Thefi t-ness effects of random mutations in single-stranded DNA and RNA bacteriophages. PLoS Genet. 5: e1000742.
Dykhuizen, D., and D. Hartl, 1980 Selective neutrality of 6PGD allozymes in Escherichia coli and the effects of genetic back-ground. Genetics 96: 801–817.
Dykhuizen, D. E., and D. L. Hartl, 1983 Selection in chemostats. Microbiol. Rev. 47: 150–168.
Elena, S. F., L. Ekunwe, N. Hajela, S. A. Oden, and R. E. Lenski, 1998 Distribution offitness effects caused by random insertion mutations inEscherichia coli. Genetica 102–3: 349–358. Ewens, W. J., 1979 Mathematical Population Genetics.
Springer-Verlag, Berlin.
Eyre-Walker, A., and P. D. Keightley, 2007 The distribution of
fitness effects of new mutations. Nat. Rev. Genet. 8: 610–618. Felsenstein, J., 1976 The theoretical population genetics of
vari-able selection and migration. Annu. Rev. Genet. 10: 253–280. Fisher, R. A., 1930 The Genetical Theory of Natural Selection.
Oxford Univ. Press, Oxford.
Goodman, D., 1979 Competitive hierarchies in laboratory Dro-sophila. Evolution 33: 207–219.
Kimura, M., 1983 The Neutral Theory of Molecular Evolution, Cambridge Univ. Press, Cambridge, UK.
Kleckner, N., J. Bender, and S. Gottesman, 1991 Uses of transpo-sons with emphasis on Tn10. Methods Enzymol. 204: 139–180. Kreitman, M., 1996 The neutral theory is dead: long live the
neutral theory. BioEssays 18: 678–683.
Labbe, P., N. Sidos, M. Raymond, and T. Lenormand, 2009 Resistance gene replacement in the mosquito culex pipiens:fitness estimation from long-term cline series. Genetics 182: 303–312.
Lee, M. C., H. H. Chou, and C. J. Marx, 2009 Asymmetric, bi-modal trade-offs during adaptation of methylobacterium to dis-tinct growth substrates. Evolution 63: 2816–2830.
Lenormand, T., and M. Raymond, 2000 Analysis of clines with variable selection and variable migration. Am. Nat. 155: 70–82. Lenormand, T., D. Roze, and F. Rousset, 2009 Stochasticity in
evolution. Trends Ecol. Evol. 24: 157–165.
Lenski, R. E., M. R. Rose, S. C. Simpson, and S. C. Tadler, 1991 Long-term experimental evolution inEscherichia coli. I. Adaptation and divergence during 2,000 generations. Am. Nat. 138: 1315–1341.
Levin, B. R., and D. E. Rozen, 2006 Opinion: non-inherited anti-biotic resistance. Nat. Rev. Microbiol. 4: 556–562.
L’Heritier, P., and G. Teissier, 1937a Elimination of the mutant forms in Drosophila populations: case of Drosophila with the “ebony gene.”C. R. Seances Soc. Biol. Fil. 124: 882–884. L’Heritier, P., and G. Teissier, 1937b Elimination of the mutant
Lunzer, M., A. Natarajan, D. E. Dykhuizen, and A. M. Dean, 2002 Enzyme kinetics, substitutable resources and competi-tion: from biochemistry to frequency-dependent selection in lac. Genetics 162: 485–499.
Lynch, M., 1987 The consequences of fluctuating selection for isozyme polymorphisms inDaphnia. Genetics 115: 657–669. Manly, B. F. J., 1985 The Statistics of Natural Selection. Chapman
& Hall, London.
Millstein, R. L., 2008 Distinguishing drift and selection empirically: “the great snail debate”of the 1950s. J. Hist. Biol. 41: 339–367. Nei, M., 2005 Selectionism and neutralism in molecular
evolu-tion. Mol. Biol. Evol. 22: 2318–2342.
Oakeshott, J. G., S. R. Wilson, and J. B. Gibson, 1983 An attempt to measure selection coefficients affecting the alcohol-dehydro-genase polymorphism in Drosophila melanogaster populations maintained on ethanol media. Genetica 61: 151–159.
O’Hara, R. B., 2005 Comparing the effects of genetic drift and
fluctuating selection on genotype frequency changes in the scar-let tiger moth. Proc. Biol. Sci. 272: 211–217.
Orr, H. A., 2005 The genetic theory of adaptation: a brief history. Nat. Rev. Genet. 6: 119–127.
Paquin, C., and J. Adams, 1983 Frequency offixation of adaptive mutations is higher in evolving diploid than haploid yeast pop-ulations. Nature 302: 495–500.
Peris, J. B., P. Davis, J. M. Cuevas, M. R. Nebot, and R. Sanjuan, 2010 Distribution offitness effects caused by single-nucleotide substitutions in bacteriophagef1. Genetics 185: 603–609. Remold, S. K., and R. E. Lenski, 2001 Contribution of individual
random mutations to genotype-by-environment interactions in Escherichia coli. Proc. Natl. Acad. Sci. USA 98: 11388–11393.
Richmond, R. C., M. E. Gilpin, S. Perezsalas, and F. J. Ayala, 1975 Search for emergent competitive phenomena: dynamics of multispecies drosophila systems. Ecology 56: 709–714. Rosenfeld, N., J. W. Young, U. Alon, P. S. Swain, and M. B. Elowitz,
2005 Gene regulation at the single-cell level. Science 307: 1962–1965.
Rousset, F., 2004 Genetic Structure and Selection in Subdivided Populations. Princeton Univ. Press, Princeton.
Saccheri, I. J., F. Rousset, P. C. Watts, P. M. Brakefield, and L. M. Cook, 2008 Selection and geneflow on a diminishing cline of melanic peppered moths. Proc. Natl. Acad. Sci. USA 105: 16212–16217.
Sanjuan, R., A. Moya, and S. F. Elena, 2004 The distribution of
fitness effects caused by single-nucleotide substitutions in an RNA virus. Proc. Natl. Acad. Sci. USA 101: 8396–8401. Sinervo, B., and C. M. Lively, 1996 The rock-paper-scissors game
and the evolution of alternative male strategies. Nature 380: 240–243.
Thatcher, J. W., J. M. Shaw, and W. J. Dickinson, 1998 Marginal
fitness contributions of nonessential genes in yeast. Proc. Natl. Acad. Sci. USA 95: 253–257.
Wilson, S. R., J. G. Oakeshott, J. B. Gibson, and P. R. Anderson, 1982 Measuring selection coefficients affecting the alcohol-dehydrogenase polymorphism in Drosophila melanogaster. Ge-netics 100: 113–126.
Wolfram Research, 2008 Mathematica, v. 7.0, Champaign, IL. Zhu, G. P., G. B. Golding, and A. M. Dean, 2005 The selective
cause of an ancient adaptation. Science 307: 1279–1282.
GENETICS
Supporting Information
http://www.genetics.org/content/suppl/2011/10/31/genetics.111.133454.DC1
Measuring Selection Coefficients Below 10
3:
Method, Questions, and Prospects
Romain Gallet, Tim F. Cooper, Santiago F. Elena, and Thomas Lenormand!"
"
!
"##$%&%'()*+,&)(%*-)$!,
!"
-./01234./,45,260,761484/489:,5:;410/70.2,891<01/,
#"
$%&" '()" *+," -()" .&+&/" 0&1&" 2+/&13&," *3" 3%&"
!"#$
" 4567/" 58" 9:;<=<>" 7/2+." 3%&" 5+&?/3&@"
A"
2+*632B*325+"58"6%15C5/5C*4".&+&/"3&6%+2D7&",&B&45@&,"EF"G*3/&+H5"I"J*++&1"KG
L$M:NOP"
<"
*+," J
LNN:9" #QQQRS" @TLA#?'()" *+," @T:!9?-()" ?" @4*/C2,/" H2+,4F" @15B2,&," EF" G1" U26%*&4"
="
:45023V"?"0&1&"7/&,"*/"3&C@4*3&/S"
W"
$%&" 821/3" /3&@" 58" 3%2/" 65+/3176325+" 0*/" 35" 2+315,76&" 3%&" )
L!" KE*63&125@%*.&"
λ
" @15C53&1R"
X"
7@/31&*C"58"3%&"-()"*+,"'()".&+&/S"Y&6*7/&"3%&"'()"*+,"-()"/&D7&+6&/"K024,?3F@&"65,5+/Z"
>"
,&B&45@&,"EF"[+2B&1/23F"58"J*/%2+.35+"'&*/3"9&/5716&"-&+3&1R"5+4F",288&1"EF"#Q"+764&532,&/"
\"
K573"58"X!X"E@RZ"3%&"/*C&"@12C&1/"6574,"E&"7/&,"851"E53%")-9/S"$%&"@12C&1")?Y/@]^?@15CL!?
!Q"
'-_()"851"K!Q\"E*/&/R"2/"65C@5/&,"58"*"=`"$-$-"3*24"K2+61&*/2+.",2.&/325+"&88262&+6F"EF"Y/@]^RZ"
!!"
*"Y/@]^"1&/3126325+"/23&Z"3%&")
L!"@15C53&1"65+3*2+2+."*"12E5/5C&"E2+,2+."/23&"K1E/R"*+,"*"#Q"E@"
!#"
/&D7&+6&"%5C545.57/"35"3%&"'()"*+,"-()".&+&/"=`"&a31&C23F"K/&&"/7@@4&C&+3*1F"C*3&12*4/"
!A"
851" @12C&1" /&D7&+6&/" *+," )-9" C2aRS" $%&" )?-4*^?'-_()" 1&B" @12C&1" 2/" 65C@5/&," 58" *" =`" $-$-"
!<"
3*24Z" *" -4*^" 1&/3126325+" /23&" *+," *" #Q" E@" /&D7&+6&"%5C545.57/" 35" 3%&" '()" *+," -()" .&+&/" A`"
!="
&a31&C23FS"$%&"1&/7432+.")-9"@15,763/"0&1&"+*C&,")
L!?-()"*+,")
L!?'()S"
!W"
$%&"/&65+,"/3&@"65+/2/3&,"2+"645+2+."3%&")
L!?-()"*+,")
L!?'()"2+"@OG<"KG
L$M:NOP"*+,"J
LNN:9"
!X"
#QQQRS")
L!?-()"*+,")
L!?'()"0&1&",2.&/3&,"EF"Y/@]^"*+,"-4*^Z"*+,"3%&+".&4"@71282&,S"@OG<"0*/"
!>"
821/3" ,2.&/3&,"EF" Y/@]^" *+," -4*^Z" *+," 3%&+" 31&*3&,"023%" /%12C@" *4H*42+&" @%5/@%*3*/&" KML)RS"
!\"
$%&" ML)" 6*3*4FV&/" 3%&" 1&4&*/&" 58" =b?" *+," Ab?@%5/@%*3&" .157@/" 815C" GNLZ" @1&647,2+." 3%&"
#Q"
42.*325+"58"3%&"42+&*12V&,"@4*/C2,"023%"3%&"1&C*2+2+."@OG<"Y/@]^?-4*^"81*.C&+3/S"(2+*44FZ")
L!?
#!"
-()"*+,")
L!?'()"0&1&"645+&,"2+"@OG<"EF"7/2+."*"$<"42.*/&S";2.*325+"@15,763/"6*44&,"@OG<?-()"
##"
*+,"@OG<?'()"0&1&"&4&6315@51*3&,"2+35"G]=?
α
"
λ
?@21Z"*+,"@4*3&,"5+";Y"@4*3&/"/7@@4&C&+3&,"
#A"
023%" =Q"
µ
._C;" O*+*CF62+" K;YL?O*+RS" (4751&/6&+3" 6545+2&/" 0&1&" @71282&," EF" /31&*H2+." 5+"
#<"
81&/%";YL?O*+"@4*3&/Z"*+,"3%&"+&a3",*FZ"*"6545+F"0*/"2+5674*3&,"2+"42D72,";Y?O*+S"
#="
L83&1" 2/54*325+" 023%" c2*.&+" C2+2@1&@" H23Z" @OG<?'()" *+," @OG<?-()" @4*/C2,/" 0&1&" 7/&," */"
#W"
3&C@4*3&/"2+"*"/&65+,")-9"2+"0%26%"3%&"@15C53&1"/&D7&+6&Z"3%&"84751&/6&+3".&+&/"*+,"3%&"
#X"
O*+*CF62+" 6*//&33&" 6*112&," EF" @OG<Z" 0&1&" *C@4282&," K/&&" G
L$M:NOP" *+," J
LNN:9" #QQQ" 851"
#>"
File S1
Supporting Information
!"
"
#$%&" '&()*+,-." /0&" 1%*#&%," 2,&'" *3" (0*," ,&4$3'" 567" 8" 1819:;870)<=>8!?@A8!???" B$%" C?;"
>"
D),&,-" )3'" 1819:;1!=!8>;E@8>;FF%&G" CFE" D),&,-" H" 4$3()*3&'" &*(0&%" )" I)#=J" $%" )" K)+J"
!"
%&,(%*4(*$3" ,*(&" )(" (0&*%" LM" &N(%&#*(*&," C%&,(%*4(*$3" ,*(&," 3$(" 2,&'" *3" (0*," ,(2'O-P" B*B(O" D),&,"
A"
0$#$+$Q$2,"$B"(0&"
!"#$%&'
"
()*+
"+$42,")3'"(0&"!>"$%"!F"D),&,"0$#$+$Q$2,"($"(0&"(+)(&")("
;"
(0&*%" AM" &N(%&#*(*&,." /0&" %&,2+(*3Q" 567" 1%$'24(," R&%&" &+&4(%$1$%)(&'" *3($" 7ST;L;?"
L"
4$#1&(&3(" 4&++," 4)%%O*3Q" (0&" (0&%#$,&3,*(*G&" 1+),#*'" 19:;@" C:</KSU9V" )3'" W<UUS7" !XXX-"
@"
)3'"(%)3,B$%#&'"4&++,",1%&)'"$3"TI<89)3"C*342D)(*$3")("AFY6"*3"$%'&%"($"Q&("%*'"$B"19:;@-."
F"
Z+2$%&,4&3(" %&4$#D*3)3(," R&%&" ,(%&)[&'" $3" TI<89)3" B$%" 12%*B*4)(*$3P" )3'" $3" TI<8<#1" CLX"
?"
µ
Q\#+" <#1*4*+*3-" ($" 40&4[" B$%" (0&" +$,," $B" 19:;@." 567," R&%&" 4)%%*&'" $2(" $3" %&4$#D*3)3("
E"
4+$3&," R*(0" (R$" ,&(," $B" 1%*#&%," CR*(0" )" B$%R)%'" 1%*#&%" 1819:;8!?@A8!???" ,1&4*B*4" ($" (0&"
>X"
*3,&%(P"$%"1870)<8B$%",1&4*B*4"($"(0&"
()*+
"Q&3&P")3'"(0&"%&G&%,&"1%*#&%"70)<8>!@!8>!;A8%&G"
>>"
,1&4*B*4" ($" (0&"
()*+
" Q&3&-" ($" 40&4[" (0)(" (0&" *3,&%(*$3" $B" 6Z589)3" )3'" ]Z589)3" 4),,&((&,"
>!"
$442%%&'")("(0&"%*Q0("+$42,."
>A"
/0&" &N4*,*$3" $B" (0&" [)3)#O4*3" %&,*,()34&" 4),,&((&P" 4$%%&,1$3'*3Q" ($" (0&" +),(" ,(&1" $B" (0*,"
>;"
4+$3*3QP" R)," 1&%B$%#&'" DO" (0&" &+&4(%$1$%)(*$3" )3'" *3'24(*$3" $B" (0&" 1+),#*'" 165!X"
>L"
C:</KSU9V" )3'" W<UUS7" !XXX-." /%)3,B$%#)3(," R&%&" B*%,(" 42+(*G)(&'" )(" AXY6" $3" TI<8<#1"
>@"
1+)(&,."/0&"B+*1),&"1%$'24(*$3"C)++$R*3Q"(0&"%&4$#D*3)(*$3"$B"(0&"Z7/",&^2&34&,",2%%$23'*3Q"
>F"
(0&"9)3)#O4*3"4),,&((&-"R),"*3'24&'"DO",(%&)[*3Q"4$+$3*&,"B%$#"(0&"TI<8<#1"1+)(&,P"$3"TI"
>?"
1+)(&," )(" ;!Y6." /$" 40&4[" B$%" 9)3)#O4*3" %&,*,()34&" 4),,&((&" %&#$G)+" )3'" +$,," $B" 165!XP"
>E"
4$+$3*&,"R&%&",(%&)[&'"$3"TI<P"TI<89)3")3'"TI<8<#1"1+)(&,."567,"$3"(0&"
()*+
"+$42,"R&%&"
!X"
1&%B$%#&'"$3";L;?"6Z5"9)3
K"<#1
K")3'";L;?"]Z5"9)3
K"<#1
K"4+$3&,"),"R&++"),"$3";L;?P";L;?"
!>"
6Z589)3")3'";L;?"]Z589)3."I$(0"(0&"9)3
K"),,$4*)(&'"R*(0")"B+2$%&,4&3("10&3$(O1&")3'"(0&"
!!"
,*_&"$B"(0&"567"1%$'24(,"4$3B*%#&'"(0&"%&#$G)+"$B"(0&"[)3)#O4*3"4),,&((&")3'"(0&"*3,&%(*$3"
!A"
$B"(0&"B+2$%&,4&3("Q&3&,."
!;"
"
!L"
!"#$%"&'%()%*+%'&
!@"
U)#&"
K&^2&34&"
6$3,(%24(*$
3",(&1"
7&B&%&34&"
58I,1=J8
1<>8
/6/6