ISSN(Online): 2320-9801
ISSN (Print): 2320-9798
I
nternational
J
ournal of
I
nnovative
R
esearch in
C
omputer
and
C
ommunication
E
ngineering
(An ISO 3297: 2007 Certified Organization)
Vol. 4, Issue 9, September 2016
Comparative Study based on Transform
Techniques for Signal Detection
Subhani Shaik1, P.N Varalakshmi K2, Dr.Uppu Ravibabu3, E.Ravindra Reddy4, Shaik Subhani5, Latha A6
Research Scholar, Dept. of CSE., Acharya Nagarjuna University, Andhra Pradesh, India1
Assistant Professor, Dept. of CSE., Tirumala Engineering College, Narasaraopet, Andhra Pradesh, India2
Professor, Dept. of CSE, Andhra Pradesh, India3
Assistant Professor, Dept. of CSE., St.Mary’s Group of Institutions, Guntur, Andhra Pradesh, India4
Assistant Professor, Dept. of CSE, St.mary’s Women’s Engineering College, Guntur, Andhra Pradesh, India5
Professor & Dean, St.mary’s Women’s Engineering College, Guntur, Andhra Pradesh, India6
ABSTRACT: Detection and classification of an unknown signal in noisy data is crucial task for signal processing. Under this situation, the extraction of features becomes difficult and high frequency spectrum overlap with the frequency of fault. This paper presents a comparative study based on transform techniques for signal detection. Realization of transforms with distinct classifiers generates different performance correspond to the desired signal. Statistical analysis shows that, Curvelet transform is a better than other transforms available for detecting the noisy data. The motive behind is ability of sparse representation that are critical for detection, estimation of signal which are noised and weak.
KEYWORDS: Curvelet transform; Signal Detection; SNR; PCA; Sparse Vector.
I. INTRODUCTION
The detection and extraction of an unknown signal in noise is important issue in signal processing. When a signal is severely corrupted by strong background noise, it is usually very difficult to perform signal detection and parameter estimation in either the time domain or the frequency domain. By taking the time frequency transform, random noise tends to escalation its energy over the entire time frequency domain, while signals often concentrate their energy within limited time intervals and Frequency. Consequently by representing the signal and noise in the joint frequency domain, signal detection much easier. By applying time-varying frequency filtering, The SNR can be enhanced. If we can distinguish those coefficients that belong to the signal from the once that belong to the noise those coefficients can be utilized to remake the signal simply by taking the inverse time frequency transform.
This paper is presented as follows. In the next section, we discussed about the different transforms techniques. Section 3 describes Realization of transforms for signal detection. Results and discussions are shown in Section 4 and Section 5 concludes the paper.
II. BACKGROUND WORK
A. CHIRPLET TRANSFORM
The chirplet transform is the generalized form of fast Fourier Transform, short-time Fourier transform, and wavelet transform. It has the most supple time frequency window and successfully used in practices. It is considered as the “phase correction” of the Chirplet Wavelet Transform (CWT). The CWT W (b, a) of a function h (t) is defined by W (b, a) = ∫∞∞h(t)w(t−b, a)dt ………..………..…..(1)
Where w is scaled replica of the fundamental mother wavelet and a determines the width of the wavelet w and controls the resolution.
ISSN(Online): 2320-9801
ISSN (Print): 2320-9798
I
nternational
J
ournal of
I
nnovative
R
esearch in
C
omputer
and
C
ommunication
E
ngineering
(An ISO 3297: 2007 Certified Organization)
Vol. 4, Issue 9, September 2016
Copyright to IJIRCCE DOI: 10.15680/IJIRCCE.2016. 0409014 15790 W (t, f) = f + iq / √2π e- t2 (f2 – iq) / 2 e (2πft + qt2) ………....…..(2)
The improved chirp wavelet in (2) does not please the condition of zero mean for an acceptable wavelet. Therefore, it is not strictly a CWT, Written out explicitly, the improved chirplet transform is
IC (b, f) = f2 + iq / √2π * ∫ h(t) e t2(f2 – iq) / 2 e (2πft + qt2) e ( ( )2 dt………....…. (3)
If the improved chirplet transform is indeed a representation of the local spectrum, one would anticipate a simple operation of averaging the local spectra over time to give the Fourier spectrum. It is shown as follows
∫ IC(b, f)db = H(f) ………...…….(4)
It follows that h(t) is accurately recoverable from IC (b, f) Thus
h (t)= ∫ {∫ IC(b, f)db}e df………...…(5)
B. HOUGH TRANSFORM
The Hough transform is a feature eradication technique used in image analysis and computer vision. The aim of this transform is to find immature instances of objects within a certain class of shapes by a voting procedure. The Hough transform has significant features like robustness to impulsive noise and detachments of partial occlusion of patterns are suitable to use in non-image applications, e.g. parameter estimation. The Hough transform based on normal parameterization of a line
H(r,θ) = ∫ ∫ f(x, y)δ(r-xcosθ – y sinθ) dx dy……….…..(6)
Where f (x, y) = binary image, d = Dirac delta function.
The Continuous Kernel Hough transform (CKHT) is a new modification of HT and improves its several features. Definition of Hough transform of a line with the continuous kernel
HT(r, θ ) = ∑ ∑ f(xi, yj ) ( cosi, y sin ) T
Tx j r2 ……….………… (7)
HT (r,θ ) is corresponding parameter space and T is a constant determining a sensitivity of CKHT.
C. WAVELET TRANSFORM
Wavelet transform is one of the most popular of the time-frequency-transformations. As with other wavelet transforms, a key advantage it has over Fourier transforms is temporal resolution and the wavelets are discretely sampled. It captures both frequency and location information.
A continuous wavelet transform (CWT) is used to divide a continuous-time function into wavelets. The continuous wavelet transform of a function x(t) at a scale (a>0) a ∈R +*and translational value b ∈R is expressed by the following integral
X
(a, b) =1 / 2
1
a ∫∞ x(t)
∞ t b a
dt……….……..…...….… (8)
Where
( )
t
mother wavelet .The main purpose of the mother wavelet is is to provide a source function to produce the daughter wavelets which are simply the translated and scaled versions of the mother wavelet. Let L2(R) denotes the space of all square integral functions on R. In signal processing parlance, it is the space of functions with finite energy. Let ψ (t) ∈ L2(R) be a preset function. The function ψ(t) is said to be a wavelet if and only if its FT ψ (ω) satisfiesCψ = ∫
2
< ∞………...….….…….. (9) The relation is called the admissibility condition, which implies that the wavelet must have a zero average ∫∞ (t)dt = (0)=0 ………...……….……(10)
And therefore it must be oscillatory. In other words, ψ must be a sort of wave. Let us now define the dilated–translated wavelets ψ a, b as the following functions
, 1 ( ) a b t b t a a
ISSN(Online): 2320-9801
ISSN (Print): 2320-9798
I
nternational
J
ournal of
I
nnovative
R
esearch in
C
omputer
and
C
ommunication
E
ngineering
(An ISO 3297: 2007 Certified Organization)
Vol. 4, Issue 9, September 2016
Where b∈R is a translation criterion, whereas a R+ (a ≠ 0) is a dilation or scale parameter.
D. Walsh Transform
The Walsh functions may be viewed as a discrete, digital counterpart of continuous, analog system of trigonometric functions on the unit interval. The functions take the values −1 and +1 only, on sub-intervals defined by dyadic fractions. We define the sequence of Walsh functions, Wk: [0, 1] →{−1,1},k ∈ N0 Wk: [0, 1] as follows. For any k ∈ N0, X ∈ [0, 1] let
k = 0kj
j
2j, kj ∈ {0,1} x = 1xj
j
2-j, xj ∈ {0,1}………..…………..(12)
Such that there are only finitely many non-zero kj and no trailing xj all the same to 1, be the canonical binary representations of integer k and real number x, in the same way. Then, the definition
Wk(x) = (-1)
1
0k xjj
j
……….……….…..… (13)
W2m is precisely the Rademacher function rm. Thus, the Rademacher method is a subsystem of the Walsh system. Moreover, each Walsh function is a product of Rademacher functions:
Wk(x) = 0
j r j
(x)kj………..……….. (14)
E. CURVLET TRANSFORM
Curvelet transform is a new multiscale transform which was designed to represent edges and other singularities onward curves much more efficiently than traditional transforms Curvelet is a higher dimensional generalization of the wavelet transform intended to represent images at different scales and different angles. Therefore, Curvelets will be superior over wavelets in following cases: 1. Optimal sparse representation in object with edges 2.Optimal image reconstruction of severely ill-posed problems 3.Optimal sparse representation in wave propagators
The discrete curvelet transform useful to represent an image with intensity values given by the function f (y1, y2), x1 = 0, 1,..., M1 - 1, x2 = 0, 1,..., M2 - 1, whose discrete Fourier transform (DFT) is
fˆ (m1, m2) = ∑ ∑ f( y1, y2) e (m1y1/ M1+m2y2 / M2)………...……(15)
The discrete curvelet transform is now a disintegrate into the curvelet coefficients such that
f(m1,m2) = 1
j j
1 0 j L l
1 1 , 1 0 jl K k
2 2 , 1 0 jl K k
cjlk sjlk (y1,y2) ……….….(16)
Where k= (k1, k2), s is the curvelet on level j with orientation l and spatial shift k.
jlk |cjlk|2 = y
1,y2 + |f(y1, y2)|2 ………....….(17)The discrete curvelet transform provides a disintegration of the image f into J detail levels, with Lj orientation on each level, and Kjl,1 × Kjl,2 spatial shifts for each Where k = (k1, k2) and s is the curvelet on level j with orientation l and spatial shift k. additionally, the curvelet transform preserves l2-norms, i.e.
jlk |cjlk|2 = y
1,y2 + |f(y1, y2)|2 ……….(18)
ISSN(Online): 2320-9801
ISSN (Print): 2320-9798
I
nternational
J
ournal of
I
nnovative
R
esearch in
C
omputer
and
C
ommunication
E
ngineering
(An ISO 3297: 2007 Certified Organization)
Vol. 4, Issue 9, September 2016
Copyright to IJIRCCE DOI: 10.15680/IJIRCCE.2016. 0409014 15792
III.REALIZATION OF TRANSFORMS
A. Hough-based Signal detection
ISSN(Online): 2320-9801
ISSN (Print): 2320-9798
I
nternational
J
ournal of
I
nnovative
R
esearch in
C
omputer
and
C
ommunication
E
ngineering
(An ISO 3297: 2007 Certified Organization)
Vol. 4, Issue 9, September 2016
B. CHIRPLET-BASED SIGNAL DETECTION
The Reassigned Local Polynomial Periodogram forth the Frequency direction (RfLPP) is shown to be able to perfectly localize the chirp signal. Due to this property, the RfLPP is collective with the Hough transform for chirp signal detection in the parameter domain. The performance of the RfLPP-Hough transform is tested for chirp signal detection in white Gaussian noise and impulsive noise, with comparisons to the PWHT, LHT, and RLPPHough transform. The comparisons verify the benefit of the RfLPP-Hough transform for chirp signal detection.
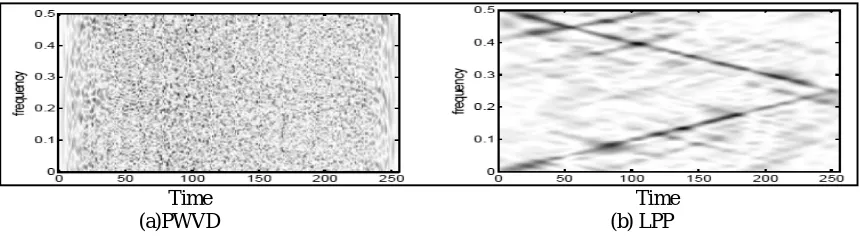
The mono-component chirp signal is of 256 point length, the initial normalized frequency is 0, and final normalized frequency is 0.45. The multi-component chirp signal is of 256 point length, for one component, the initial normalized frequency is 0 and the final normalized frequency is 0.25; for the other component, the initial normalized frequency is 0.5 and the final normalized frequency is 0.25. In order to provide an illustrative result, the multi-component signals are assumed to be depraved by higher SNR noise level than the mono-component signals, that is SNR=10 for mono-component signal and SNR=5dB for the multi-component signal. For a mono-component chirp signal in the white Gaussian noise with the SNR = 10dB. It can be look that for the chirp signal under the heavy noise, the PWVD cannot give a correct representation, and the RLPP cannot provide the proper concentration due to the noise effect.
(a)PWHT (b) LHT
(a)RLPP- Hough transforms (b)RfLPP-Hough Transform
Figure 2: The PWHT, LHT, RLPP-Hough transform, and RfLPP-Hough transform for mono-component chirp signal in white Gaussian noise with SNR=10dB.
Hough transform for correctly detecting the chirp component, where ρ and θ are the distance and angle of the normal vector to the line from the origin, respectively. Moreover the RfLPP-Hough transform can provide more concentrated peak in the parameter space, which makes it much easier for chirp detection and estimation. Similar conclusion can be obtained for multiple component chirp signals, as shown in Figs. 3 and 4.
Time Time (a)PWVD (b) LPP
ISSN(Online): 2320-9801
ISSN (Print): 2320-9798
I
nternational
J
ournal of
I
nnovative
R
esearch in
C
omputer
and
C
ommunication
E
ngineering
(An ISO 3297: 2007 Certified Organization)
Vol. 4, Issue 9, September 2016
Copyright to IJIRCCE DOI: 10.15680/IJIRCCE.2016. 0409014 15794
Figure5: Probability of detection performance comparisons under probability of false alarm 1%.
For better evaluating the performances of the above methods, we provide quantitative analysis of the results for mono-component chirp detection in white Gaussian noise with different SNRs. We define a grid containing 2 point by 2 point as the expected location of the peak. Detection is successful when the peak that is above the threshold is within this grid. With the probability of false alarm as 1%, the relationships between the probability of detection to the SNR are provided with the averages of 100 simulations, and also compared with the theoretical curve, as shown in Fig. 5. It shows that the RLPP-Hough transform is more sensitive to the noise and cannot detect the chirp signal with high probability of detection even in high SNR=5dB, this occurs because the RLPP cannot correctly localize the chirp signal due to the noise, and the peak in the parameter domain may off the defined grid. For signal with a low SNR, such as SNR=10dB, the probability of detection using the RfLPP-Hough transform or the LHT is much higher than that of the PWHT. The discloser performance of the RfLPP-Hough transform is comparable to that of the LHT. However, using the RfLPP-Hough transform for chirp detection, the computational complexity is reduced.
C. WALSH -BASED SIGNAL DETECTION
Spectrum sensing is a technology to improve spectrum efficiency. A novel signal detection method based on Walsh transform is used for spectrum sensing. The main idea behind is that the received signal is transformed into another domain by Walsh transform and the verify statistic is achieved by exploiting the feature of the useful signal in the new domain. The novel method can perform well at low signal-to-noise rate (SNR). The performance of the wash-based signal detector is compared with the spectral feature detector through simulation. The baseband signal used in the simulation is BPSK signal with rectangle envelope. The symbol rate is 2MB and the sample frequency is 32MHz. A couple of numerical experiments are passed out and a block of received data with 10240 samples is generated to calculate a decision result for every experiment. Figure 3: shows the variation of probability of detection with probability of false alarm for BPSK when SNR is -18dB.Figure 4: The following graphical representation illustrates the effect of SNR on the probability of detection for BPSK when the probability of false alarm is 0.01.
D. WAVELET -BASED SIGNAL DETECTION
ISSN(Online): 2320-9801
ISSN (Print): 2320-9798
I
nternational
J
ournal of
I
nnovative
R
esearch in
C
omputer
and
C
ommunication
E
ngineering
(An ISO 3297: 2007 Certified Organization)
Vol. 4, Issue 9, September 2016
bases, we have constructed an experimental signal, shown in Fig.1.We can see clearly five alteration points among 0:800: two between 200:30, one between 300:400, one between 400:500 and one between 500: 600. Further using the wavelet of db2, db3, db4, db5 decompose the unique signal into 4 layer, we can get four layers information signal and the fourth floor estimated signal, as shown in Fig.2, and Fig.5.
E. CURVELET-BASED SIGNAL DETECTION
Signal detection based on Curve let transform (SDCT) approach for spectrum sensing is presented, which accomplishes the feature of the signal after applying Curvelet transformation. In order to make the revelation process fast and to resolve an optimal feature set Principal Component of Analysis (PCA) is used. The hypothetical false-alarm probability has been derived, that is helpful us to analytically and accurately calculation of the SDCT approach in practical spectrum sensing. There are many approaches for threshold selection however; statistical procedures are dependent of the noise deviation, SNR and the recording interval. The Simulation results shows that, proposed method significantly enhance the performance in terms of efficiency and accuracy as well as detect weak signals at very low signal-to-noise rate (SNR) and then animatedly adjust the radio operating parameters accordingly.
IV.RESULTS AND DISCUSSIONS
ISSN(Online): 2320-9801
ISSN (Print): 2320-9798
I
nternational
J
ournal of
I
nnovative
R
esearch in
C
omputer
and
C
ommunication
E
ngineering
(An ISO 3297: 2007 Certified Organization)
Vol. 4, Issue 9, September 2016
Copyright to IJIRCCE DOI: 10.15680/IJIRCCE.2016. 0409014 15796
S.No Application Method Efficiency Result 1 Signal Detection Wavelet Transform Moderate 85% 2 Signal Detection Hough Transform High 92% 3 Signal Detection Walsh Transform High 93% 4 Signal Detection Chirplet Transform High 92%
5 Signal Detection Curvelet Transform Very High 96% Table 1: Comparison of Different transforms techniques for signal detection
V. CONCLUSION
In signal processing, detection of an unknown signal in noisy data is crucial task. The extraction of features becomes difficult and high frequency spectrum overlap with the frequency of fault if the noise is present in the received signal. This paper presents a comparative study based on transform techniques for signal detection. Realization of transforms and corresponding accurate results are presented to the desired signal. Statistical analysis shows that, Curvelet transform is a better than reaming transforms for detecting the noisy data. The motive behind is ability of sparse representation that are critical for detection and estimation of signal which are noisy and weak signals.
VI.ACKNOWLEDGEMENT
We would like to thank our Research Guide Dr. Uppu Ravi Babu, Professor in computer science & engineering, for his valuable suggestions and support throughout the arrangement of this paper. We would also like to thank the Department of CSE, Acharya Nagarjuna University, for providing us with the facility for carrying out the simulations.
REFERENCES
1. Guoxiang Yang, Guangliang Ren, Kun Wu “ Signal Detection Based on Walsh Transform for Spectrum Sensing” Scintific Research
Communications and Network, 2013.
2. L. Cirillo, A. Zoubir, and M. Amin, “Parameter estimation for locally linear FM signals using a time-frequency Hough transform,” IEEE
Transactions on Signal Processing, Vol. 56, 2008, pp. 4162-4175.
3. XIUMEI LI AND GUOQING YANG “RfLPP-Hough Transform for Chirp Signal Detection” journal of information science and engineering
31, 2125-2135 (2015).
4. Chen Zaiyu, Liu Zengli, Liu Yang and Tang Hui “The Selection Of Wavelet Function In Singular Signal Detection” 2nd International
Conference on Computer Science and Electronics Engineering (ICCSEE 2013).
5. Kameliya I. Kaneva, Zhigang Li “ Multiple LFM Signals Detection Method Based on Pseudo-Wigner-Ville Distribution and Binary
Integration of Hough Transform” International multiConference of Engineers and Computer Scientists 2014 Vol II, IMECS 2014, March 12 - 14, 2014, Hong Kong.
6. Subhani shaik, Uppu Ravibabu, Shaik Subhani “Curvelet based Signal Detection for Spectrum Sensing using Principal Component of
Analysis” proceedings of IEEE International Conference on Engineering and Technology, March 2016.
7. Subhani shaik, Uppu Ravibabu, Shaik Subhani “Detection and Classification of Power Quality Disturbances using support vector machine
”proceedings of IEEE International Conference on Information communication and Embedded systems, February 2016.
8. Turky Alotaiby, Fathi E Abd El-Samie, Saleh A Alshebeili and Ishtiaq Ahmad “A review of channel selection algorithms for EEG signal
processing” EURASIP Journal on Advances in Signal Processing2015.
BIOGRAPHY
Subhani Shaik is a Research Scholor in the Dept.of CSE, Acharya Nagarjuna University, Guntur, Andhra Pradesh, India. He received Bachelor of Technology (B.Tech) degree from Andhra University, in 2002. M.Tech from Jawaharlal Nehru Technological University Hyderabad (JNTUH) in 2011. His research interests are Computer Networks (wireless Networks), Image Processing, Cloud Computing, Data Mining. He puplished many papers in National and International conferences and journals.
ISSN(Online): 2320-9801
ISSN (Print): 2320-9798
I
nternational
J
ournal of
I
nnovative
R
esearch in
C
omputer
and
C
ommunication
E
ngineering
(An ISO 3297: 2007 Certified Organization)
Vol. 4, Issue 9, September 2016
Dr. U. Ravibabu received Doctorate from Acharya Nagarjuna University, Guntur, Andhra Pradesh, India. His research areas include Digital Image Processing, Data Mining, Computer Network and Design and analysis of algorithm.
E.Ravindra Reddy received M.Tech in computer Science and Engineering from JNTUK in 2012. His research areas include Data Mining, Computer Network and Digital Image Processing.
Shaik Subhani received M.Tech in computer Science and Engineering from Acharya Nagarjuna University in 2013, Guntur, Andhra Pradesh, India. His research areas include Digital Image Processing, Data Mining, Computer Network and Design and analysis of algorithm.