University of Windsor University of Windsor
Scholarship at UWindsor
Scholarship at UWindsor
Electronic Theses and Dissertations Theses, Dissertations, and Major Papers
1-1-1970
The post-discrimination gradient as a function of discrimination
The post-discrimination gradient as a function of discrimination
training on a line-tilt continuum.
training on a line-tilt continuum.
Laurence B. Gray
University of Windsor
Follow this and additional works at: https://scholar.uwindsor.ca/etd
Recommended Citation Recommended Citation
Gray, Laurence B., "The post-discrimination gradient as a function of discrimination training on a line-tilt continuum." (1970). Electronic Theses and Dissertations. 6853.
https://scholar.uwindsor.ca/etd/6853
This online database contains the full-text of PhD dissertations and Masters’ theses of University of Windsor students from 1954 forward. These documents are made available for personal study and research purposes only, in accordance with the Canadian Copyright Act and the Creative Commons license—CC BY-NC-ND (Attribution, Non-Commercial, No Derivative Works). Under this license, works must always be attributed to the copyright holder (original author), cannot be used for any commercial purposes, and may not be altered. Any other use would require the permission of the copyright holder. Students may inquire about withdrawing their dissertation and/or thesis from this database. For additional inquiries, please contact the repository administrator via email
THE POST-DISCRIMINATION GRADIENT AS A
FUNCTION OF DISCRIMINATION TRAINING ON
A LINE-TILT CONTINUUM
by
LAURENCE B. GRAY
B.A., University of Windsor, 1969
A Thesis
Submitted to the Faculty of Graduate Studies through the Department of Psychology in Partial Fulfillment
of the Requirements for the Degree of Master of Arts at
University of Windsor
UMI Number: EC52799
INFORMATION TO USERS
The quality of this reproduction is dependent upon the quality of the copy
submitted. Broken or indistinct print, colored or poor quality illustrations and
photographs, print bleed-through, substandard margins, and improper
alignment can adversely affect reproduction.
In the unlikely event that the author did not send a complete manuscript
and there are missing pages, these will be noted. Also, if unauthorized
copyright material had to be removed, a note will indicate the deletion.
®
UMI
UMI Microform EC52799
Copyright 2008 by ProQuest LLC.
All rights reserved. This microform edition is protected against
unauthorized copying under Title 17, United States Code.
ProQuest LLC 789 E. Eisenhower Parkway
PO Box 1346 Ann Arbor, Ml 48106-1346
ABSTRACT
Following preliminary and S+ only training, three groups of
pigeons were trained to discriminate between line-tilts of 0°
vertical (S+) and 30°, 45°, or 60° to the right of vertical respectively.
A control group, following a post«S+ only training generalization
test, was trained to discriminate between S+ and a lighted key with no
line. All Ss were then extinguished to 12 line orientations. While
behavioral contrast was observed, no experimental S showed a peak shift
in the post-discrimination generalization gradient. These results
were interpreted as providing some evidence to render questionable
the validity of generalizing from peak shift results obtained using the
dimension of wavelength to the dimension of angularity since the
results Suggest that the peak shift is not always obtained using line
tilt as the stimulus dimension.
PREFACE
The author wishes to express his gratitude and appreciation
to Dr, Theodore Hirota under whose direction the present research was
conducted. His willingness to give of his time and knowledge made
the carrying out of the research much less burdensome than it might
have been. Grateful appreciation is also extended to Drs. Arthur
Smith and Theodore Horvath for their help and constructive criticism
which they made available to the author throughout the course of the
experiment.
TABLE OF CONTENTS
Page
PREFACE . . . ... iii
LIST OF TABLES . ... v
LIST OF FIGURES . ... vi
Chapter I INTRODUCTION . . . ... 1
Background of Related Research ... . 1
Purpose of Present Research . . . 8
II METHOD ... 10
Subjects . . . 10
Apparatus . . . ... . . . . 10
Procedure . . . 11
III RESULTS . . . ... . . . 13
S+ Only Training ... 13
Discrimination Training . . 13
Generalization Test ... 13
IV DISCUSSION ... 32
V S U M M A R Y ... 36
APPENDIX A Order of Presentation of S+ and S-During Discrimination Training . . . 38
APPENDIX B Order of Presentation of Stimuli During Generalization Test . . . 39
APPENDIX C Responses During S+ Only Training . . . 40
APPENDIX D Responses During Discrimination Training . . . . 41
APPENDIX E Responses During Generalization Test . . . 43
REFERENCES ... . . . . 48
VITA AUCTORIS ... 51
iv
LIST OF TABLES
Table Page
1 Analysis of Variance of the Means of the
Generalization Gradients by Treatment
Groups . . . 15
2 Newman-Keuls Comparisons of Means of the
Generalization Gradients . . . 16
3 Analysis of Variance of the Means of
Total Responses During Generalization
by Treatment Groups ... 18
4 Analysis of Variance of Means of Total
Responses to the Modal Stimulus of the Generalization Gradient by Treatment
Groups . . . ... 19
LIST OF FIGURES
Figure Page
la, b, c, d Mean Response Rates During S+
Only Training . . . 20
2a, b, c, d Mean Response Rates as a Function
Discrimination Training . . . 24
3a, b, c, d Mean Post-Discrimination Gradients . . . 28
vi
CHAPTER I
INTRODUCTION
The purpose of the present study was to replicate Hanson's
(1959) peak shift (PS) results using line-tilt as the stimulus
dimension. The PS has been defined by Bloomfield (1967) as a:
displacement of the maximum point of the generalization gradient from the reinforcement correlated stimulus (S+) in a direction away from the negative, extinction
correlated stimulus (S-) after discrimination training.
The significance of such a study is perhaps more suitably discussed
in the light of some general background information concerning the
phenomenon of the PS and some of the relevant variables.
Background of Related Research
In a study of the effects of discrimination training on the
stimulus generalization gradient, Hanson (1959) demonstrated that under
certain conditions the peak of the post-discrimination gradient (PDG)
shifts away from the conditioned stimulus. He also demonstrated that
the slope of the PDG correlated with S- would be steeper than that
correlated with S+, resulting in an area shift in the PDG away from
S+ in a direction away from S-.
U s i n g pigeons, H a n s o n t r a i n e d fou r g r o u p s of Ss to d i s c r i m i n a t e
between 550 mji (S+) and 555, 560, 570, or 590 mp (S-). He then tested
for generalization to 13 stimuli, including the training S+ and S-
(except for the 555 mp group). Using Spence's (1937) model, Hanson
made six specific predictions with regard to the PDG:
a) The post-discrimination gradient will be steeper than the
generalization gradient in the region of S-.
b) If a complete discrimination is developed the value of the
post-discrimination gradient will be zero at S-.
c) The mode of the post-discrimination gradient will be
displaced away from S- in relation to the mode of the
generalization gradient.
d) The magnitude of this displacement will increase as the
S+, S- difference is reduced.
e) The maximum heights of the post-discrimination gradients
will be reduced as the S+, S- difference is reduced.
The first three predictions were clearly supported by the results
(although the second prediction appears to be a tautology since a
complete discrimination implies, by definition, no responding). All
but three of the 24 experimental_Ss showed a PS in the PDG. Hanson
claimed that the fourth prediction, that the magnitude of the modal
displacement increases as the S+, S- difference decreases, was also
supported. However, an examination of the mean generalization
gradients for the discrimination groups reveals that the mode of each
gradient was at the 540 mji stimulus. Thus, the amount of modal
d i s p l a c e m e n t in t h e P D G s w i t h r e s p e c t to the m o d e o£ th e control
gradient was the same for all groups. The last two predictions were
not confirmed by the results.
Other experimenters have demonstrated this PS effect: Honig,
Thomas & Guttman (1959); Honig (1962); Terrace (1964, 1966);
Friedman and Guttman (1965); Yarczower, Dickson & Gollub (1966);
Stevenson (1966); and Thomas and Burr (1969). All the above studies
used wavelength generalization in pigeons to demonstrate the PS
effect. Citing the failure of Jenkins and Harrison (I960) to demonstrate
the PS using an auditory continuum, Guttman (1965) suggested that
the PS may be specific to wavelength. However, using tones as
discriminative stimuli, Pierrel and Sherman (1960) obtained a PS in
rats. Bloomfield (1967) and Thomas and Lyons (1968) have also
obtained a PS on a line-tilt continuum with pigeons.
Several variables are known to be related to the occurrence of
the PS. The first is the kind of discrimination training that is
given. Orthogonal discrimination training (the discriminative stimuli
are not on the same physical continuum) results in a symmetrical
gradient with the peak at S+ (Guttman and Kalish, 1956). Non-orthogonal
discrimination training (the discriminative stimuli are both on the
same physical continuum) results in a PS (cf: Hanson, 1959). The
discrimination is established by differential reinforcement of the
stimuli.
A second important variable is the amount of responding to S-
during discrimination training. Terrace (1964) devised a procedure
that minimizes the amount of responding to S- which he called
"errorless learning". The low S- response rate was achieved by
introducing S- for very short presentations (2 sec) after preliminary
training on S+. The duration of S- presentations was then gradually
increased but Ss made few, if any, responses to S-, Learning with
gradually decreasing response rate. Terrace found that when the
discrimination was acquired without errors there was no PS in the PDG.
In a subsequent study, Terrace (1966) found that as the amount of
discrimination training increased, the PS was eliminated. After 30
sessions of discrimination training (approximately 1500 min) all 4
Ss showed the PS. After 45 discrimination sessions only two of the 4
Ss showed the phenomenon. Only one of 4 Ss showed a PS after 60
training sessions.
Characteristics of the PDG are also related to the method of
stimulus presentation during training. Honig (1962) has shown that if
the discriminative stimuli are presented simultaneously there is no
PS. Successive presentation of S+ and S- seems to be critical.
Yarczower et al. (1966), by manipulating schedules of reinforce
ment to elicit comparable response rates to both discriminative stimul
while maintaining differential reinforcement, have shown that such
comparable rates of responding eliminate the PS. Yarczower, Gollub
& Dickson (1968) equated frequency of reinforcement in the two com
ponents of a MULT schedule which yielded different response rates.
The PS was observed. These studies indicate that the frequency of
reinforcement is not a factor in obtaining a PS provided there is a
difference in response rates to S+ and S-.
T h e p r e s e n t study w a s c o n c e i v e d as a r e s u l t o£ f a i l u r e to o b t a i n
a PS in three different studies. The first, by Hirota, Kitson & Gray
(1969), involved two experiments, both using line-tilt and colour. In
the first experiment, Shift - No-shift, pigeons were trained to
discriminate between a red line tilted 15° left of vertical and
superimposed on a red tinted background CS+) and a similar line
tilted 15° right of vertical (S-) for the shift condition. For the
no-shift condition, the discrimination was orthogonal: a green line
tilted 15° left of vertical on a green tinted background (S+) and an
unlit key (S-). Subjects were tested for generalization to nine
line orientations (including the training stimuli) with colour
alternating evenly and the line orientations varying randomly. The
second experiment involved a Shift Left - Shift Right situation. For
the shift left condition, S+ and S- were the same as in the shift
condition of the first experiment. For the shift right condition, S+
was a green line tilted 15° right of vertical on a green tinted back-o
ground, and S~ was a similar line tilted 15 left of vertical. In
both experiments the appropriate discriminations were readily acquired
but the FDGs showed no PS. The authors suggested that the failure to
obtain the PS might have been due to the within subject design of the
generalization test.
This suggestion led to a second attempt to obtain the PS. Gray
(1970) essentially replicated the Shift - No-shift experiment of
Hirota et al. (1969) except that Ss were tested for generalization under
either the shift or the no-shift condition, but not both together.
Again, the appropriate discriminations were easily and rapidly acquired
but no PS materialized in the PDG of the shift condition.
A third study, Clarkson (1970), attempted to examine the effects
of amount of discrimination training on the development of the PS.
Using a line-tilt continuum, pigeons were trained to discriminate
between a vertical black line on a white light background (S+) and a
post-criterion discrimination training sessions, control Ss were extinguished
to 12 line orientations. For the experimental group, generalization
tests were interspersed through discrimination training. Subjects
were tested for generalization on the day following attainment of the
criterion. A second generalization test was given after six post
criterion training sessions, and a third test after 12 post
criterion training sessions. Again, neither group showed a PS.
In the above three studies, a VI 30 sec schedule of reinforcement
was used. In the studies cited as references by these experimenters,
a VI 1 min schedule was generally used. However, the literature does
not indicate that this difference was responsible for the absence of the
PS, Hearst, Koresko & Poppen (1964) have shown that VI 30 sec and VI
1 min schedules lead to comparable gradients of stimulus generalization.
In terms of the PS, Yarczower et al. (1966) obtained a PS using a
VI 30 sec schedule. Their PDG is quite comparable to that obtained
with a VI 1 min schedule (cf: Thomas and Burr, 1969). This suggests
that the use of the VI 30 sec schedule as opposed to the VI 1 min does
not account for the absence of the PS in the three studies under
consideration.
A review of the literature cited in these three studies revealed
that in all the PS studies, Ss had been given some single stimulus
t r a i n i n g to S + (S+ o nly t r aining) b e f o r e a c q u i r i n g the appropriate
discrimination. S+ only training in all but Bloomfield's (1967)
study entailed presentations of the stimulus that was to be used as S+
in subsequent discrimination training for a certain duration (generally
1 min) separated by time outs which generally lasted two to five
seconds, Bloomfield (1967) did not have the time out periods. In all
cases reinforcement was administered on a VI schedule. In discussing
his results, Clarkson (1970) adverted to this presence of S+ only
training and suggested that such training was a critical factor in
obtaining the PS, He concluded that the ratio of exposure to S-
to exposure to S+ must be less than unity. For example, Bloomfield
(1967) gave his Ss 14 daily one hour S+ only training sessions followed
by 14 daily one hour sessions of discrimination training on a MULT VI
1 min EXT schedule (with S+ and S- each present for 30 min per session).
The resulting S«:S+ ratio (in terms of minutes) would be 420:1260.
Clarkson gave his _Ss no S+ only training prior to discrimination
training. Since there was equal exposure to S+ and S- during
discrimination training, the ratio in this case was unity.
The literature also indicates that most PS studies have used
wavelength as the stimulus dimension. A few studies have demonstrated
the PS using other dimensions (Bloomfield, 1967, and Thomas and Lyons,
1968, used line-tilt; Pierrel and Sherman, 1960, used an auditory
dimension). The paucity of PS studies using dimensions other than
wavelength suggests the following question: is the PS reliably
obtained using another stimulus dimension? The literature does not
generally report negative results. It is, therefore, difficult to
determine how often experimenters have failed to obtain a PS. The
po i n t is a n i m p o r t a n t one. T o g e n e r a l i z e v a l i d l y f r o m the r e s u l t s
obtained using one stimulus dimension to situations involving another
dimension requires that the results be reliably obtainable in the second
situation. Thus, if Bloomfield's (1967) results, for example,
represent only one successful outcome against a background of several
that the PS is reliably obtained using a line-tilt dimension.
Because the PS was not obtained in the three studies cited
above, it seemed appropriate to attempt to replicate Hanson's (1959)
results using line-tilt as the stimulus dimension. Successful
replication would indicate two things. Further evidence of the
reliability of the phenomenon using the line-tilt dimension would be
obtained. Secondly, since the PS was not obtained in the Clarkson
(1970) study in the absence of S+ only training prior to discrimination
training, replication of Hanson's results would point to the importance
of such S+ only training in obtaining a PS, a fact not adverted to in
the literature.
Purpose of Present Research
The present study, therefore, was designed to replicate Hanson's
results using a line-tilt contimuum in order to determine whether
there is empirical evidence justifying generalizing from results of
PS studies using wavelength to the dimension of angularity. Three
experimental groups and a control condition were used. After preliminary
and S+ only training, the three experimental groups were given
o
discrimination training with 0 (vertical line) as S+ and a line tilted
30°, 45°, or 60° right of vertical as S-. These discrimination groups
are henceforth designated by the respective S- stimulus used. After
discrimination training, these groups were tested for post-discrimination
generalization to a variety of line orientations. A control group
was tested for generalization after S+ only training and again after
orthogonal discrimination training.
On the basis on Hanson's (1959) study, the following hypotheses
were tested.
I. The PDGs of experimental groups will be steeper than the
PDG of the control group in the region of S+.
11. The mode of the experimental PDGs will be displaced
away from S- in relation to the mode of the control
gradient.
III. The magnitude of this displacement will increase as the
S+, S- difference is reduced.
The independent variables were the presence or absence of non-
orthogonal discrimination training, and line orientation. The
CHAPTER II
METHOD
Subjects
Twenty commercially obtained and experimentally naive male white
Carneaux pigeons served as _Ss. Subjects were 6 - 1 2 months old at the
beginning of the experiment and were reduced by food deprivation to, and
then maintained throughout the experiment at, approximately 80% of
their free-feed body weight. There was ad lib access to water in_Ss'
home cages. Subjects were randomly assigned to four groups of five at
the beginning of training: 30°, 45°, 60°, and control groups.
Apparatus
Two standard Leheigh Valley 2-key pigeon chambers were used. The
left key in each chamger was covered. Stimuli were projected onto the
back of the right transparent response key by Grason-Stadler In-line
Digital display units. Black lines, 2.5 cm long and 3 mm wide on a
white light background, could be projected at 12 different orientations
ranging from horizontal through 180° in 15° steps. Reinforcement
consisted of a 4 sec access to a lighted food hopper containing a
g r a i n mixtu r e . D u r i n g r e i n f o r c e m e n t the s t i m u l u s k e y a n d h o u s e light
were out. The light in the food hopper was on only when reinforcement
was available. To mask extraneous sounds, white noise was provided in
the experimental chambers through speakers. A separate speaker mounted
on the wall in the room where the chambers were housed also provided
10
11
white noise. Experimental sessions were programmed from a separate
room by relays, timers, and: steppers. Responses and reinforcements
were recorded on counters and on cumulative recorders.
Procedure
Preliminary Training. This training comprised four daily
sessions. On Day 1, Ss were adapted to the experimental chambers.
(Each J received all training and testing in the same chamber.) The
house light was on but the response key was covered. Subjects
received no reinforcement. Each _S remained in the chamber for 30 min.
On Day 2, with the response key still covered, Ss were magazine
trained. This training was terminated after 60 reinforcements. On
Day 3, a vertical black line (S+) was projected on to the response key
and the key peck response was shaped using the method of successive
approximation. Shaping was terminated after 60 reinforcements. On
Day 4, 60 CRFs to S+ were given.
S+ Only Training. This training commenced on the day following
preliminary training. Each j3 received 14 daily sessions of S+ only
training on a VI 1 min schedule, each session lasting one hour,
including feeding time. S+ was continuously present except during
reinforcement.
Discrimination Training. Each S in the three experimental groups
received 14 daily sessions on a MULT VI 1 min EXT schedule with
randomly alternating 2 min periods on each component (with the
restriction that runs of either component never exceeded two). VI 1
min and EXT components were separated by a 4 sec black out. S+ was
black line tilted 30°, 45°, or 60° to the right of vertical (S-)
for the respective experimental groups. Each stimulus appeared an
equal number of times during each session (cf: Appendix A). Daily
sessions were terminated at the end of one hour (excluding feeding
time). Each S was run at approximately the same time each day. Control
Ss received orthogonal discrimination training in which S+ was the 0°
line and S» was a lighted key with no line*
Generalization Test. This test occurred on the day following the
14th session of discrimination training for experimental Ss and, for
control Ss, on the days following S+ only training and orthogonal
discrimination training. Subjects were extinguished to 12 line
orientations (including the training stimuli) which varied from 90°
left of vertical through 90° right of vertical in 15° steps. Stimuli
were presented for 30 sec periods, separated by a 4 sec black out.
Each line orientation was presented a total of eight times. The line
orientations were randomly presented with the restriction that no
stimulus could succeed itself (cf: Appendix B).
CHAPTER III
RESULTS
S+ Only Training
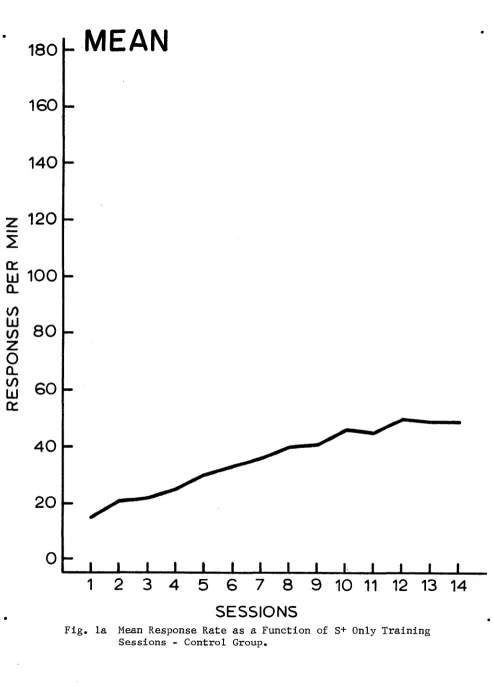
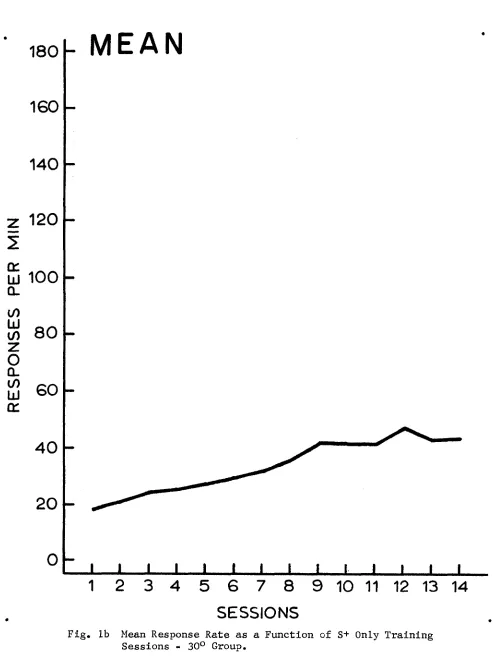
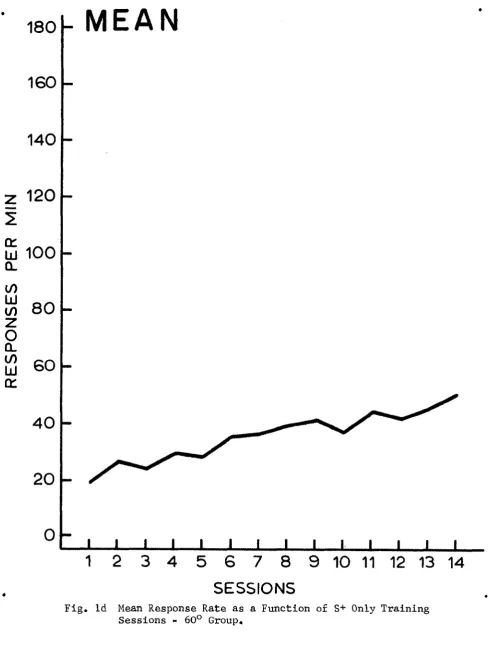
Figures la, lb, lc and Id show the mean response rates across
all sessions for the four groups, control, 30°, 45°, and 60°
respectively. (The performance of individual Ss in each group is
recorded in Appendix C.)
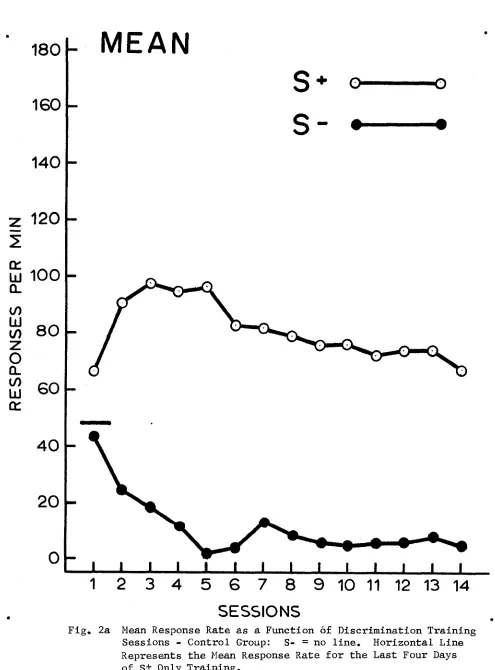
Discrimination Training
One S from the 60° group failed to acquire the discrimination
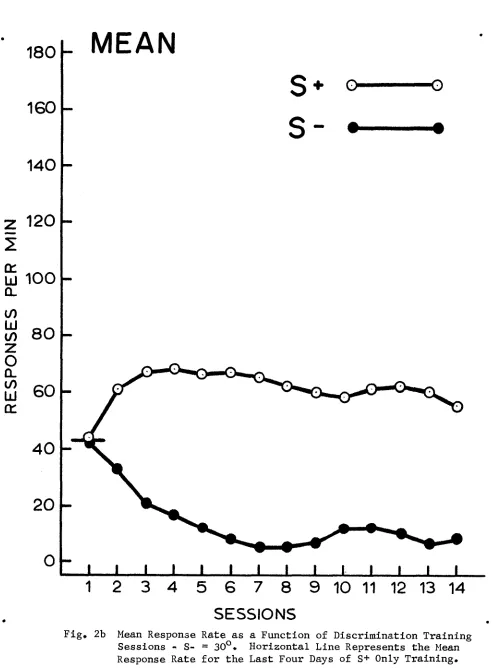
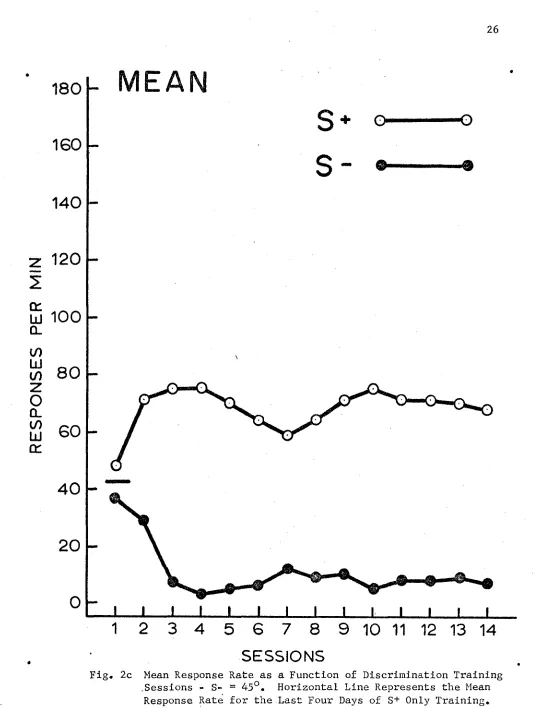
and was dropped from the experiment. Figures 2a, 2b, 2c, and 2d show
the mean response rates to S+ and S- for the control, 30°, 45°, and 60°
groups respectively. The results indicate that each group had acquired
the appropriate discrimination by Session 6 and that performance
was relatively stable throughout the remaining training sessions.
These figures also indicate that each group showed the phenomenon of
behavioral contrast (cf: Reynolds, 1961). Responses per session for
each S are recorded in Appendix D.
Generalization Test
The test for control Ss following S+ only training resulted in
flat gradient across all Ss. During S+ only training, S+ was on
continuously (except during reinforcement). Using this same procedure,
Blough (1959) and Thomas, Klipec & Lyons (1966) have obtained gradients
14
and Baron (1965) obtained gradients only when no stimulus or an orthogonal
stimulus occurred between S+ periods. They obtained flat gradients
when S+ had been on continuously. Thus, the evidence is somewhat
conflicting in this regard.
In view of the flat gradients obtained in this particular
case, control Ss were given 14 sessions of orthogonal discrimination
training and then retested for generalization.
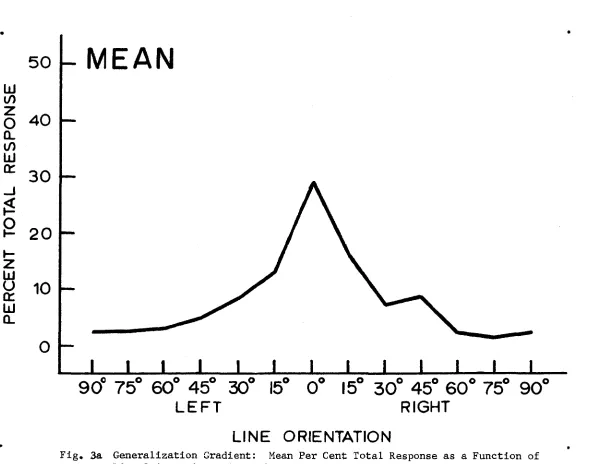
Mean relative PDGs were computed for each group by averaging the
percentage of total responses of all Ss in a group to each test
stimulus. These results are shown in Figures 3a, 3b, 3c, and 3d for
the control, 30°, 45°, and 60° groups respectively. For all groups
the mode of the PDG was at S+. (Responses to each test stimulus are
recorded for each S in Appendix E.) Thus, when compared to the control
gradient, none of the experimental groups showed a PS.
Individual PDGs were treated as,grouped frequency distributions
(cf: Thomas and Burr, 1969) and the mean of each frequency distribution
was computed. An analysis of variance was done to determine whether
there were any significant differences among the group means. Table 1
shows the results of this analysis. The Newman-Keuls comparisons
revealed that the 30° group differed significantly (p<^.05) from all
other groups as shown in Table 2.
Using the total number of responses by a S as an estimation of
the area under the generalization gradient (cf: Hanson, 1959), an
analysis of variance was done to test the hypothesis that the areas under
the curves did not differ significantly among groups. To achieve
Table 1
Analysis of Variance of the Means of the Generalization Gradients by
Treatment Groups
Source df SS MS F
Treatment 3 510.50 170.17 5.11 '''
Error 15 499.56 33.30
Total 18 1010.06
16
Table 2
Newman-Keuls Comparisons of Means of the Generalization Gradients
C as o o 45° Co o o
c --- 3.19 4.90 14.08*
60° --- 1.71 10.89*
45° 9.18*
30°
*p <.05
17
homogeneity of variance, the raw scores were subjected to a square-
root transformation. Table 3 presents the results of the analysis of
the transformed data. Table 3 shows that areas under the curves
were comparable.
Given equal areas under the respective mean generalization gradients,
in order to test for differences in height among the gradients, the
number of responses to the modal stimulus (0°) for each S was
subjected to a square-root transformation and an analysis of variance
was done. Table 4 shows that there were no significant differences
18
Table 3
Analysis of Variance of the Means of Total Responses During Generalization by Treatment Groups
Source df SS MS F
Treatment 3 165.965 55.322 0.47
Error 15 1753.026 116.868
Total 18 1918.991
F at 3 & 15 df = 3.29 .05
19
Table 4
Analysis of Variance of Means of Total Responses to the Modal Stimulus of the Generalization
Gradient by Treatment Groups
Source df SS MS F
Treatment 3 81.911 27.304 1.57
Error 15 260.123 17.342
Total 18 342.034
R
E
S
P
O
N
S
E
S
P
E
R
M
IN
2 0
l
MEAN
180
160
140
120
100
8 0
6 0
4 0
20
0
-1
2
3
4
5
6
7
8
9
10
11
12
13
14
SESSIONS
Fig. la Mean Response Rate as a Function of S+ Only Training Sessions - Control Group.
R
E
S
P
O
N
S
E
S
P
E
R
M
IN
2 1
M E A N
180
160
140
120
100
8 0
6 0
4 0
20
1
2
3
4
5
6
7
8
9
10
11
12
13
14
SESSIONS
R
E
S
P
O
N
S
E
S
P
E
R
M
IN
2 2
MEAN
180
160
140
120
100
8 0
6 0
4 0
20
1 2
3
4
7
8
9
SESSIONS
Fig, lc Mean Response Rate as a Function of S+ Only Training Sessions - 45° Group,
R
E
S
P
O
N
S
E
S
P
E
R
M
IN
23
M E A N
180
160
140
120
100
8 0
6 0
4 0
20
1
2
3
4
5
6
7
8
9
10
11
12
13
14
SESSIONS
R
E
S
P
O
N
S
E
S
P
E
R
M
IN
24
M E A N
180
160
140
120
100
8 0
6 0
4 0
20
0
1
2
3
4
5
6
7
8
9
10
11
12
13
14
SESSIONS
Fig. 2a Mean Response Rate as a Function of Discrimination Training Sessions - Control Group: S- = no line. Horizontal Line Represents the Mean Response Rate for the Last Four Days of S+ Only Training.
R
E
S
P
O
N
S
E
S
P
E
R
M
IN
2 5
MEAN
180
160
140
120
100
8 0
6 0
4 0
20
1
2
3
4
5
7
9
SESSIONS
R
E
S
P
O
N
S
E
S
P
E
R
M
IN
2 6
180
160
140
120
100
8 0
6 0
4 0
20
1
2
3
4
5
6
7
8
9
10
11
12
13
14
SESSIONS
Fig. 2c Mean Response Rate as a Function of Discrimination Training .Sessions - S- - 45°. Horizontal Line Represents the Mean
Response Rate for the Last Four Days of S+ Only Training.
R
E
S
P
O
N
S
E
S
P
E
R
M
IN
2 7
MEAN
180
160
140
120
100
80
60
4 0
20
1
2
3
4
5
6
7
8
9
10
11
12
13
14
SESSIONS
R e p ro d u ce d w ith p e rm is sio n of the co p yr ig h t o w n e r. F u rth e r re p ro d u ct io n p ro h ib ite d w ith o u t p e rm is s io n .
MEAN
5 0
LU if)O 4 0
Q_ I/)
UJ
^
3 0
-I
20
h-z
UJ
o CtUJ
Q_9 0
°
75
°
6 0
°
45
°
30
°
15
°
0
°
15
°
3 0
°
45
°
6 0
°
75
°
9 0
°
LE FT
RIGHT
LINE ORIENTATION
■
Fig. 3a Generalization Gradient: Mean Per Cent Total Response as a Function of
Line Orientation - Control Group. ro
R e p ro d u ce d w ith p e rm is sio n of the co p yr ig h t o w n e r. F u rth e r re p ro d u ct io n p ro h ib ite d w ith o u t p e rm is s io n .
MEAN
5 0
UJ
l/>O 4 0
CL
co
UJ
“
3 0
20
Kz
UJ
<J CLUJ
CL
O “
9 0
°
75
°
6 0
°
45
°
30
°
15
°
0
°
15
°
3 0
°
45
°
6 0
°
75
°
9 0
°
LE FT
RIGHT
LINE ORIENTATION
R e p ro d u ce d w ith p e rm is sio n of the co p yr ig h t o w n e r. F u rth e r re p ro d u ct io n p ro h ib ite d w ith o u t p e rm is s io n .
M E A N
5 0
UJ
i/)
O 4 0
Q_
10
UJ
*
3 0
20
t—z
UJ
u QCUJ
Q_9 0
°
75
°
6 0
°
4 5
°
30
°
15
°
0
°
15
°
3 0
°
45
°
6 0
°
75
°
9 0
°
L E F T
RIGHT
LINE ORIENTATION
Fig. 3c Generalization Gradient: Mean Per Cent Total Response as a Function of
R e p ro d u ce d w ith p e rm is sio n of the co p yr ig h t o w n e r. F u rth e r re p ro d u ct io n p ro h ib ite d w ith o u t p e rm is s io n .
M E A N
5 0
UJ
(/)
O 4 0
Q_ lO
UJ
“
3 0
20
h-z
UJ
ocr
UJ
o_9 0
°
75
°
6 0
°
45
°
30
°
15
°
0
°
15
°
3 0
°
4 5
°
6 0
°
75
°
9 0
°
LE FT
RIGHT
LINE ORIENTATION
CHAPTER IV
DISCUSSION
With one exception, the results failed to support the hypotheses.
The exception occurred with respect to the first hypothesis: that the
experimental gradients would be steeper in the region of S- than the
control gradient. This prediction was supported by the results obtained
for the group with the smallest S+, S- difference, the 30° group.
The complete absence of the PS phenomenon across all experimental
Ss is somewhat puzzling. This is especially true of the 45° group
which was a replication of Bloomfield's (1967) experimental group in
which all Ss showed a PS.
Terrace (1968) has gathered evidence showing that the PS and the
phenomenon of behavioral contrast (BC) covary with manipulation of the
same variables. BC is defined as a change in the rate of responding
on one component of a multiple schedule of reinforcement in a direction
opposite to the rate of responding on the other component. In a
successive discrimination situation, this implies that the rate of
responding to S+ increases over what it would have been had there
been no extinction component (cf: horizontal lines in Figures 2a,
2b, 2c, and 2d). In the present study, all experimental Ss showed BC
even though no PS was obtained. Thus, Terrace's (1968) contention that
"a peak shift results whenever contrast occurs during discrimination
training" was not supported by the results of the present study. It
would seem, therefore, that conditions sufficient to produce BC are
32
33
not sufficient to produce a PS. This would suggest that the two
phenomenon may not be as closely related as Terrace has argued. It
may, perhaps, be more accurate to say that BC is a necessary, but not
a sufficient condition for the occurrence of a PS.
A common finding in PS studies has been the fact that when
compared to control gradients, PDGs showing the PS are noticeably
elevated (cf: Hanson, 1959; Bloomfield, 1967). The results of the
present study revealed no differences in height among the gradients.
This result is in line with the absence of the PS in the experimental
gradients.
The fact that Thomas et al. (1966) have demonstrated mirror-image
transfer in pigeons does not appear to offer a valid explanation for
the absence of the PS in the present study. These experimenters
trained two groups of pigeons to respond on a VI 30 sec schedule to
a white line tilted 30° and 60° right of vertical respectively on a
black surround. A third group was given VI 1 min EXT training on an
orthogonal discrimination task (S+ = white line tilted 30° left of
vertical on a black surround; S- = a blank key). Generalization
gradients were bimodal for all groups, each group showing a peak at
the training S+ and a peak at the mirror-image of S+. In terms of the
present study, it might be argued that inhibition built up to the
various S- line orientations transferred to the appropriate mirrdr-
images, and then generalized to surrounding stimuli, thus preventing
the occurrence of a PS. If such an assumption were valid, control Ss
should show significantly more responding to the mirror-images of the
34
inhibition to the mirror images would be virtually non-existent for
control Ss. However, the appropriate t»tests for differences of means
failed to reveal any significant differences. Moreover, such an
explanation would also have to apply to the Bloomfield (1967)
results which showed the PS. Thus, if some sort of transfer due
to mirror-image effects did occur, it was not sufficient to eliminate
the PS in Bloomfield's Ss.
One possible explanation for the absence of the PS in the present
study is that the PS cannot be reliably obtained in pigeons when the
dimension is line-tilt. The present author found two studies which
showed a PS using line-tilt (Bloomfield, 1967; and Thomas and Lyons,
1968). On the other hand, apart from the present study, the author is
aware of four experiments which failed to show the phenomenon on the
line-tilt dimension (the two experiments in Hirota et al., 1969;
Clarkson, 1970; and Gray, 1970). With the exception noted above, the
present study, using the dimension of angularity, failed to replicate
Hanson's wavelength results. Such a failure to replicate would seem to
lend some support to Guftman's (1965) caution as to the kind of
dimensions on which a PS can be obtained, and to his suggestion that
the PS may be stimulus specific. The present results may render
questionable the validity of generalizing from the results of wavelength
studies to t h e d i m e n s i o n o£ angularity.
In discussing the absence of the PS in his study, Clarkson (1970)
suggested that the pre-test ratio of S-:S+ exposure had to be less
than unity for the occurrence of a PS. The present study provided Ss
with 14 sessions of pre-discrimination training exposure to S+,
thus weighting the exposure to the discriminative stimuli in favour of
S+. However, the results of the first generalization test of control
Ss indicate that under the conditions of the present study Ss'
behavior was not under the control of the line-tilt dimension. This
suggests that Ss were not "paying attention" to S+ at this stage of
training. If it can be assumed that experimental _Ss would also have
shown flat gradients had they been tested - as noted above, the
evidence here is conflicting - then it could be argued that the S-:S+
ratio was effectively unity. This argument, however, would also apply
to Bloomfield's results since his procedure and that of the present
study for experimental Ss were identical. In this case, it would have
to be argued that the PS occurred with a pre-test S-:S+ ratio of unity.
If, on the other hand, it is argued that such S+ exposure, even though
not attended to, is sufficient to reduce the S-:S+ ratio from unity, then
results of the present study, taken together with those of Bloomfield,
would suggest that while such additional exposure to S+ may be a
necessary condition, it is not sufficient for the occurrence of the PS.
In conclusion, the present results suggest that further studies
might be done to determine whether the PS might be more a function of
the stimulus dimension used than of discrimination training itself.
Further study of the relationship between behavioral contrast and the
CHAPTER V
SUMMARY
The peak shift, identified as a displacement of the mode of the
post-discrimination gradient from S+ in a direction away from S-,
has been found to occur regularly following non-orthogonal wavelength
discrimination training, Guttman (1965) has suggested that this
phenomenon may be specific to the dimension of wavelength. In the
light of some failures to obtain a PS on the line-tilt dimension, the
possibility arose that the PS may not occur as reliably with the line-
tilt dimension as with wavelength. The purpose of the present study
was to replicate Hanson's (1959) original PS results using the
dimension of angularity.
Three experimental groups and a control group were given S+ only
training. Experimental groups were then given non-orthogonal
discrimination training in which S- was a different line orientation
for each group. Following a post-S+ only training generalization test,
control Ss were given orthogonal discrimination training. Following
discrimination training, all Ss were tested for generalization to 12
line orientations.
While behavioral contrast occurred in all Ss for all experimental
Ss the modal stimulus of the generalization gradient was S+. These
results were interpreted as giving some support to the possibility that
PS results obtained on the wavelength dimension may not be generalizable
to the dimension of angularity, and as providing some support for
36
37
G u t t m a n ’s (1965) suggestion that the PS may be a function of the
stimulus dimension used.
The results of this study further suggested that more research
might be done to examine the relationship between behavioral contrast
and the PS in order to determine whether they are as closely related
38
APPENDIX A
Order of Presentation of S+ and S-
During Discrimination Training
1. S+
2.
S-3.
S-4. S+
5.
S-6.
s+
7.
s-8.
s-9. s+
10. s+
11.
s-12.
s+
13.
s+
14.
s-15. s+
16.
s+
17.
s-18.
s-19. s+
20.
s-21. s+
22.
S-23.
s-24. s+
25.
s+
26.
s-27.
s-28. s+
29.
s-30.
s+
A P P E N D I X B
Order of Presentation of Stimuli
During Generalization Test
1. 60° Right
2. 15° Left
3. 75° Left
4. 15° Right
5. 0°
-6. 30° Left
7. 75° Right
8. 45° Left
9. 90°
-10. 30° Right
11. 60° Left
12. 45° Right
13. 60° Right
14. 90°
-15. 300 Left
16, 450 Right
17. 450 Left
18. 150 Right
19. 300 Right
20. 60o Left
21. 750 Right
22. 150 Left
23, Oo
24. 750 Left
4 0
m O O ' M l O O N O ' O H H - J t H H O O O O ' O ' - l r N v o v o o ' > 0 ' H C O ' d ' v o c o a o c o c v | . H - d ' . H r ~ ' V O c o cvi o n < f N ^ s t O ' i f l t - i < t h , o \ ' 0 ^ ' d ' h - N O o n i N C N c n ^ M n s t C v l . H < s i < N C v | n c \ l < t . H < l
-i ' ' O v O r H o o c O ' d ' a v v -i ‘ a \ c o -i n -i ' ^ o o c o a v r ^ > r H to iriOw>-i'J’O ‘nO'OO'd'a'io^-}00'd’tNiN
i r i m O ' H b ' - i M O u i c i t o O O ^ - t o o O ' t ' - i ( N H t N f O H N t n c n M H C S I c n r O H M - t r M - d '
inovcovoinoor''iNoinav<t'oorHinoQincvi
cn ooni-ivovor^or'r^ro^-icsmi^cM^-or^
H r - i a i c M c N t n o i v D ' O c n v f i N f f i c r i N f o o c r i P i ' O C S | C M r H C O r H C \ I C O C O C M r - I H N f l H N s J r - i n
t o i s c n < n o o N < f o \ c r i r - i r ^ c * i M o o M M c j \ f n < f < f O O i n O ' l N < t O ' D - C l ' f , ) N N v O s f N O O ' - I N n.CTvr^vOrHcoinrHi-^in-.d'voavoinrHcocoin C S I C V l r H C V l r H C N C O r C t N i - I H M n H n - d - H M
.h inco<No\invoiN<fovocooocoaoavcor^r'' v t ^ O H O \ C O N O \ O ^ M r - l < t v O N h " d ' f O < t c o o \ v Q r ^ o o o o o o v o v o r ' . < r r ^ a \ o o < r . - t v o c o c o CN <N h CS h N m
o X % t? •H a •rl cd H rH c o + CO 60 a •rH 3 P w <D CO c o a M <U P i in
^ o o N f f i c o i o n n t s c T ^ i o o o n n n ^ r i o i o ' O h O H O N M n ' O O ' O f f l H i o i O H P i n i o < t n O O O O O f f " O r J t N W L O N N | N r - ( ! n r - l r - I O O cn cm h c o , h cm c o M r 4 r 4 N i N H i n M M N 0 ' O N M N n - - i c o H n n h s r o N < i - \ o ^ n o M N t n v o n o M s f M t ' i ' j ' a ' o o - J N K t ' - i o C T \ C M a v ! ' ' 0 0 \ < t a \ 0 0 < t > H O C M > H C O < H v O C M O tHCMrHCMHrHCMcM cMrHCMcMcMrHCOCMrHCO
co<o<JcMoi''-vovooocMcovocovooor''CocM
<n n ^ ' j N M o o i o i o i M o o a i n n o i O N H i o i s h n o o h ( N i M D O H i r i N o o s l ' ' J h H i r i H N r-l cv) H N CS CNrHrHCMrHrHCMCMrHCM i n - f H i r i n o o ' O O c D i M N N v t a i n n ^ K t ' a ) n N H h N ^ o o N m n i o c i ' o n n i o n o o o l O ^ M N o n H i n ' o n n h n o o n i n N N ® H N i- I M H H N N rH , Hr Hr Ht H< NCMr Hr H o o ^ i o n n i o i D N i N ^ i o n o i o n ' t i o n o i v o c o v o v o o v i n a v c o i n o v r H o o H a o i n c o H i n o i - i N < i ' i N | v . ^ o o c v | v D v o H i n c O ' d ' t n i r i i n ' f n rH CM r—I rH rH rH rH i—I r—I rH iH iH rH CM rH rH rH o v c o < f v o c M | - ' . . H O I ' ' 0 ' < f ' r H C O c o o o a ' > v O C M < 0 I l ' O O O v l ' i A t ' C O i O v O H H M v f i A C O e O ' O ® i N H < t r ^ o v < t v O r H f ^ < ) - H v o v o c n H v o c n ( N i n rH CM rH t—I i—I rH Cvj rH rH t—I rH rH rH r—I r—! r—I rH
CO
H O t O h - J i n O O H H < f H
O O O O r - ' C v J l T l C O O O r H O r H C O
-jioainootsncoNstnvt
co in uv ^ vo oo oo
Q sf CO i" 00 Ht in
-5 CO cvj vo o\ co o
S'
to
Q
t N H h v O H C O H n H ' J O V H O M V l l N O O ' h l C I voniniNOhnvocciHsrvjoinooHoooaio
t O ' d " a v O O O < N v f c o o v a v ' d - < t C T v C O O < N C M c o < N r—I r—1 Cv| rH rH rH t—I rH rH 1—1 rH rH rH rH
oor^rHoo<NomvovoocoCTviNcoaoooco<fav covoavincOrHcviovQOOtncoHtcovooavoovo inovovocooocTioor>r>rHavrH(NOr^coinvo
<*>!
HvtxttV'Oioonintn'oniNonioootONO H Q O v f s t v t c o v f m wo oc n Ho no ov i - Nf vD 'f'foivoo'ininvovosfooa\oin<tina\'j® cor^vooor'COHoor^i^-vorHHoor'Oooooooo =K==fe=S==S==fe=ffe=ft==ii==S==S;=fe=t!==!fc=H==«==S==ft:=S==S= a, 3 O U o
o o o o o o o o o o o o o o o o o o i n i n m i n i n o o o o o o
v O v O v O v O ' d - v t ' ^ - c T ' d ' C O C O C O C O c O u u c_> u
R e p ro d u ce d w ith p e rm is sio n of the co p yr ig h t o w n e r. F u rth e r re p ro d u ct io n p ro h ib ite d w ith o u t p e rm is s io n . APPENDIX D
Responses During Discrimination Training
Group 60°: 60°: 60°: 60°: 45°: 45°: 45°: 45°: 45°: S # #3411 #7406 #6904 #8647 #7949 #3548 #1537 #8645 #7685
Day 1 2 3 4 5 6 7 8 9 10 11 12 13 14
42
ov Ov CM CM CO CO oo CO o co in <f CM n- rH in o o o rH rH CM Ov Ov OV in rH O <t ov CM OV ov rH o\ in OV rH rH CO m c m 00 CO rH rH in m
CM rH rH rH rH CM CM CM rH 00 <t 00 rH co c m vO vO vo r-'* in rH O <t I''- rH m o vO O CO m <r in co c m VO O ov VO VO 00 vo vo 00 rH o i— i rH CO 00 1— 1 c m c m rH CM m VO 00 VO 00 MT m rH
CO rH CM rH rH CM CM CM rH vO VO VO rH 00 rH co m O vo CO O 00 00 vo in in o rH CM vo ov r^ VO CO vO Ov 00 vO rH rH vO rH rH <1* OV CM m <t o CM vO in VO rH vo r>* CM CO rH CM rH rH CM CM CM rH
00 «n vo in rH CO rH O' ■<r o 00 o vo CM r- o o i-H rH 00 »— i 00 00 ov 00 in rH 00 CM vO rH VO CO co VO VO rH rH h- OV rH CO CO O CO CM vO 00 <t 00 CO CO rH CM rH rH CM CM CM rH CO CM CO vo m -d* rH CO VO CO o m r- CM o vD 00 o sf VO o in as oo rH in rH o co vo CO CM h- 00 H oo r^ OV rH CM CO rH in in vf* n- 00 00 CM rH CM i i rH CM cM CM rH
c m m CM O CO <f rH O CM vj- vO CM rH O O m m vO CO CO vo m r>* vo rH CM CO o vO <1* m rH
Os vO CO O i-1 CO rH co <fr VO CO m CM r- vO o
CM f— I rH CM rH rH CM CM CM CM Ov CO Ov O <t CO CM in rH vo in <1* OV CO M3 OO CO CO -i vo in h- m co in 00 N rH 00 CO i— 1 M3 oo OV 00 CM CM rH co 00 m O rH r- m
CM rH CM rH rH CM CM rH CM CM Ov o oo r-' vo in m rH vO O o c m in rH VO Ov rH ov in VO CO M3 c m in rH 00 rH VO ov CM -d- in rH T-t 00 r-> ov O <N on c m fs'» rH 00 vO in co m -i vO oo cn
c m rH rH CM rH rH CM (N ^ CM CM vO VO CM CO CO rH OV rH 00 CO in rH in rH as \o CO ov oo as rH CO 00 00 h- in oo 00 ov o co in so m rH CM in <n VO H O CO CM Ov CO m 00 .-l CM vO CO .-4
CO I— 1 rH CM rH rH CM CO CM CM Ov O rH VO ai m oo in CO oo vO o CO in as o m ov as 00 00 vo Ov 00 .-1 vf 00 in co CO OV vo oo -d- •<r co as cm in 00 ov in CO vO o co VO r-* Q VO O «— i
CM rH CM CM rH CM -5 CM CO rH 00 rH t'"'. Os I"- CO OV m oo o o c m m O 00 CO Ov CM I''-Mi* CO ov O CO r> m vo ov VO rH O CO OV rH vo •<r vO vO r- in co CO 00 Ov CM vt* vO oo CO oo as
CM rH CM CM rH CM co CM CO CM OV rH OV <f 00 cM c m as 00 VO co in co <j- vo co O CM vO 00 rH 00 in m in o as co rH CO 00 -d- ov ov in ov co CM VO O vo -d* <t VO o M0 vf r- as m CM rH t-M 03
CM rH rH rH rH CO tH CM CO -l CM <]•
oo in «n oo rH OV rH M3 O CO vO r- r^ co oo CO CO as cm
o 00 vO O 00 rH 00 O rH OV Ov vO co in vo 00 rH in t''. CM 00 CM o ov Os r- rH rH I*-. CM CO o vo oo VO rH 00 00
rH rH rH rH rH rH CO rH co CO CM rH CO cr\ r-» OV OV vo in Ov CO co ov O rH in i'' rH VO CO CO 00 rH h- in r- rH 00 rH co OV rH I CO CM o r- as cm rH rH CO 00 00 cM <t* co m Ov CM ov n*. rH O 00 <t vO o co co rH rH rH rH rH rH rH rH CM rH CM CM rH rH CM »— t fo
+ * Hh 1 4- | + 1 + I + i + 1 + 1 + 1 + 1 Q CO CO CO CO CO CO CO CO CO CO CO CO CO CO CO CO CO CO C/3 C/3
VO CO CM o co 00 CO o
ov 00 CO rH o co 00 id =& oo Ov o in in ov 00 vO rH rH 00 oo 00 00 oo
w 1 =3= =& =Ss
a,
3 .. .. .. .. .. o o o o o o o o o o
o u u u u V o CO CO CO CO CO
43 w X M Q § PM 44 ca <v H c o •H 44 cti N •H
i— (
u <u c a> a M) 0 •0 o M a) ca G o CM co a) pi cn =s= o o vo 5 vO 00 =«= o o vO oo vO in cn CM oo VO LO cn CM a o *r4 44 Hi 44 CO CD Ml CM
O O O C M L O O C M O ' - i ' - l O O
vo cn
O O O M i - l r M l O I J I M O O O
in vo
O O v D N v D O v t h O C M O O vo cn
O O - J c M i n O H r C H C M O O *-4 vo in
O C M O O < - i O O v c n c M O O O
m
o
O O C M h H H v oN - J O O O av cn cn vo vo
-4 <f
o
o i M o c n M c f o c o i v i n v o o o vo
cm cm v o in
o o - M i n o o c M c M o o o o vo
o o o o n - o c n o o o o o
—i in
O O O ' - i ' d - O a v c n c M o O O -cl- t"
o o o ' - i c n o c o c n - i o o o
.— I r-- r—I
O O O O O V O 0 V 0 0 - - M O O O CM v o -cf
O O O O O O O - t O O O O
o o o r ' ^ M O ' - i o o o o o vo § 0'd-<tcMcnoon-or^ooo
< t c n m
|—4 1—4 ^4 1-4 1-4 pi Pi pi pi Pi G O O O O O O O O O O O O vo
o m o i n o i n o i n o i n o i n
av vo -cf cn *-t r4 cn <f vo in
ca 3 r—I 3 e •H 44 CO 00 r>-vO m cn CM oo VO m cn cm G o •H 44 cd 44 C CD ca 0) u CM
O O O O O O O O O O O O
O O O O C M r - i v j i O O O O O
o o o v o o - v O M j - o o r - ' O O
cm i n cm
o ^ o o o \ r - i c n < t ^ 4 0 o o
m m
ooav--iavcnoNOcMvoocn
r - t .-t -cT in
o c M O < r o o < t o o > - i o o o
cn cn
O O O O C O H i C h v O O N - t
-4 CM
vtO'-imin'fl'Oi-iOHocM
r4 *— I i— I vt cn Ml- cn
O 4 O 4 C 0 N M V O O M O O
r-c c n cm
O O O i - i O O v o c M v t O O O O
i—I CM c o CM
o o o o v f i n c u c M M O O o
CM CM CM CM
o o o o m r ^ c n m - 4 0 0 0
cm h cn cn
00"-icnooocMoocMr-400
CM cm CM
o o o - 4 < N c M i n c M c n o o o
h cm cn cn
o o m c o n m in M i n o o o
cm cn cn mc
O O O C M O O O 1—I O V O O O " —t O -4 vf -cf r-4
j j , j _4 _4 pi pi pi pi pi
O O O O O O O O O O O O
o i n o i n o i n o i n o i n o t n
-44 LT| <3-vO 00 =SSs O m -d m oo vo o in <r
o o o o <r *—1r—I o o o o •d o i—l vO o
00 vD oo <r asCM 00 CM
o o I" "1CM o in ON o Q\r-- o CN o o cn CMas
r - T-1VO t—1r~ i i—l CM r—i r^
i—i
n
o iH 00CM LOa m cn CM in o o cn 1—1VO n O
vO 00CTv 00r - cn i—i vO
o o 00i ! ln ON VO OvOso CTV cn o o cn CMas as
LO vo h- 00VO i—i cn in T-~i
o CN o r^ 00G\ <t 00m o oo o Nf o i—l in cn m
i—l Os O o CN Mf CM
i—l 1—1 r>
vo cn
o I-' c\cn o i—l in *<r o CN o in o o 00<r cn 00
cn r-^ 00 m 00r^» cn i—l m
=fe
o r^ LOaso 00<NasO o o o oo CM vO r-> cn
CM vo r - r^ 00 in CN cn • i CM cn i-i
o in
cn m < t o m 00 o> CMOS cn o o o o vO m
*—i CN r—1CM m r—100 <*■ cn
00
v O
in
cn
IN
O O O O t " < N O O O O O O
O O O c n c N ' C T r - i O O O t - i O cn
o —i m o o m - i - i c n o o c N
r—I *<3* i— |
O ' - i o o ' n i ' i o ' H O O f i o
O —l O O v O i N I ^ i n O O O O
O O O O C P i i —i C T i O O O O O
CN cn cn
o o o o N D o o ^ m o o o o a\
cn cn
o o o o o ^ r ^ c n o o o o
cn <n ^
J J J J J Pi Pi Pi Pi Pi
O O O O O O O O O O O O o i n o i n o i n o i n o i n o i n
a \ r ^ c o s f c n i - i i-i i n N1 i o h
CTV r-' oo in •vt cn cN a e 0 0 •H •rl ■M +J
cO CG a)
44 d j j
d H £
CD d a) W a a) <D •H a)
U •w 5^
P4 cn
cn o\ o
-d- cn
VO o CTV
N N H
r-1 o cn
< t -d- ^
O r i N O i O n H O O O t N O i—l ~d*
o o o o < N < r r ^ o v o o o - ^ < t CN
O O O O O O O O O O O O
o o o o c n o m o o o o o o o Nf
o>Hinr^cyvocin--d-oooo o cn -d- cn
O O O O O O O O O O O O
O O O O O O O O O O O O
O C N O ^ N c n O O v O O O O O
j j , j *4 j pi pi pi
o o o o o o o o o o o i n o i n o m o v n o m o\ in vo d n h h n n
w o r—1 3 0 •H 44 cn
R eproduced with permission of the copyright owner. Further reproduction prohibited w ithout permission.