18th International Conference on Structural Mechanics in Reactor Technology (SMiRT 18) Beijing, China, August 7-12, 2005 SMiRT18-G08-1
EVALUATION OF FULL SCALE PIPE TESTS BASED ON A
PROBABILISTIC PROCEDURE
Eberhard ROOS, Karl-Heinz HERTER, Michael RINGEL*
Materials Testing Institute (MPA), University of Stuttgart,
Pfaffenwaldring 32, D-70569 Stuttgart, Germany
*Phone: +49 711 685 3065, Fax: +49 711 685 3053
*E-mail: [email protected]
ABSTRACT
The determination of critical crack sizes or permissible/allowable loading levels in pipes with degraded pipe sections (circumferential cracks) for the assurance of component integrity is usually based on deterministic approaches. Therefore along with numerical calculation methods (finite element (FE) analyses) limit load calculations, such as e.g. the “Plastic limit load concept” and the “Flow stress concept” as well as fracture mechanics approximation methods as e.g. the R-curve method or the “Ductile fracture handbook” and the R6-Method are currently used for practical application. Numerous experimental tests on both ferritic and austenitic pipes with different pipe dimensions were investigated at MPA Stuttgart. The geometries of the pipes were comparable to actual piping systems in Power Plants. Different crack geometries and dimensions were considered. A new post-calculation of the above-mentioned tests was performed using probabilistic approaches to assure the component integrity of degraded piping systems. As a result the calculated probability of failure was compared to experimental behavior during the pipe test. The influence of the performance of non-destructive tests on the probability of failure was also taken into account. Different reliability techniques were used for the verification of the probabilistic approaches.
Keywords: full-scale pipe tests, probabilistic R6-Method, parametric sensitivity study, non-destructive test methods
1. INTRODUCTION
In conformity with the Nuclear Law and the Safety Standards for nuclear power plants the operators are obligated to guarantee the required precautions against damage in accordance with the current status of science and technology. This includes the proof of integrity of components by a comprehensive quality assurance during manufacture, installation and operation, a reliable monitoring of the operating conditions, the performance of in-service inspection and the recording, evaluation and safety related utilization of operating experience.
This approach is orientated towards the basic ideas of the German Basis Safety Concept (concept of fracture exclusion) (Kussmaul, 1984). For the practical application under operational conditions therefore the “independent redundancies” contained in the Basis Safety Concept come to the fore, in which their weighting has to be decided from case to case (RSK-guidelines, 1981-1984). Therefore extensive research and development work at a national and international level has been carried out over the past 25 years, e.g. by Wilkowski (1998) and Roos (2003).
failure behavior of austenitic and ferritic piping. A re-calculation of the tests was performed using probabilistic approaches. Different reliability techniques were used for the verification of the probabilistic approaches.
2. POSSIBILITIES OF ANALYTICAL AND NUMERICAL ASSESSMENT
For the assurance of component integrity the determination of critical crack sizes or allowable loading levels in pipes with circumferential cracks is required. Besides numerical methods (finite element analyses) limit load calculations, such as the “Plastic limit load concept” (PLL) (Kanninen, 1976) and the “Flow stress concept” (FSC) (Roos, 1989) as well as fracture mechanics approximation methods as e.g. the “Ductile fracture handbook” (1990) or the R6-Method (Milne, 1989) are used.
For practical application usually the PLL or FSC are used to assure the integrity of pressurized components (GRS, 2000). In both methods the maximum stress used (failure criterion) is described as the flow stress sf based
on the mechanical properties from the tensile tests. Usually the flow stress is chosen that the maximum applied bending moment in the test is conservatively covered by the limit load calculation. Statements as to crack initiation and crack propagation are not possible. The R6-Method is based on the proposition that the failure of the component can extend from brittle fracture to fully plastic failure depending on the material condition. The finite element (FE) method has established itself as a numerical procedure for the performance of two and three dimensional fracture mechanics structural analyses. With the R6-Method and the FE based fracture mechanics structural analyses, under monotonically rising loading a statement on failure above crack initiation can also be made without explicit simulation of crack growth. This is only possible, if the crack resistance curves determined from small specimens can be considered as representative of the cracked component. A precondition for this is that the pattern of multiaxiality of the stress state in the ligament of both specimen and component agree (Clausmeyer, 1991 and Roos, 1993-2005).
3. PROBABILISTIC CALCULATION
The probabilistic calculations were performed using the XPiPE Code (Schuler, 2002) extended by a probabilistic module based on the Monte-Carlo method (Rastogi, 1998). The Monte Carlo method is used in order to calculate a complex probability p to a specific condition. The calculations are performed by inserting random-generated numbers for all input parameter based on their statistical distributions. The theoretical point of view on the case of multivariate statistics, taking also into account the correlations of input parameters is dealed with in (Bilodeau, 1999 and Mardia, 1997).
4. EXPERIMENTAL INVESTIGATIONS
4.1 Material
Table 1: Material properties at room temperature
Pip e Material Yield Strength Rp 0.2
(MPa) Rp 1.0
(MPa)
Ultim ate Tensile Strength Rm
(MPa)
You ng’s Mod u lu s
E (MPa)
Red u ctio n of Area
Z (%) Elonga-tion A5 (%) J-valu e Ji
(N / m m )
DN 300 X 10CrN iN b 18 9 Base m etal Weld m etal
240-265 440-444 277-288 471-480 562-591 631-639 197000 170500 63.6-77.3 46.8-57.1 53.0-68.1 30.9-42.3 213-361 80-117
DN 200 X 10CrN iTi 18 9 Base m etal Weld m etal
211-243 437-496 249-286 488-533 556-601 669-720 197800 196600 75-80 38-58 53-66 23-46 302-398 73-146 DN 80 X 10CrN iN b 18 9
Base m etal Weld m etal
240-277 324-332 584-654 198500 79-81 57-58.5 229-258 288-317 DN 80 15 Mo 3
Base m etal Weld m etal
319-336 492-495 212600 68-69 30.5-43 132-160 126-128 DN 50 X 10CrN iN b 18 9
Base m etal Weld m etal
The pipes of nominal diameters DN50, DN80 and DN300 were fabricated of the austenitic material X6 CrNiNb 18 10 (Material No. 1.4550) and those of nominal diameter DN200 from the material X 10 CrNiTi 18 9 (Material No. 1.4541). In addition pipes of nominal diameters DN80 with ferritic material 15 Mo 3 (Material No. 1.5415) were available. The characteristic strength, ductility and fracture mechanics properties were determined, Tab. 1. All the values are higher compared to the minimum guaranteed values requested in the German KTA nuclear safety standard.
4.2 Results of the Pipe Tests
Loading of the test pipes was achieved by internal pressure and a superimposed external bending moment. The moment loading was applied quasi statically increasing monotonically on pipes with and without defects and with inserted fatigue cyclic loading (principally on DN50 and DN80 pipes) and displacement controlled with partial unloading to determine the component JR-curve (DN200 and DN300 pipes) up to the attainment of the of the maximum possible hydraulic ram stroke, Tab. 2.
Table 2: Test matrix
Pipe Dimensions Crack Loading
Nom. Diameter
Outer Diameter
(mm)
Wall Thickness
(mm)
Material Depth
(a/s)
Length
2α
(o)
Internal
Pressure pi
(MPa)
External Bending Moment
DN300 331 32.1 X 10 CrNiNb 18 9 0.5 – 1.0 60 - 120 16 Quasi
static
DN200 219.1 14.2 X 10 CrNiTi 18 9 0.5 – 1.0 120 - 270 7 Quasi
static
DN80 88.9 8.8 X 10 CrNiNb 18 9 0.25 – 1.0 60 - 120 16 Quasi
static
DN80 88.9 8 15 Mo 3 0.5 – 1.0 60 8 Quasi
static
DN50 60.3 8.8 X 10 CrNiNb 18 9 0.25 – 1.0 60 - 120 16 Quasi
static
5. RESULTS OF THE PROBABILISTIC CALCULATION
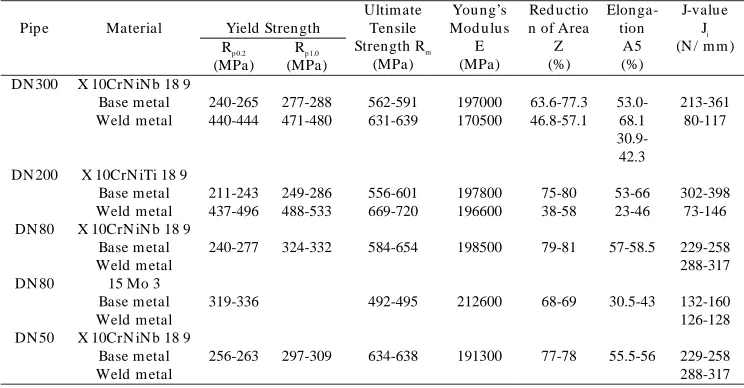
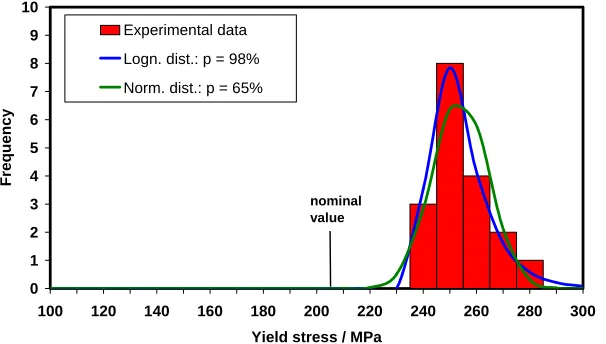
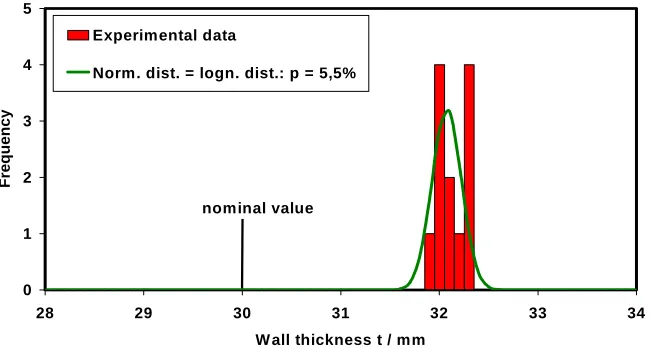
To estimate the loading (moment) at crack initiation the R6-Method extended by a probabilistic module was used (Schuler, 2002 and Rastogi, 1998). Different distributions were tested by Chi-Square-Test to find the most suitable distribution for the different input parameters. The statistical results of the DN300 pipes for the material, fracture mechanics and geometry parameters are shown in Fig. 1-7.
0 1 2 3 4 5 6 7 8 9 10
100 120 140 160 180 200 220 240 260 280 300
Yield stress / MPa
Frequency
Experimental data
Logn. dist.: p = 98%
Norm. dist.: p = 65%
nominal value
0 1 2 3 4 5 6 7 8 9 10
400 440 480 520 560 600 640 680 720 760 800
Ultimate stress / MPa
Frequency
Experimental data Logn. dist.: p = 3,8% Norm. dist.: p = 3,7%
lower nominal bound
upper nominal bound
Fig. 2: Tensile Strength Distribution (Material X 10 CrNiNb 18 9
0 1 2 3 4 5
180000 190000 200000 210000 220000
Young's modulus / MPa
Frequency
Experimental data Logn. dist.: p = 74% Norm. dist.: p = 28%
nominal value
Fig. 3: Young’s Modulus Distribution (Material X 10 CrNiNb 18 9)
0 1 2 3 4 5
150 170 190 210 230 250 270 290 310 330 350 370 390 410 430 450
Ji-value / N/mm
Frequency
Experimental data Logn. dist.: p = 82% Norm. dist.: p = 79%
0 1 2 3 4 5 6 7 8
150 170 190 210 230 250 270 290 310 330 350
KIJ-value / MPa m 1/2
Frequency
Experimental data Logn. dist.: p = 61% Norm. dist.: p = 66%
Fig. 5: K
IJValues Distribution (Material X 10 CrNiNb 18 9)
0 1 2 3 4 5 6 7 8
328 329 330 331 332 333 334
Outer radius D / mm
Frequency
Experimental data
Norm. dist. = Logn. dist.: p = 35%
nominal value
Fig. 6: Diameter DN300 Distribution (Material X 10 CrNiNb 18 9)
0 1 2 3 4 5
28 29 30 31 32 33 34
W all thickness t / mm
Frequency
Experimental data
Norm. dist. = logn. dist.: p = 5,5%
nominal value
Fig. 7: Wall Thickness DN300 Distribution (Material X 10 CrNiNb 18 9)
All 9 input parameters Hi (i≤n=9) for the post-calculation of 15 pipe tests with DN200 and DN300 are
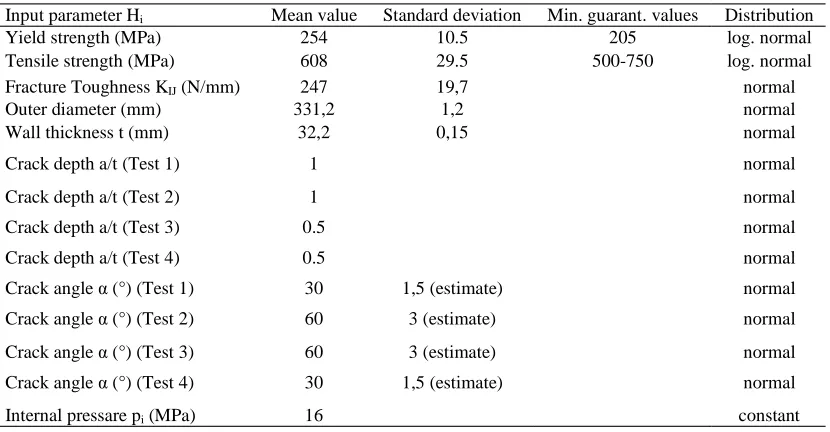
Table 3: Values of the input parameters for tests of DN300 (material X 10CrNiNb 18 9)
Input parameter Hi Mean value Standard deviation Min. guarant. values Distribution
Yield strength (MPa) 254 10.5 205 log. normal
Tensile strength (MPa) 608 29.5 500-750 log. normal
Fracture Toughness KIJ (N/mm) 247 19,7 normal
Outer diameter (mm) 331,2 1,2 normal
Wall thickness t (mm) 32,2 0,15 normal
Crack depth a/t (Test 1) 1 normal
Crack depth a/t (Test 2) 1 normal
Crack depth a/t (Test 3) 0.5 normal
Crack depth a/t (Test 4) 0.5 normal
Crack angle α (°) (Test 1) 30 1,5 (estimate) normal
Crack angle α (°) (Test 2) 60 3 (estimate) normal
Crack angle α (°) (Test 3) 60 3 (estimate) normal
Crack angle α (°) (Test 4) 30 1,5 (estimate) normal
Internal pressare pi (MPa) 16 constant
Table 4: Values of the input parameters for tests of DN200 (material X 10CrNiTi 18 9)
Input parameters Hi Mean value Standard deviation Min. guarant. values Distribution
Yield strength (MPa) 226 16.4 200 log. normal
Tensile strength (MPa) 581 13.2 500-730 log. normal
Fracture Toughness KIJ (N/mm) 273 17,7 normal
Outer diameter (mm) 218,1 0,8 normal
Wall thickness t (mm) 14,7 0,1 normal
Crack depth a/t (Test 5) 0,46
Crack depth a/t (Test 6) 1
Crack length α (°) (Test 5) 60 3 (estimate) normal
Crack length α (°) (Test 6) 30 1.5 (estimate) normal
Internal pressare pi (MPa) 16 constant
0 0.5 1 1.5 2 2.5 3 3.5 4 4.5 5
-100 -80 -60 -40 -20 0 20 40 60 80 100
Deviation from test / %
Frequency
Mean Deviation: 3%
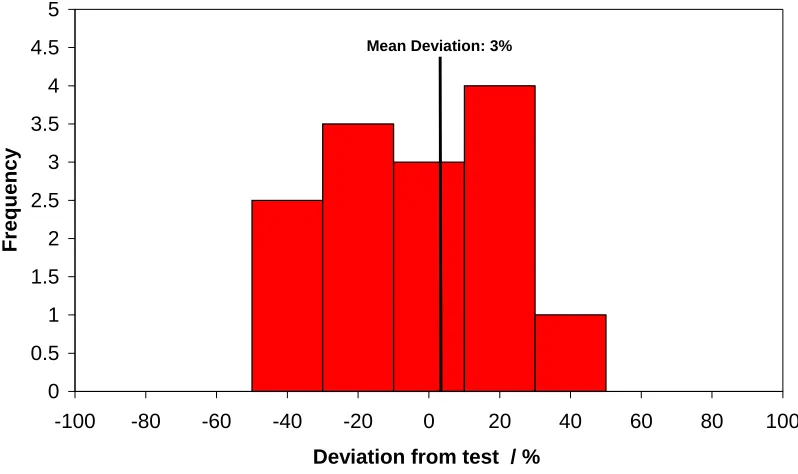
Fig. 8: Comparison of the moment of crack initiation calculated by the deterministic
R6-Method with the experimental results (potential drop method) of the tests
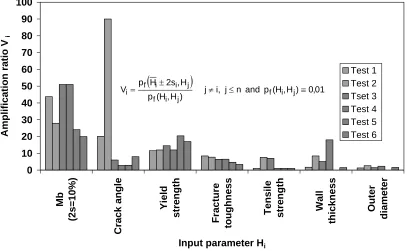
Then a sensitivity study was performed in order to set up a ranking of influences among the major input parameters Hi. To describe the sensitivity of the i-th input parameter the amplification ratio Vi is defined as
follows:
(
)
01 , 0 ) H , H ( p and n j i, j ) H , H ( p
H , s 2 H p
V f i j
j i f
j i i f
i ≠ ≤ ≡
± =
The denominator pf(Hi, Hj) is the probability of failure pf considering the input parameter Hi and the input
parameters Hj to be statistically distributed. It is set to 0.01 representing a small probability of failure that should
be given for the pipe being in service. The numerator pf(±2si, Hj) describes the probability of failure pf
considering the parameter Hi to be the constant value of ±2si (mean value, standard deviation si) and the
remaining input parameters Hj considered to be statistically distributed. The mean value will be changed
(addition or subtraction of 2si) such that the probability of failure pf will be raised. Based on the input parameters
of the 6 pipe tests, Tab. 3 and 4, the results are shown in Fig. 9. One can state a clear influence of the bending moment Mb if it varies by 10% within a 2si-range. Furthermore the sensitivity of the crack angle depends a lot on
0 10 20 30 40 50 60 70 80 90 100 Mb (2s=10%) Crack angle Yield strength Fracture toughness
Tensile strength Wall
thickness
Oute
r
diamet
er
Input parameter Hi
Amplification ratio V
i
(
)
01 , 0 ) H , H ( p and n j i, j ) H , H ( p H , s 2 H pV f i j
j i f j i i f
i ≠ ≤ ≡
± = Test 1 Test 2 Tset 3 Test 4 Test 5 Test 6
Fig. 9: Influence on moment of crack initiation of piping components if the specific input
parameter H
ideviates by 2s
ifrom its mean value
6. RESULTS OF NON-DESTRUCTIVE TESTS
To discuss the influence of the performance of non-destructive tests on the probability of failure 3 different ultrasonic tests have been made, Fig. 10. As a result the probabilities of detection for the different test methods vary depending on the crack depth to wall thickness ratios. The flaw detection rate differs significantly for small
a/t-ratios.
crack depth/ wall thickness
Flaw de te ct ion ra te
crack depth/ wall thickness
Flaw de te ct ion ra te
crack depth/ wall thickness
Flaw de te ct ion ra te
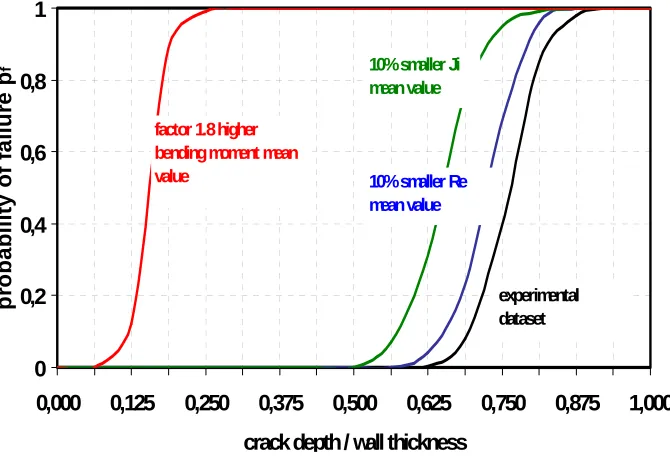
On the other hand, the determined probability of failure curve for the experimental dataset changes strongly by increasing the mean value of the bending moment depending on the a/t-ratio, Fig. 11. A 1.8 higher bending moment mean value in comparison to the experimental value leads to a shift of the probability of failure curve to very small a/t-ratios. Therefore a non-destructive testing method with a high probability of detection for small a/t-ratios has to be selected for higher bending moments to assure the component integrity of degraded piping systems.
0 0,2 0,4 0,6 0,8 1
0,000 0,125 0,250 0,375 0,500 0,625 0,750 0,875 1,000
crack depth / wall thickness
p
ro
ba
bil
it
y
of f
a
ilu
re
p
f 10% smaller Ji
mean value
10% smaller Re mean value
experimental dataset
factor 1.8 higher bending moment mean value
Fig. 11: Influence on the probability of crack initiation of piping components depending
on the a/t-ratio
7. CONCLUSIONS
To estimate the condition of crack initiation the R6-Method extended by a probabilistic module based on the Monte-Carlo method was used. Supported by this tool sensitivity studies of 6 pipe component tests were performed with statistically distributed data from strength and fracture laboratory specimen testing. The results of the investigations showed that the bending moment has the greatest influence if it shows scattering of at least 10%. With increasing crack extension in radial or circumferential direction the sensitivity increases accordingly. Material Properties as well as wall thickness do have a comparable influence whereas the outer diameter is less endangered to change results by scattering. The selection of the non-destructive testing method depends on the decrease of the a/t-ratio for a given probability of failure according to the input parameters scattering.
REFERENCES
K. Kussmaul, German Basis Safety Concept Rules Out Possibility of Catastrophic Failure, Nuclear Engineering International 12 (1984).
Guidelines of the German Reactor Safety Commission (RSK-Guidelines) for Pressurised Water Reactors; 3rd Edition, October 14, 1981; Revised Section 21.1 of 03/1984 and Section 21.2 of 12/1982; associated general specification "Basis Safety of Pressurised Components; Editor: Gesellschaft für Reaktorsicherheit (GRS)
E. Roos, K.-H. Herter, F. Otremba, J. Bartonicek, Load bearing capacity of degraded small diameter piping – Comparison of testing with calculation, Transactions of the SMiRT-17 Conference, (2003), Prag, Paper G07-2
Roos, E., K.-H. Herter, F. Otremba, K.-J. Metzner, General concept for the integrity of pressurized components, Transactions of the SMiRT-16 Conference, (August 12-17 2001), Washington, DC, USA, Paper No. 1725, Elsevier Science Publishers B.V.
Kanninen, M. F. et al.,Mechanical fracture predictions for sensitized stainless steel piping with circumferential cracks, EPRI NP-192, September (1976).
Roos, E., K.-H. Herter, P. Julisch, G. Bartholomé, G. Senski, Assessment of large scale pipe tests by fracture mechanics approximation procedures with regard to leak-before-break, Nuclear Engineering and Design 112 (1989), pp. 183/195.
Zahoor, A., Ductile Fracture Handbook, Vol. 2, October (1990).
Milne, I., The R6 Method. The assessment of cracked components by fracture mechanics, EGF4, Mechanical Engineering Publications, London, pp. 233/261, (1989).
Survey of European Leak-Before-Break Procedures and Requirements related to the Structural Integrity of Nuclear Power Plant Components, Comparative Analyses for Harmonisation Purposes, Contract with the European Commission, DG IX, Final Report (Rev. 2), (April 2000), Gesellschaft für Anlagen- und Reaktorsicherheit (GRS) mbH, Cologne.
Clausmeyer, H., K. Kußmaul, E. Roos, Influence of stress state on the failure behavior of cracked Components made of steel, Appl. Mech. Rev., Vol. 44, No. 2, (February 1991)
E. Roos, L. Stumpfrock, X. Schuler, U. Eisele, Fracture mechanics safety analysis of components based on fracture mechanics characteristics combined with multiaxiality of the stress state, Int. Jour. of Pressure Vessels and Piping 82, (2005)
Roos, E., Grundlagen und notwendige Voraussetzungen zur Anwendung der Risswiderstandskurve in der Sicherheitsanalyse angerissener Bauteile, Fortschrittsberichte VDI, Reihe 18, Nr. 122, VDI-Verlag Düsseldorf, (1993).
Schuler, X., XPiPE® Version 2.1 – calcualation modules for deterministic fracture mechanics analysis of flawed piping components, INTECS Engineering Services GmbH, Stuttgart, (2002).
Rastogi, Bhasin, H. S. Kushwaha, Comparison of safety margins for leak-before-break assessment of 500MWe PHWR straight pipes using contemporary technologies, Report Bhabha Atomic Research Centre (BARC) Trombay, Mumbai, India, BARC/1998/E004
Bilodeau, M., D. Brenner, Theory of multivariate statistics, New York, Berlin, Heidelberg, Springer-Verlag, (1999).