
i
MODEL OF DEMAND AND SUPPLY FACTORS AFFECTING GREEN COMMERCIAL PROPERTIES
ONUOHA IHEANYICHUKWU JOACHIM
A thesis submitted in fulfilment of the requirement for the award of the degree of
Doctor of Philosophy (Real Estate)
Faculty of Geoinformation and Real Estate Universiti Teknologi Malaysia
iv
ACKNOWLEDGEMENT
It might not be really necessary to trace the long journey associated with this thesis. Also, it may not be possible to acknowledge in details, the many scholars and students including brothers and friends who in one way or the other assisted me in the course of this work. First and Foremost, I would like to express my gratitude to the Almighty God who gave me good health, the energy and courage to persevere to the completion of this study. I would also like to express my profound gratitude to my main supervisor Associate Prof, Dr. Norhaya Kamarudin for her scholarly and valuable guidance and support in the course of this Study. I am deeply grateful, as her constructive criticisms kept me constantly focused. I was extremely lucky to be under her supervision, as she accepted every responsibility of a principal supervisor to guide this thesis.
Also, I would like to acknowledge the support and prayers of my family members Mrs. Benenadette Onuoha (my mum) and my brothers Mr. Chukwuemeka Onuoha and his family, Rev. Fr. Chukwudi Jude Onuoha (Eligwe), Chizoba John-Joesph Okoro and her husband Mr. John-Joesph Okoro, and Chioma Jane Onuoha. You have always been in my mind and heart during this period of my academic pursuit in Malaysia. In all stages, you people were supportive and helpful. Specifically, I thank my mum for her prayers and for inculcating in me right from babyhood how to make every effort to achieve goals and dreams. A very special thanks to Fr. Jude, Mr. Emeka and Mrs Chizoba for their relentless prayers and support during this period.
Besides, I owe particular thanks to Rev. Fr. Dr. Kevin Ori for his assistance during this period. I thank him for being helpful to me. I thank him for his immeasurable love and support which kept me constantly going. He has always encouraged me and been proud of my achievements. Worthy of mention is Mr. and Mrs. Andy Okoro and family for providing me with assistance at the time I needed it most. Furthermore, I wish to extend my appreciation to the following: Pastor Declan Ori, Mr. Cletus Ori, Mr. Patrick Ori, and Mrs. Angelina Ogu and their families for their prayers and encouragement. I would like to acknowledge the encouragement and prayers of brother Mou and Mr. Nnamdi. My thanks also go to my mother in-law Mrs. Salome Anyanwu and her family including Mr. and Mrs. Martin Iheanoacho and Mr. and Mrs. Isidor Agbanero for their constant prayers.
vi
ABSTRACT
ABSTRAK
viii
TABLE OF CONTENTS
CHAPTER TITLE PAGE
DECLARATION ii
DEDICATION iii
ACKNOWLEDGEMENT iv
ABSTRACT vi
ABSTRAK vii
TABLE OF CONTENTS viii
LIST OF TABLES xvi
LIST OF FIGURES xx
LIST OF ABBREVIATIONS xxii
LIST OF APPENDICES xxvii
1 INTRODUCTION 1
1.1 Background of the Study 1
1.2 Problem Statement 6
1.3 Aim of the Study 10
1.4 Research Questions 11
1.5 Objectives of the Study 11
1.6 Research Hypotheses 12
1.7 Significance of the Study 12
1.8 Scope of the Study 14
1.9 The Study Areas – Malaysia, Nigeria 16
1.9.2 Economic Structure 17 1.9.3 Political and Governance Structure 18
1.9.4 Socio-demographic Structure 20
1.10 Justification of the Study – Why Malaysia and Nigeria? 22
2 CONCEPTUAL FRAMEWORK 28
2.1 Introduction 28
2.2 Review of Related Theories 28
2.2.1 Social Cognitive Theory (SCT) 30
2.3 Research Constructs 33
2.4 Definition of Research Constructs 34
2.4.1 Personal and Altruistic Environmental Motivations 34 2.4.2 Corporate Conscience Responsibility Motivations 34 2.4.3 Economic and Financial Motivations 35 2.4.4 Life Cycle Cost Saving Motivations 35 2.4.5 Government Interest, Green Certification and Image
Motivations
35
2.4.6 Developers Expected Rate of Return Motivations 36 2.4.7 Market Benefit Strategy Motivations 36 2.4.8 Monetary Green Tax Incentives 36
2.4.9 Available Green Skills 37
2.5 Operationalization of Research Constructs and Conceptual Model
37
2.6 The Proposed Conceptual Model Overview 40
2.7 Summary 42
3 DEMAND FACTORS AFFECTING GREEN COMMERCIAL
PROPERTIES 43
3.1 Introduction 43
3.2 Green Commercial Property Demand Concept 43 3.3 Factors that Affect the Demand for Green Commercial
x
3.3.1 Personal and Altruistic Environmental Motivations 47 3.3.1.1 Thermal Comfort and Quality Acoustic
Environment 48
3.3.1.2 Improvement in Water Efficiency 50 3.3.1.3 Reduction of Solid Waste and
Minimization of Site Impact 50 3.3.1.4 Enhanced Energy Efficiency and C02
Reduction 52
3.3.2 Corporate Conscience Responsibility Motivations 53 3.3.2.1 Minimization of Strain on Local
Infrastructure 54
3.3.2.2 Reduction in Absenteeism 55 3.3.2.3 Boost Creativity, Higher Morale and
Lower Workforce Turnover 55
3.3.2.4 Users’ Satisfaction and more control over
the Environment 56
3.3.3 Economic and Financial Motivations 57 3.3.3.1 Optimization of Lifecycle Economic
Performance 59
3.3.3.2 Secures Grant and Subsidies 60 3.3.3.3 Improvement in Employee Productivity
and Satisfaction 60
3.3.3.4 Securing Higher rents and increased
resale value and profit 62
3.4 Summary 63
4 SUPPLY FACTORS AFFECTING GREEN COMMERCIAL
PROPERTIES 64
4.1 Introduction 64
4.2 Green Commercial Property Supply Concept 64 4.3 Factors that Affect the Supply of Green Commercial
Properties 69
4.3.1 Life Cycle Cost Savings Motivations 69
4.3.1.2 Construction Cost Savings 71 4.3.1.3 Maintenance Cost Savings 72 4.3.2 Government Interest, Policies and Green
Certification Motivations 73
4.3.2.1 Voluntary Green Building Certification 74 4.3.2.2 Mandatory Green Building Certification 75 4.3.2.3 Image, Branding, Award and Prestige 76 4.3.3 Developers’ Expected rate of Return Motivations 77
4.3.3.1 Profit, interest rates and Sources of Finance
77
4.3.3.2 Price signals of other certified Buildings 78 4.3.4 Market Strategy Benefit Motivations 79
4.3.4.1 Creating value within the compatible
market 80
4.3.4.2 Lower advertising costs 81 4.3.4.3 Meeting growing demand by tenants 82
4.3.5 Monetary Green Tax Incentives 83
3.3.5.1 Tax abatements and fee waiver 83 4.3.5.2 Loans, grants and rebates 84 4.3.5.3 Property tax credits and incentives 85 4.3.5.4 Low capital gains tax (CGT) 86
4.3.5.5 Low stamp duty (SD) 87
4.3.6 Availability of Green Skills 88
4.3.6.1 Design skills 90
4.3.6.2 Construction skills 91
4.3.6.3 Maintenance skills 92
4.3.6.4 Procurement skills 93
4.4 Summary 95
5 RESEARCH METHODOLOGY 97
5.1 Introduction 97
xii
5.3 Sources of Data Collection 102
5.4 Sampling Procedure, Size and Response rate 103 5.5 Research Instruments and Survey Design 109
5.6 Data Analysis Methods 111
5.6.1 Discriminant Analysis (DA) 112
5.6.2 Exploratory Factor Analysis (EFA) 114 5.6.3 Structural Equation Modelling (SEM) 116
5.6.3.1 Assumptions on Multivariate Analysis (SEM)
117
5.6.3.2 Assessment of Normality of Data Distribution
118
5.6.3.3 Software 119
5.6.3.4 Validity Measurement Model Approach 119 5.6.3.5 Assessing the Fit of the Model 124
5.7 Model Specification 127
5.8 Summary 130
6 RESULTS OF DATA ANALYSIS 131
6.1 Introduction 131
6.2 Assessment of Normality of Data Distribution 131 6.3 Respondents’ Demographic Characteristics and
Background Information
132
6.4 Descriptive Analysis of Perceptions on Demand and Supply Factors Affecting Green Commercial Properties
134
6.5 Discriminant Analysis 139
6.5.1 Analytical Comparison of Perceptions on Demand and Supply Factors Affecting Green Commercial
Properties 139
6.5.1.1 Group Mean Differences and Test of Equality of Group Mean on Perception of Demand Factors of Green Commercial
6.5.1.2 Predicting Discriminant Function for
Propensity to Demand Green Building 142 6.5.1.3 Group Mean Differences and Test of
Equality of Group Means on Perception of Supply Factors of Green Commercial
Properties 144
6.5.1.4 Predicting Discriminant Function for
Propensity to Supply Green Building 148 6.6 Implications and Lessons Drawn from the Result 152
6.7 Summary 155
7 DATA ANALYSIS USING STRUCTURAL EQUATION
MODELLING (SEM) 156
7.1 Introduction 156
7.2 Exploratory Factor Analysis of Demand and Supply Factors of Green commercial Properties
157
7.3 Results of Measurement Models for Demand and Supply Factors Affecting Green Commercial Properties
162
7.3.1 Measurement Model One 164
7.3.2 Measurement Model Two 166
7.4 Validity and Reliability Assessment and Fit of the Model for Demand and Supply Factors Affecting Green
Commercial Properties 168
7.4.1 Assessment of Convergent Validity 169 7.4.2 Assessment of Discriminant Validity 171 7.4.3 Assessment of Item Reliability 174 7.4.4 Assessment of Construct Reliability 175 7.5 Structural Equation Modelling (Testing of the Hypothesis) 176
7.5.1 Structural Model for Demand and Supply Factors Affecting Green Commercial Properties – Model
One (Hypothesized Model) 178
7.5.2 Structural Model for Demand and Supply Factors Affecting Green Commercial Properties – Model
xiv
7.6 Verification of the Results of the Hypotheses of this Study 183
7.6.1 Hypothesis H1 184
7.6.2 Hypothesis H2a 184
7.6.3 Hypothesis H2b 185
7.6.4 Hypothesis H2c 186
7.6.5 Hypothesis H3 187
7.6.6 Hypothesis H4a 188
7.6.7 Hypothesis H4b 188
7.6.8 Hypothesis H4c 189
7.6.9 Hypothesis H5a 190
7.6.10 Hypothesis H5b 191
7.7 Summary 192
8 RESEARCH FINDINGS, RECOMMENDATIONS AND
CONCLUSION 193
8.1 Introduction 193
8.2 Discussion on Research Findings 193
8.2.1 Model of Demand and Supply Factors Affecting
Green Commercial Properties 193
8.2.2 Identification of the Demand and Supply Factors
Affecting Green Commercial Properties 194 8.2.3 Relationship between Green Building Demand and
Green Building Supply of Commercial Properties 195 8.2.4 Relationship between Green Commercial Building
Demand and its Factors 196
8.2.4.1 Discussion on Findings – Demand Factors 196 8.2.5 Relationship between Green Commercial Building
Supply and its Factors 199
8.2.5.1 Discussion on Findings – Supply Factors 199 8.2.6 Perceptions on Green Building Demand and
Supply Factors that Affects Green Commercial Properties
203
8.4 Relationships between the Research Findings and Research
Theory 206
8.5 Recommendations 207
8.6 Contribution to Knowledge 213
8.7 Contribution to Practice 215
8.8 Limitations of the Study 216
8.9 Agenda for Further Research 217
8.10 Conclusion 218
REFERENCES 222
xvi
LIST OF TABLES
TABLE NO TITLE PAGE
1.1 Research Hypotheses of the Study 12
1.2 Selected Cross-Regional Studies on Green Building Features.
Source: Authors work, 2016 23
1.3 Related Studies on Green Building and Properties between
Malaysia and Nigeria [1]. Source: Authors work, 2016 26 1.4 Related Works on Green Building and Properties between
Malaysia and Nigeria [2]. Source: Authors work, 2016 27 2.1 Theoretically Based Motivations and Expectations of Green
Building Demand. Source: Authors work 2016 32 2.2 Theoretically Based Motivations and Expectations of Green
Building Supply. Source: Authors work, 2016 33
2.3
Demand Indicators, and their Sources and Research Constructs for Conceptual Model of Green Commercial
Properties. Source: Authors work, 2016 37
2.4
Demand Indicators, and their Sources and Research Constructs for Conceptual Model of Green Commercial
Properties. Source: Authors work, 2016 38
2.5
Demand Indicators, and their Sources and Research Constructs for Conceptual Model of Green Commercial
Properties. Source: Authors work, 2016 38
2.6
Supply Indicators, and their Sources and Research Constructs for Conceptual Model of Green Commercial Properties.
Source: Authors work, 2016 38
2.7
Supply Indicators, and their Sources and Research Constructs for Conceptual Model of Green Commercial Properties.
Source: Authors work, 2016 39
2.8
Supply Indicators, and their Sources and Research Constructs for Conceptual Model of Green Commercial Properties.
2.9
Supply Indicators, and their Sources and Research Constructs for Conceptual Model of Green Commercial Properties.
Source: Authors work, 2016 39
2.10
Supply Indicators, and their Sources and Research Constructs for Conceptual Model of Green Commercial Properties.
Source: Authors work, 2016 39
2.11
Supply Indicators, and their Sources and Research Constructs for Conceptual Model of Green Commercial Properties.
Source: Authors work, 2016 40
4.1 Pioneer Status (PS) and Investment Tax Allowance (ITA) in
Malaysia. Source: PwC, 2015 86
4.2 Holding Period of Real Estate Properties and their Property.
Source: PwC, 2013 87
4.3 Core Occupation in Green Building. Source: ILO, 2012 94 4.4 Main Skill Responses in Green Building. Source: ILO, 2012 95 5.1 Strength of Quantitative Dominant Research Approach of the
Study 100
5.2 Reasons for Adopting quantitative Dominant Research
Approach 100
5.3 Summary/Highlights of Research plan as captured in the
Research Design 102
5.4
Identified Real Estate Development Team and Stakeholders and their Related Activities in Green Building Construction
and Development 105
5.5
Continuation: Identified Real Estate Development Team and Stakeholders and their Related Activities in Green Building
Construction and Development 106
5.6 Estimated Population of Registered Real Estate Development
Experts in Malaysia and Nigeria 107
5.7
Estimated Population of Registered Real Estate Development Experts in Kuala Lumpur Malaysia and Abuja and Lagos
Nigeria 108
5.8
Estimated Population and Sample Size of Registered Real Estate Development Experts in Kuala Lumpur Malaysia and
Abuja and Lagos Nigeria 108
xviii
5.10 Justifications for Using Structural Equation Modelling SEM and Adopting Validation Approach
117
5.11 Stages Involved in Pool Measurement Model 120
5.12 Characteristics of Goodness-of-Fit Indices 125
6.1
Measures of Constructs and Descriptive Statistics - Normality Distribution of Demand Factors Affecting Green Commercial
Properties 132
6.2
Measures of Constructs and Descriptive Statistics -Normality Distribution of Supply Factors Affecting Green Commercial
Properties 133
6.3 Respondents Profile and Demographic Information 134
6.4
Descriptive Statistics and Cross Tabulation of Perceptions on Demand Factors of Green Commercial Properties in
Percentage 135
6.5
Descriptive Statistics and Cross Tabulation of Perceptions on Supply Factors of Green Commercial Properties in
Percentages 137
6.6
Continuation: Descriptive Statistics and Cross Tabulation of Perceptions on Supply Factors of Green Commercial
Properties in Percentages 138
6.7
Group Mean Differences and Test of Equality of Group Mean of Demand Drivers of Green Commercial Properties
(Malaysia and Nigeria) 140
6.8 Predictive Model of Demand Drivers of Green Commercial
Properties 143
6.9
Standardized Canonical Discriminant Function Coefficient and Structure Matrix of Demand Drivers of Green
Commercial Properties 144
6.10
Group Mean Differences and Test of Equality of Group Means of Supply Drivers of Green Commercial Properties
(Malaysia and Nigeria) 145
6.11 Predictive Model of Supply Drivers of Green Commercial
Properties 148
6.12
Standardized Canonical Discriminant Function Coefficient and Structure Matrix of Supply Drivers of Green Commercial
Properties 149
7.1 Extracted Factors of Demand and Supply of Green
7.2 Variance Extracted 159 7.3 Representative Constructs and Variables for Measurement
and Validation 163
7.4 Factors Loadings and Convergent Validity for Demand and
Supply Factors of Green Commercial Properties 170 7.5 Average Variance Extracted Test for Discriminant Validity 172 7.6 Continuation: Average Variance Extracted Test for
Discriminant Validity 173
7.7
Parameter Factors Relationship and Reliability Coefficient of Demand and Supply Factors Affecting Green Commercial
Properties 175
7.8 Test of Construct Reliability 176
7.9 Underlying Hypotheses 177
7.10 Testing Hypothesis of Model One Using Standardized Estimates
180
7.11 Testing Hypothesis Using Standardized Estimates of Model
Two- (Final Model) 182
7.12 Fit Indices of Final Structural Model for Demand and Supply
xx
LIST OF FIGURES
FIGURE NO TITLE PAGE
1.1 Map of Malaysia (Source: https://maps.google.com/) 16 1.2 Map of Nigeria (Source: https://maps.google.com/) 17 1.3 Diamond Building, the eight-story Green Building in
Putrajaya Malaysia. Source: Lim Japheth (2013) 21
1.4
Ultra-modern LEED certified eco-friendly Building in Nigeria (Heritage Place) Lugard Avenue Kingsway Road Ikoyi Lagos (15,736sqm Office Space). Source:
http://heritageplaceikoyo.com/ 22
2.1 Hypothesized Conceptual Model for Demand and Supply
Factors Affecting Green Commercial Properties 41 3.1 Fundamental Law of Demand. Source: Rena (2011) 44 4.1 Short-run vs Long-run Price Changes. Source: Rena (2011) 66 5.1 Quantitative Dominant Research Design of Demand and
Supply Factors Affecting Green Commercial Properties 101
5.2
Hypothesized Validation and Measurement Model for Demand and Supply Factors Affecting Green Commercial
Properties 129
6.1 Mean Total Scores of Demand Drivers of Green
Commercial Properties (Malaysia and Nigeria) 150 6.2 Group Mean differences of Demand Drivers of Green
Commercial Properties (Malaysia and Nigeria) 151 6.3 Mean Total Scores of Supply Drivers of Green Commercial
Properties (Malaysia and Nigeria) 151
6.4 Group Mean Differences of Supply Drivers of Green
Commercial Properties (Malaysia and Nigeria) 152
7.2
Measurement Model for Demand and Supply Factors of Green Commercial Properties – Model “A” (all factor
loadings) 166
7.3
Structural Path-diagram of Validity Measurement for Demand and Supply Factors of Green Commercial
Properties –Model “B” (all factor loadings) 167 7.4 Structural Model for Demand and Supply Factor Affecting
Green Commercial Properties – Model One 179 7.5 Structural Model for Demand and Supply Factors Affecting
xxii
LIST OF ABBREVIATIONS
AGFI - Adjusted Goodness of Fit AGS - Available Green Skills
AMOS - Analysis of Moment Structure
ASEAN - Association of Southeast Asian Nations AVE - Average Variance Extracted
BCA - Building and Construction Authority BIPV - Building Integrated Photovoltaic
BREEAM - Building Research Establishment Environmental Assessment Methods
CBE - Centre for Built Environment CBRE - Coldwell Banker Richard Ellis
CCRM - Corporate Conscience and Responsibility Motivations CDFA - Council of Development Finance Agencies
CFI - Comparative Fit Index
CGT - Capital Gains Tax
CSR - Corporate Social Responsibility
CT - Conventions Theory
DA - Discriminant Analysis
DERRM - Developers’ Expected Rate of Return Motivations ECN - Energy Commission of Nigeria
ECOWAS - Economic Community of West African Countries EFA - Exploratory Factor Analysis
EFM - Economic and Financial Motivations EPA - Environmental Protection Agency GBCN - Green Building Council of Nigeria GBCSA - Green Building Council of South Africa
GBD - Green Building Demand
GBI - Green Building Index
GBRS - Green Building Rating System
GBS - Green Building Supply
GDP - Gross Domestic Product GFI - Goodness of Fit Indices
GGGC - Governors’ Green Government Council
GIPGCM - Government Interest, Policies and Green Certification Motivations
GM - Green Mark
GS - Green Star
xxiv GTFS - Green Technology Financing Scheme
HKGBC - Hong Kong Green Building Council HVAC - Heating, Ventilation and Air Conditioning IBS - Industrialized Building System
IEA - International Energy Agency IEQ - Indoor Environmental Quality IEQ - Internal Environmental Quality ILO - International Labour Organization IMF - International Monetary Fund
IPCC - International Panel on Climate Change ITA - Investment Tax Allowance
LCA - Life Cycle Assessment
LCC - Life Cycle Cost
LCCSM - Life Cycle Cost Savings Motivation
LEED - Leadership in Energy and Environmental Design MBSM - Market Benefit Strategy Motivations
MGBC - Malaysia Green Building Confederation MGTI - Monetary Green Tax Incentives
MI - Modification Indices
MIDA - Malaysian Investment Development Authority MOHEM - Ministry of Higher Education Malaysia
NBS - National Bureau of Statistics
NFI - Normed Fit Index
NGTCM - National Green Technology Council Malaysia NIBS - National Institute of Building Science
NNFI - Non-normed Fit Index
NNPC - Nigerian National Population Commission NPCC-RS - National Climate Change and Response Strategy
NPV - Net Present Value
NRNC - Non-Residential New Construction
OECD - Organization for Economic Development Cooperation PAEM - Personal and Altruistic Environmental Motivations PBC - Perceived Behavioural Control
PREA - Pension Real Estate Association
PwC - PricewaterHouseCoopers
REDAN - Real Estate Developers’ Association of Nigeria
REHDA - Real Estate and Housing Developers’ Association Malaysia REIT - Real Estate Investment Trust
RMSEA - Root Mean Square Error of Approximation ROI - Return on Investment
RPGT - Real Property Gains Tax SCT - Social Cognitive Theory
xxvi SEM - Structural Equation Modelling
SMSUD - Shanghai Manual of Sustainable Urban Development SPSS - Statistical Package for Social Science
TLI - Tucker Lewis Index
TPB - Theory of Planned Behaviour
UNEP - United Nations Environmental Protection
UNEPFI - United Nations Environment Programme Finance Initiatives UNFCCC - United Nations Framework Convention on Climate Change US GBC - United States Green Building Council
US-EIA - United States Energy Information Administration US-EPA - United States Environmental Protection Agency
US-SCEPW - United States Senate Committee on Environment and Public Works
VAT - Value Added Tax
VBN - Value Belief Norm
WGBC - World Green Building Council
LIST OF APPENDICES
APPENDIX TITLE PAGE
A Publications Associated with this Thesis / Papers
Co-published During the Period of this Study 267
CHAPTER 1
INTRODUCTION
1.1 Background of the Study
Real estate green property market consists of three main asset categories: residential, commercial and special purpose buildings (Kats et al, 2003; Breglia, 2012). Green commercial properties which is the focus of this study consist mainly of offices, shops and retail (Chequt et al, 2013; Olszewski, 2013). In many countries including Malaysia and Nigeria, green housing which is built for the purpose of letting it to tenants is considered as part of green commercial real estate market (Chequt et al, 2013; Olszewski, 2013). One of the key characteristics of green com-mercial property is that it lies within the marketplace that is subject to inter-depen-dent forces of demand and supply factors (Olszewski, 2013). Thus, the market is of-ten controlled by the behaviour patterns and motivation of active buyers/users, in-vestors and developers in the market (Ingrid, 2006). However, the main difference be-tween the participants lies in the length of participation and motivation as well as the benefits being pursued (Henneberry and Rowley 2002; Ingrid, 2006).
2
that there is likely to be positive relationship between green building demand and supply factors in a marketplce. This is because as the supply of commercial buildings certified to be green increases, the demand for such buildings is affected by more private sector attention to energy efficient buildings (Chegut et al, 2013). Given this scenario, Aliagha et al, (2013a) observed that model of demand and supply factors of green building will comprise of interrelated factors such as energy efficiency and environmental sustainability which has not been fully explored.
A green building (also known as green construction or sustainable building) whether residential or commercial refers to both a structure and the using of processes that are environmentally responsible and resource-efficient throughout a building’s life-cycle (Kriss, 2014). It is one whose development and lifetime operation offers the healthiest conceivable environment while guaranteeing the most productive and least disruptive use of land, water, energy and resources (GGGC, 2010). According to IMF working paper (2011) a green building is an investment necessary to reduce greenhouse gas and air pollutant emanation, without basically reducing the creation and utilization of non-energy goods. While there are many different definitions of green building, it is generally accepted as the planning, design, construction, and operations of buildings with foremost considerations on energy use, water use, indoor environmental quality, material section and the building’s effects on its site (Kriss, 2014).
Nurul and Zainul (2013) had argued that for green building to guarantee the above benefits, it requires real estate participants with right knowledge and motivation to invest in green building. Motivation is the force that drive individuals to buy, use, demand or supply a good or service (Gibler and Nelson, 1998). In this case it explains the benefits and factors that motivate buyers and investors to invest in green commercial properties (Nurul and Zainul, 2013). Because real estate property is a unique business, supply and demand in real estate market are often said to be localized as investors may pay attention to factors that influence their local market (Kimmons, 2012). However, not when what motivates them is not within their control (Gibler and Nelson, 1988). For example, the global change in climate may inevitably influence green building demand and supply (Aliagha et al, 2013a). Moreover, international evidence shows a strong correlation between different types of real estate in different countries. Market factors which are uncorrelated in normal times might be strongly correlated in times of economic distress (Olszewski, 2013).
3
example, in 1989-1996 the collapse of Japanese real estate market had significant deteriorating effects on the US commercial real estate market. Japanese investors and banks, which had large shares in US market were forced to reduce lending to US commercial real estate market (Peek and Rosengren, 2000; Olszwski, 2013). Again, the cross border studies of the real estate market dynamics of twelve European countries show that it is possible to consider different real estate property market as one market (Wigren and Wilhelmsson, 2007; Norhaya et al, 2010). This is particularly important now that cross-regional studies indicate that green building investment is becoming less localized to one part of geographical region due to increasing global marketplace motivated by prevailing concerns on world climate change (McGraw-Hill Construction, 2013).
The focus of this study is Malaysia and Nigeria. Malaysia and Nigeria are in the same tropical zone (Abduliahman et al, 2013). Both countries are in the same latitude characterized by hot and humid climate. Thus, tropical countries such as Malaysia and Nigeria will be adopting green features suitable for green property markets that would help in reducing high temperature. On this bases, they share certain similarities in environmental features which could have clear implications for green building demand and supply. Again, Malaysia and Nigeria operate a free market where the private sector dominates the property sector. As Bawa (2013) put it, Malaysia and Nigeria have adopted comparable components of private sector dominated property delivery systems. This suggests that their property markets and the behaviour of the market participants in both countries may not differ much. Besides, the construction sector contribution to Malaysia and Nigeria GDPs is largely the same. Malaysia construction sector contribution to GDP is averaging 3.5% (Sariah et al, 2014). While in Nigeria it is in the region of 3% (Isa et al, 2013).
The above similarities however does not suggest that there may not be differences that could shape their markets and affect the perception of green commercial property market participants in both countries. For example, Malaysia has pursued green building policies that have impacted on her real estate commercial
property market more than Nigeria. Malaysia for example, has set up the Green
4
building investment and adoption among public and private sectors in Malaysia. (Aliagha et al., 2013a).
On the other hand, Nigeria is presently developing its policy framework for green buildings. As an initial move towards developing green building, Nigeria has in 2014 enlisted the Green Building Council of Nigeria (GBCN) with the World Green Building Council (WGBC) (WSP, 2014; Nduka and Ogunsamni, 2015). Nigeria has not yet developed green building rating tool that could be used for office, retail, multi-unit residential, public and educational building projects in Nigeria. However, at the moment, the Nigerian government has allowed the Green Building Council of South Africa (GBCSA) to certify green buildings in Nigeria using the Green Star SA - Nigeria (WSP, 2014). This asymmetries in green building policies, development and implementation between the two countries seem to put Malaysia in a lead against Nigeria. The implication is that green commercial property market participants in Malaysia may have better perception of the market and the factors that drive green commercial property demand and supply than their Nigerian counterparts.
For instance, studies have revealed that the demand and supply of green building is moderate in Malaysia (Abidin et al, 2012) while others say it is below average (Milad et al, 2013; Nazirah, 2009; Nazirah, 2010) whereas in Nigeria it is very low (Dahiru et al, 2014; Nduka and Ogunsamni 2015). This is perhaps because green commercial property market in recent times have been characterized by insufficient knowledge of the motivational drivers and uncertainty on the likely returns and benefits associated with green commercial properties among the stakeholders (Kats et al, 2003; Nurul and Zainul, 2013; Aliagha et al, 2013). Again, international comparison of green property market structure suggests that one characteristic for a matured property mar-ket is one driven by investors, developers and clients who are well-informed of the market factors that drive green property investment (DArcy and Keogh, 1998). Malaysia and Nigeria can be said to be at different levels of maturity in green build-ing.
5
of 361 applied, only 24 secured their final certification (Green Building Index, 2015). Till date, a total of 402 commercial buildings have applied for certification under the non-residential new construction (NRNC) category, only 31 have secured their final certification (Green Building Index, 2016). While Nigeria has registered 317,039sqm of green buildings (US GBC, 2015) and certified only 1 commercial building (Gray, 2015). The above scenario suggests that there is not yet a critical expansion in the qauantity of certified green commercial buildings in Malaysia and in particular Nigeria.
Experts have argued that the situation may have risen because the real estate development team who controls the chunk of green building market is either not aware or is less certain of the satisfactory returns and motivational factors of green commercial buildings (Nazirah, 2009; Nurul and Zainul, 2013). In particular, in MIS Asia, CS Tan had warned developers to pause and think about green building market before they begin to invest (MIS Asia, 2009) while Chen et al. (2014) contended that developers have always seen the development and practice of green commercial building from business sector perception with less consideration to ecological issues. Besides, Eichholtz et al. (2009a) noticed that both developers and institutional financial investors are still uncertain and hazy about how to go into green building investment, as the economic and financial motivational factors for it are still based on subjective evidences. Given this scenario, Aliagha et al, (2013a) explained that the demand and supply factors of green buildings could be modelled to provide bet-ter explanations and show the relationships and inbet-terrelated factors that drive green commercial building.
6
most influential effect on demand and supply of green commercial properties. While
the discriminant analysis model is used to establish if there are significant differences in perception between Malaysia and Nigeria on the factors that motivate the demand and supply of green commercial properties.
This is in line with Norhaya et al, (201; 2014) contention that property market factors could be examined and established through models both in specific country and across various markets and that there is practically no limit to the use of models in property market analysis. Given the strength of this statement, this study empirically examined cross-regional perception of property market participants in Malaysia and Nigeria on factors affecting green commercial properties using discriminant analysis model. Existing studies on green building appeared to have concentrated on green residential buildings (Christopher, 2007), government and institutional green buildings (Shahamir and Zakara, 2014). Studies focusing on green commercial properties (Wade et al., 2003) are mostly identified with energy productivity without particular consideration regarding the related interdependent elements that underlie the demand and supply of green commercial properties. It is therefore against these backdrops that this study identified and modelled those motivational factors and variables that could drive green commercial properties. In other words the study developed a model that provides causal explanations for demand and supply factors affecting green commercial properties with focus on Malaysia and Nigeria.
1.2 Problem Statement
7
best capture the motive of buyers and real estate participants in green commercial property demand and supply (Nurul and Zainul, 2013; Aliagha et al, 2013a).
The implication is that the real estate market participants are less certain of the strategic factors that could best deliver high performance commercial properties. For instance, as observed earlier MIS Asia CS Tan (2009) had cautioned real estate developers to pause and reflect on green building market motivators before they begin to invest. The inference is that the factors that mostly influence the demand and supply of green commercial properties have not been fully explored. This is further complicated by the volatility of the green property market and the behaviour patterns of active investors and developers in the market (Ingrid, 2006). Also, lack of understanding of green building market fundamentals, institutional framework and dearth of information has affected investors concept of green building demand and supply (Isa et al, 2013; Joshi and Rahman, 2015). As such, it is difficult for buyers, investors and developers to have solid grip of emerging green commercial property market and the factors that drive their participation.
As a consequence, vicious circle of blame has continued to occur among the green real estate development team while buyers have continued to be influenced by the belief that green commercial properties are not easily affordable. For example, developers, contractors and consultants are complaining that clients do not ask for sustainability (Baldock, 2000). The design team such as architects have continued in their old ways of design approach and are reluctant to embrace the modern strategies. Buyers on the other hand are worried that green buildings are costly and take a longer time to complete (Bordass, 2000). As such, they expect the developers and investors to be at the forefront and vanguard in improving their services (Business Vantage, 2002). The subsequent effect of this is continued increase in conventional and traditional buildings with its attendant environmental problems.
8
sector dominates the property market (Bawa, 2013; Nikkei-Veritas, 2014). On this bases, Malaysia and Nigeria may share similar problems of green commercial property market factors. Besides, both countries practice green building and sustainablility (Alabi, 2012). In other words, their green building markets are characterized by potential buyers and participants who may be motivated by certain factors and expectations on green building demand and supply.
Regardless of this, their market size by number of registered and certified green buildings differ. For example, in Malaysia, a total of 768 green buildings have applied for GBI certification, 374 have been certified as of 15th November, 2016 (Green Building Index, 2016). While in Nigeria, a total of 317, 039gsm of green buildings have been registered (US GBC, 2015). However, on green commercial properties which is the focus of this study, Malaysia and in particular Nigeria has not invested significantly. At the moment, demand for and supply of green commercial buildings particularly in Nigeria still represent only a small percentage in the building industry. Put differently, green commercial property investment in Malaysia at the moment is below average but very low in Nigeria (Dual Citizen LLC, 2014). For example, in Malaysia about 62.5% of green office buildings have been supplied while 12.5% are under construction (Isa et al, 2015). Furthermore, as noted earlier, a total of 228 commercial buildings applied for the GBI green certification in 2013 and only 5 buildings received their final certification (Green Building Index, 2013; Isa et al 2013). In 2015, a total of 361 applied and 24 secured their final certification (Green Building Index, 2015). Till date, a total of 402 commercial buildings have applied for certification in Malaysia under the non-residential new construction (NRNC) category, only 31 have secured their final certification.(Green Building Index, 2016).
9
China with 22, 959,342sqm (US GBC, 2015).
This situation appears to demonstrate that Nigeria is lagging behind Malaysia in performance while Malaysia is falling behind other countries in green building despite the huge potential market that exists in both countries. The implication is that there are multiple factors that could affect the demand and supply of green commercial buildings in both countries which real estate participants have not fully explored. Dahiru et al, (2014) and Isa et al (2015) have argued that factors affecting the demand and supply of green buildings in Malaysia and in particular Nigeria have been researched with less attention and further studies are required on the advantageous features of green buildings. While attempts have been made within and outside the study areas to discuss these multiple factors (Alev and Baabak, 2010; Ooi Jen Mei et al, 2012; Isa et al, 2013; Aliagha et al, 2013a; Nurul and Zainul, 2013), a number of critical research gaps remain.
One of these gaps is lack of empirical investigation into the impact of the relationships of the factors on green commercial properties. Green commercial properties is becoming an area of interest in relationship with demand and supply factors. Chequt et al, (2013) had argued that a relationship in green building demand cannot be thought to effectively exist without supply. Thus, the need for empirical evidence of the relationship between demand and suppy factors as key indicators to green commercial property investment has been suggested in past researches. For example, Aliagha et al, (2013a) and Mohamad et al, (2015) provided an important avenue for further research when they argued that model of green commercial building demand and supply will comprise of interrelated factors vis-a avis environmental sustainability, increased productivity, cost savings, energy efficiency, tax incentives, developers returns, branding and prestige etc.
10
green commercial property demand and supply, it becomes imperative for this study to fill the gap.
As observed earlier, given that the study areas Malaysia and Nigeria operate the same property market delivery system where the private sector dominates investment in real estate properties (Alabi, 2012; Bawa, 2013). Besides, given that green building investment is becoming less localized in one geographical region and state due to increasing global marketplace driven by world climate change (McGraw-Hill Construction, 2013). Again, because Malaysia and Nigeria falls within the same geographical latitude characterized by hot and humid climate which could have obvious impact on green building features and materials, this study attempts to determine perception of Malaysia and Nigerian real estate market participants on the demand and supply factors affecting green commercial properties.
Determining the perception of real estate professionals on sustainability factors according to Alabi (2012) will explain the overall effects of the factors on green building investment. Although among the authors, Alabi is the only researcher to have specifically examined the perception of the real estate professionals on sustainability features between Malaysia and Nigeria, in doing so, he did not link it to green commercial properties neither did he discuss nor model both the demand and supply factors affecting green commercial properties. As argued by Kuye (2000) in real estate investment, demand is not isolated from supply. This suggests that the perception of real estate participants in Malaysia and Nigeria on the demand and supply factors affecting green commercial properties is a gap in the literature that needs to be explored. Thus, it is the contention of this study that such cross-country comparison study will be an added advantage to both countries to learn from others’ experiences and benchmark themselves. Accordingly, the following aim, questions and objectives have been identified out of the problem of this research.
1.3 Aim of the Study
11
1.4 Research Questions
a) What are the demand and supply factors that affect green commercial properties?
b) Are there significant relationship between green building demand and green building supply of commercial properties?
c) Are there significant relationship between green commercial building demand and its factors?
d) Are there significant relationship between green commercial building supply and its factors?
e) Are there significant differences in perception between Malaysia and Nigeria consumers and investors on the factors that motivate the demand and supply of green commercial properties?
1.5 Objectives of the Study
In order to achieve the aim of this study and guided by the research problems, this research pursued the following objectives:
a) To identify demand and supply factors that affect green commercial properties.
b) To determine the relationship between green building demand and green building supply of commercial properties.
c) To ascertain the relationship between green commercial building demand and its factors.
d) To acertain the relationship between green commercial building supply and its factors.
12
1.6 Research Hypotheses
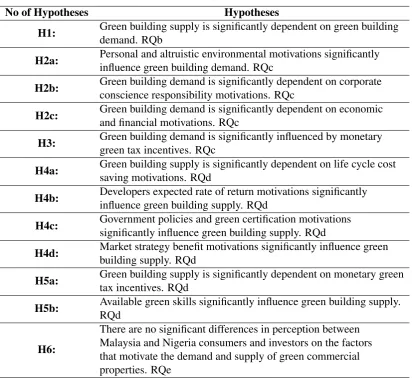
Based on the research questions, the study verified the following hypotheses. For details see chapter two which explains the conceptual framework from where the hypotheses were derived.
Table 1.1:Research Hypotheses of the study
No of Hypotheses Hypotheses
H1: Green building supply is significantly dependent on green building demand. RQb
H2a: Personal and altruistic environmental motivations significantly influence green building demand. RQc
H2b: Green building demand is significantly dependent on corporate conscience responsibility motivations. RQc
H2c: Green building demand is significantly dependent on economic and financial motivations. RQc
H3: Green building demand is significantly influenced by monetary green tax incentives. RQc
H4a: Green building supply is significantly dependent on life cycle cost saving motivations. RQd
H4b: Developers expected rate of return motivations significantly influence green building supply. RQd
H4c: Government policies and green certification motivations significantly influence green building supply. RQd
H4d: Market strategy benefit motivations significantly influence green building supply. RQd
H5a: Green building supply is significantly dependent on monetary green tax incentives. RQd
H5b: Available green skills significantly influence green building supply. RQd
H6:
There are no significant differences in perception between Malaysia and Nigeria consumers and investors on the factors that motivate the demand and supply of green commercial properties. RQe
1.7 SignificanceoftheStudy
13
be due to insufficient investigation to determine why property market participants are not sufficiently committed to green commercial property supply and demand. An investigation of the motivating factors of green commercial buildings in Malaysia and Nigeria could have positive effect on the market and improve their performance status globally. These factors have remained less researched, thus the justification and significance of this study which is considered timely. As a result, the study will be of immense significance in the following ways:
a) The study will reveal and enrich empirical studies on green building in the study areas, by feeding the government and the local policy makers on green property investment with strong empirical data to re-position their market for global competitiveness.
b) Giving the very significant environmental, economic and social benefits that will accrue from this study, professionals such as Estate surveyors and valuers, developers, and Architects as well as government, business enterprises and the public will be more greener in initiatives and investment
c) The dearth of funds and tax incentives has been identified as one of the major reasons why there is inadequate green housing and lack of demand and supply of green buildings. Even the available funds and tax incentives seem not to be properly channelled to the growth of green properties for fear of market uncertainties (Onyike, 2009). It is therefore imperative that models or strategies be developed to justify the importance of green drivers and why funds and tax incentives should be made available to enhance demand and supply of green commercial properties.
d) The study will redirect research interest on the property investment market by both academics and industry-based researchers by providing basic empirical evidences on factors driving the paradigm shift for green investment and practices. It will also serve as a future reference index for further academic work and research.
14
1.8 Scope of the Study
In addition to green commercial properties, green real estate property market consists of residential and industrial, and special purpose properties. While this study recognizes these diverse dimensions as equally important potential areas of green properties that require investigations, it however did not cover these areas. Therefore, the scope of this study is limited to green commercial properties. Green commercial properties or buildings, also known as sustainable or high performance buildings are properties built using environmentally friendly and resource efficient processes and certified by recognized certifiying institutions (Chequt et al, 2013). Kroll (2011) defined green commercial real estate to include properties that integrates water, energy and resource efficiency into commercial real estate planning, design, finance and
construction. This is for the purpose of achieving economic value and benefits as
well as social and environmental benefits (Nurul and Zainul, 2013). By Kats et al, (2003) explanation, the term green commercial property (also called green commer-cial real estate) include sustainable buildings or land intended to generate a profit, either from capital gain or rental income. Though, this study considers this definition as critical to this thesis, however, it considers Kroll (2011) and Chequt et al, (2013) explanations of green commercial properties more useful.
15
In order to achieve this, this study targeted the real estate development team and partcipants who are involve and knowledgeable in green building. So, data collection and unit of analysis of this study were limited to real estate developers, investors, architects, estate surveyors and valuers, builders/contractors and, town planners. Though, for the demand side of this study, the unit of analysis ought to be buyers and users of green commercial buildings (Piyapong et al, 2011; Mohd et al, 2013; Mohamad et al, 2015; Tawfik et al, 2015). That is normal. In any case, what is regularly ignored and not known are the views of the real estate development team on the demand side. Their opinions are likewise essential as they are regularly in direct contact and negotiations with potential purchasers and buyers. In this manner, they could have expert perception and opinion on the motivating demand factors. Moreover, studies have used the opinions of the building team such as developers to examine and investigate residential green building investment (Ibrahim et al, 2014; Yee et al, 2015; Elias and Lin, 2015). It is against this reasoning that this study based the unit of analysis of this study largely on the views of the real estate development team instead of buyers and occupants.
16
1.9 The Study Areas- Malaysia, Nigeria
1.9.1 Geography and Background
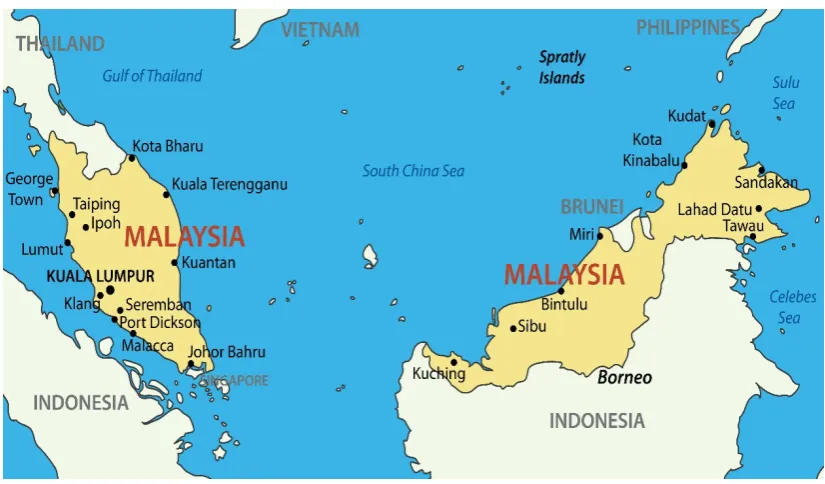
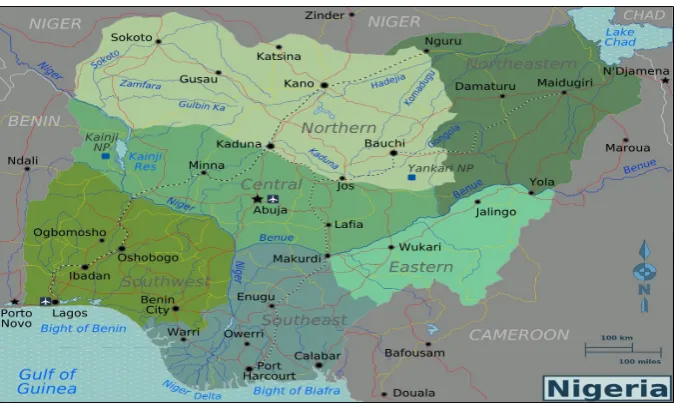
Malaysia latitude and longitude are 2 30’ North scope and 112 30’ East longitude. Malaysia coastlines are in the Southeast Asia. Its total area is 330,000 square kilometres (sq mi) and is consisting of the Mainland and Borneo Island (Dipiazza, 2006). Peninsula Malaysia has an area outskirt with Thailand in the North. In the South, a thoroughfare joins it to the Singapore. Towards the West, over the straits of Malacca lies the Indonesian Island of Sumatra. Nigeria is in West Africa and has a geographic coordinate that shows 10 00’ N North scope and 8 00’ E East longitude with its coastlines laying in the south, on the Gulf of Guinea on the Atlantic Ocean. Nigeria has land outskirt with Benin Republic in the West, Chad and Cameroon in the East, and Niger in the North. Malaysia and Nigeria are in the same tropical zone (Abduliahman et al., 2013). On this base, they share certain similarities in environmental features which could have clear implications for green building. Green building design and construction in Malaysia and Nigeria could be said to be specifically suited for tropical regions. In that capacity green building skills requirements are those appropriate for tropical areas and climates similar to Malaysia and Nigeria.
17
Figure 1.2:Map of Nigeria (Source: https://maps.google.com/)
1.9.2 Economic Structure
Malaysia and Nigeria are capitalist countries, though experts have argued that both countries operate a mixed economy giving government participation in the economy. However, Malaysia and Nigeria operates a free market where their housing and property delivery system is private sector driven. Put differently, Malaysia and Nigeria have adopted comparable components of private sector domianted housing delivery systems (Bawa, 2013). Though, on macroeconomics, Malaysia has more diversified economy with service and manufacturing sectors accounting for 54% and 25% of GDP respectively. Malaysias GDP in 2012, 2013 and 2014 were USD314.4 billion, USD 323.3 billion, and USD 338.1 billion respectively. This, in the same order represents annual GDP growth rate of 4.2%, 5% and 6.6%. The income per capita for 2012, 2013 and 2014 were USD6790.4 USD6997.7 and USD7304.1 correspondingly (World Bank 2016). Nigeria is one of the fastest developing countries in Africa. Service is the largest sector of the economy, accounting for about 50% of total GDP. Agriculture, which was in the past the biggest sector, now weights around 23%. While crude petroleum and natural gas remain export, it constitutes only 11% of total GDP. Nigerias GDP in 2012, 2013 and 2014 were USD461billion USD515 billion, USD568 billion respectively. The annual GDP growth rates for the years were 4.3%, 5.4% and 6.3%. The income per capita was USD3065, USD3319 and USD3567 (World Bank 2016) respectively.
18
Gas (LNG) globally behind Qatar. On the aspect of economic trade and business, Malaysia and Nigeria are nearly the same since whatever is produced in Malaysia, the market exists in Nigeria (Bawa, 2013). Both countries diplomatic ties started since 1965 and both are members of Commonwealth of Nations and Developing-8 (D-8) an Organization for Economic Development Cooperation among eight (8) countries: Bangladesh, Egypt, Indonesia, Iran, Malaysia, Nigeria, Pakistan, and Turkey (Aleyomi and Abu, 2015). Though at present, Malaysia is a non-member country. On the other hand, Malaysia just like Nigeria belong to other bodies that share similar economic and social aims and objectives dedicated towards promoting economic integration, social progress and cultural development in their regions. Malaysia is a member of Association of Southeast Asian Nations (ASEAN) while Nigeria belongs to Economic Community of West African States (ECOWAS). Both bodies have similarities in both social and economic objectives.
In addition, Malaysia like Nigeria has the mission of accomplishing her economic and social programme as envisioned in her policy strategy, vision 2020 agenda of which sustainability in housing is incorporated (Rafikul, 2011; Eneh, 2011). Malaysia economic ties with Nigeria have resulted to training of over 50 Nigerian Youths under the Post Amnesty Capacity Building Programme of Nigerian Federal Government in Malaysia (Adekalu et al, 2013). This ties have equally been extended to the education sector where over 9,000 Nigerian students are studying in various Malaysian Universities (Ministry of Higher Education Malaysia MOHE, 2010; Abdullahi et al, 2014). Some of these students are today professional engineers, architects, estate surveyors and valuers, developers, investors and builders who are involved in green building construction and development.
1.9.3 Political and Governance Structure
19
the powers of the governments, but under terms of the federation, Sabah and Sarawak retain certain constitutional prerogatives (Case, 2001; Gomez, 2007). The executive is led by the Prime Minister and his cabinet members /ministers who are the highest policy making persons in the country (Ahmad et al, 2003; Chin, 2011).
In addition, the judiciary is independent of the executive arm of government with a system based on English common law. As noted earlier, Nigeria operates a three tier-federal structure. However before 1967 there were four entities administered and independent local administrations, namely, East, Midwest, Northern and Western regions, and central government. The national governance in Nigeria, just like Malaysia and many other countries consists of cabinet ministries, the independent agencies and public corporations. A ministry comprises of departments and the number of such varies and depends on the functions for which the ministry is responsible. The cabinet ministries are headed by ministers appointed by the president (Bawa, 2013). On the administrative machinery, Nigeria has three level systems akin to Malaysia Federal, State and Local government. The Federal government is in charge of matters set out in what is known as federal list which comprises defence, transport and education. On the other hand, state governments alone are responsible within their areas for matters set out in the state list, which includes land and religion (Ahmad et al., 2003).
20
1.9.4 Socio-demographic Structure
Malaysia and Nigeria have common socio-cultural background (Abayomi et al, 2014). This common social relationship has been mutually tied that as of today, Malaysia has its High Commission in Abuja while Nigeria has its High Commission in Kuala Lumpur. Both countries are heterogeneous states that are religiously and ethnically plural with three major ethnic groups namely, the Malays, the Chines and the Indians in Malaysia while the Yorubas, the Igbos and the Hausas in Nigeria (Bawa, 2013; Abayomi et al, 2014; Michael and Mohamad, 2015). As argued by Freedman (2006) and Nair (2007) some of what is called races in Malaysia today is large and exemplary multi-ethnic model. However, due to the absence of open and persistent political unrest, it may not be conspicuous (Bawa, 2013). The 1996 population census shows that Malaysia has a total of 21.2 million people. Nevertheless, the World Bank (2008) put Malaysia population at 27 million with about 65% umiputera denoting sons of the soil. This includes of Malays and smaller indigenous groups. Chinese constitute 26% of the population while Indians represent 8% (Weiss, 2007; Bawa, 2013).
On the other hand, Nigeria is the most populous country in Africa. According to World Bank (2011) report, Nigeria population in 2010 is put at 158 million with an average growth rate of 2.4% between 2000- 2010. However, the 2006 population census released by Nigerian National Population Commission (NNPC) pegged the population at 140,003,542 with an annual growth rate of 3.2% (Onyike, 2009). Due to population dynamics, economic growth, legislative designation of new urban centres and increase in densities of rural trading centres, urbanization rates in Malaysia and Nigeria has increased significantly. For example, Malaysia urban population is put at 74.7% of the total population with 4.66% rate of urbanization annual rate of change (2010-2015) (CIA, 2015). However, the World Bank (2015) pegged the rate of urban growth in Malaysia at 4.0% per a year on average. On the other hand, Nigerian urban population is placed at 47.8% of the total population with 4.66% rate of urbanization -annual rate of change (2010-2015) (CIA, 2015). While the World Bank (2015) put the annual urban growth of Nigeria at 4.5%.
21
their counterparts in developed nations. Cross - regional and state comparative studies indicate that green building investment trend is gradually becoming less localized and limited in one part of the geographical region or economic state due to increasing competitive global marketplace occasioned by prevailing concerns on world climate change (McGraw-Hill Construction, 2013). Furthermore, studies show potentially rich empirical and theoretical benefits from knowledge transfer and knowledge sharing in comparative regional studies (Bawa, 2013; Olusegun et al., 2015).
This study suggests a two-way approach of empirical perception from the comparison. Though this study recognizes that geographical, political and economic backgrounds of both countries may create few and diverse paths towards cross-regional knowledge and cooperation in green building market and sustainability. It is however, pertinent to note that cross-regional study of this nature could re-define knowledge in general areas of international green building investment opportunities and knowledge transfer among developers and investors. At a more profound level, it will allow for benchmarking and a paradigm shift from ”push” to ”pull” factors that could refine institutionalized and localized approaches to perception and awareness of green building construction and investment. Against this logic, some comparative and cross-regional studies on housing, perception of professionals on sustainability in building construction, and real estate investment performance and practice between Malaysia and Nigeria have been conducted (Alabi, 2012; Bawa, 2013; Abayomi et al., 2014; Olusegun et al., 2015 see Tables 1.3 and 1.4).
Figure 1.3: Diamond Building, the eight-story Green Building in Putrajaya Malaysia.
22
Figure 1.4: Ultra-modern, LEED certified eco-friendly building in Nigeria (Heritage Place) Lugard Avenue Kingsway Road Ikoyi Lagos (15,736sqM office space)Source: http://heritageplaceikoyi.com/
1.10 Justification of the Study- Why Malaysia and Nigeria?
As noted earlier, studies have shown that real estate property market is localized as investors may pay attention to issues that influence their local market (Berry and McGreal, 2003; Kimmons, 2012). However, recent studies have shown that in many respect there never can be truly local real estate market (Ventolo and Williams 2013). There may be locally occurring transactions (such as within a city or country), but all transactions are affected to a greater extent by the wider market forces within the state, between regions and nations (Ventolo and Williams, 2013). Also, latest study by (Olszewski, 2013) has revealed a strong correlation between different types of real estate markets among different countries. For example, market factors which are uncorrelated in normal times might be strongly correlated in times of eco-nomic distress in many countries (Olszewski, 2013). Furthermore, given the signifi-cant momentum towards increased international economic integration, Geoffrey and Eamonn DArcy (1994) had argued that the real estate market performance and behavior could be viewed as the combined product of various national, re-gional and global economies. However, this is justified on the grounds that demand and supply are the key elements of property market activity (Keogh, 1991).
23
Though, the institutions and constraints particularly the amount of income
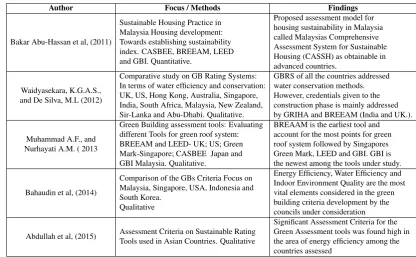
avail-able for property demand and supply by real estate market participants certainly may vary, this differences should not however obscure the regularities in behavior (Malpezzi, 1999). Besides, Doling (1997) and the recent work of Lawson et al, (2009) have argued that all knowledge and disciplines are comparative. Specifically, Lawson et al, (2009) posited that comparative entails research within and across disciplines, states, nations, continents, regions, cities, suburbs and estates. This suggests that comparative studies may be on different scales and for difference purposes. This is mainly significant now that green building is an emerging concept and is be-coming less localized to one part of geographical region due to increasing global marketplace motivated by prevailing concerns on world climate change (McGraw-Hill Construction, 2013; Nurul and Zainul, 2013). Table 1.2 shows some selected cross-regional studies on green building features.
Table 1.2: Selected Cross-Regional Studies on Green Building Features. Source:
Authors work 2016
Author Focus / Methods Findings
Bakar Abu-Hassan et al, (2011)
Sustainable Housing Practice in Malaysia Housing development: Towards establishing sustainability index. CASBEE, BREEAM, LEED and GBI. Quantitative.
Proposed assessment model for housing sustainability in Malaysia called Malaysias Comprehensive Assessment System for Sustainable Housing (CASSH) as obtainable in advanced countries.
Waidyasekara, K.G.A.S., and De Silva, M.L (2012)
Comparative study on GB Rating Systems: In terms of water efficiency and conservation: UK, US, Hong Kong, Australia, Singapore, India, South Africa, Malaysia, New Zealand, Sir-Lanka and Abu-Dhabi. Qualitative.
GBRS of all the countries addressed water conservation methods. However, credentials given to the construction phase is mainly addressed by GRIHA and BREEAM (India and UK.).
Muhammad A.F., and Nurhayati A.M. ( 2013
Green Building assessment tools: Evaluating different Tools for green roof system: BREEAM and LEED- UK; US; Green Mark-Singapore; CASBEE Japan and GBI Malaysia. Qualitative.
BREAAM is the earliest tool and account for the most points for green roof system followed by Singapores Green Mark, LEED and GBI. GBI is the newest among the tools under study.
Bahaudin et al, (2014)
Comparison of the GBs Criteria Focus on Malaysia, Singapore, USA, Indonesia and South Korea.
Qualitative
Energy Efficiency, Water Efficiency and Indoor Environment Quality are the most vital elements considered in the green building criteria development by the councils under consideration
Abdullah et al, (2015) Assessment Criteria on Sustainable Rating Tools used in Asian Countries. Qualitative
Significant Assessment Criteria for the Green Assessment tools was found high in the area of energy efficiency among the countries assessed
24
markets. It equally suggest that Malaysia and Nigeria property market behaviour maynot differ much. Furtherto this, isthat internalcommercialreal estateproperty market model of any of the two countries could easily be adopted over to the other market. For example, the Central Bank of Nigeria CBN between 2010 and 2011 adopted the Malaysian Cagamas model to rescue her financialandpropertymarket fromtotalcollapseduringtheglobalfinancialcrisisof2007and2008.ThroughAsset Management Corporation of Nigeria (AMCON) the distress property development companiesand financialinstitutionsassetsandpropertieswereacquired,theircapital basere-shoredwithfundsandrepackagedforsaletothepublic(Olusegunetal,2015; Onuohaetal,2016).
On green building, though Malaysia has a relatively improved green commercialpropertymarketaswellashigh demandandsupplyofgreencommercial properties, the factors that drive the market participants remain similar and comparable withNigeria. Forexample, as reported byChequt et al, (2013) irrespec-tive of geographical factors, one of the direct economic benefitsofgreen commer-cial property demand in any real estate property market is the quest for energy effi-ciency and sustainability. Also, studies from Malaysia and Nigeria have shown that energy efficiency and C02 reduction are among the factors that drive the demand for green commercial properties (Alabi, 2012; Mohamad et al, 2015; Isa et al, 2015; Nduka and Ogunsanmi, 2015). Furthermore, studies have revealed that factors such as building certification facilitates the inter-mediation process be-tween building developers, investors and buyers in the context of what constitutes quality or energy efficientbuildingsinanycountry(Chequtetal,2013;Aliagahetal, 2013a).
25
Regardless of the similarities, Malaysia and Nigeria are not in the same levelof green building investment, development and implementation. For example, at the moment, a total of 402 green commercial buildings have applied for certification in Malaysia under the non -residential new construction (NRNC) category, only 31havesecured their final certification.(Green Building Index, 2016) while in Nigeria only 1 green commercial building has received final certification (Gray, 2015). As indicated before, studies show that in Malaysia about 62.5% of green office buildings have been completed and occupied while 12.5% are under construction (Isa et al, 2015). Besides, the Dual Citizen LLC (2014) study on the performance of countries in green economy ranked Malaysia higher than Nigeria. Thus, this study is based on the premise that this differences could affect the orientations and perception of the market participants on factors that drive green commercialproperties.
Ontheotherhand,commercialpropertysectorisakeysectorinthemitigation of harmful environmental impacts in both Malaysia and Nigeria but has remained poorly researched. Local literature on green commercial building investment in the studyareasareinadequatewithlittleornoempiricalsupport(Isaetal,2013). Assuch most literature for this study were drawn from external publications. However, as observedearlier,existingstudiesongreenbuildingseemtofocusmoreongovernment and institutional green buildings (Yahya et al, 2013; Shahamir and Zakara, 2014), Green Infrastructure (MacFarlane et al, 2005; Ian, 2010), energy efficiency (NgBan and Zainal, 2013), green technology (Popp et al, 2011), benefits of green buildings (Katsetal,2003;AlevandBaabak,2010)andresidentialgreenbuildings(Christopher, 2007; Mohamadet al, 2015). Investment ingreen buildingrequires thedemand side andsupplyside.
26
Table 1.3: Related Studies on Green Building and Properties between Malaysia and Nigeria [1]Source: Authors work 2016
S/N Author / Year &
Type of Study Research Title/Focus Methodology Findings
1
Bawa, C. A. (2013) PhD dissertation Department of
Estate Management University of Malaya
Low-income Housing Policy: A Comparative Study of Malaysia and Nigeria
Quantitative and Qualitative Approach
In Nigeria greater majority of low income group LIG are unable to acquire housing while Malaysian context shows an inclusive trajectory in housing its LIG.,Housing allocation goes to target beneficiaries of LIG in Malaysia while in Nigeria majority of low-cost beneficiaries are excluded in LIG.,In Malaysia renters are on the increase. About 48% are renters. In Nigeria more than 50% and 48% are renters and owner-occupiers respectively, 60% of housing owners/occupiers secure housing units from private developers while more than 55% obtain housing units from private developers. Housing finance is more available to LIG in Malaysia than in Nigeria. Institutional structures and agency responses play an important role in the shaping and determining outc


![Table 1.3: Related Studies on Green Building and Properties between Malaysia andNigeria [1] Source: Authors work 2016](https://thumb-us.123doks.com/thumbv2/123dok_us/1179445.1148299/52.595.115.525.99.834/related-studies-building-properties-malaysia-andnigeria-source-authors.webp)
![Table 1.4: Related Studies on Green Building and Properties between Malaysia andNigeria [2] Source: Authors work 2016](https://thumb-us.123doks.com/thumbv2/123dok_us/1179445.1148299/53.595.116.526.195.678/related-studies-building-properties-malaysia-andnigeria-source-authors.webp)
