University of Windsor University of Windsor
Scholarship at UWindsor
Scholarship at UWindsor
Electronic Theses and Dissertations Theses, Dissertations, and Major Papers
2013
Hardware Accelerated Text Display
Hardware Accelerated Text Display
Soheil Servati Beiragh
University of Windsor
Follow this and additional works at: https://scholar.uwindsor.ca/etd
Recommended Citation Recommended Citation
Servati Beiragh, Soheil, "Hardware Accelerated Text Display" (2013). Electronic Theses and Dissertations. 4886.
https://scholar.uwindsor.ca/etd/4886
This online database contains the full-text of PhD dissertations and Masters’ theses of University of Windsor students from 1954 forward. These documents are made available for personal study and research purposes only, in accordance with the Canadian Copyright Act and the Creative Commons license—CC BY-NC-ND (Attribution, Non-Commercial, No Derivative Works). Under this license, works must always be attributed to the copyright holder (original author), cannot be used for any commercial purposes, and may not be altered. Any other use would require the permission of the copyright holder. Students may inquire about withdrawing their dissertation and/or thesis from this database. For additional inquiries, please contact the repository administrator via email
Hardware Accelerated Text Display
By
Soheil Servati Beiragh
A Dissertation
Submitted to the Faculty of Graduate Studies through
The Department of Electrical and Computer Engineering in Partial Fulfillment of the Requirements for the Degree of Doctor of Philosophy at the
University of Windsor
Windsor, Ontario, Canada
© 2013 Soheil Servati Beiragh
All Rights Reserved. No Part of this document may be reproduced, stored or otherwise
retained in a retrieval system or transmitted in any form, on any medium by any means
Hardware Accelerated Text Display
By
Soheil Servati Beiragh
APPROVED BY:
______________________________________________ Dr. N. Dimopoulos, External Examiner
University of Victoria
______________________________________________ Dr. I. Ahmad
Computer Science
______________________________________________ Dr. M. Ahmadi
Electrical and Computer Engineering
______________________________________________ Dr. R. Rashidzadeh
Electrical and Computer Engineering
______________________________________________ Dr. R. Muscedere, Advisor
Electrical and Computer Engineering
iv
Declaration of Originality
I hereby certify that I am the sole author of this dissertation and that no part of this
dissertation has been published or submitted for publication.
I certify that, to the best of my knowledge, my dissertation does not infringe upon any
ones copyright nor violate any proprietary rights and that any ideas, techniques,
quotations, or any other material from the work of other people included in my
dissertation, published or otherwise, are fully acknowledged in accordance with the
standard referencing practices. Furthermore, to the extent that I have included
copyrighted material that surpasses the bounds of fair dealing within the meaning of the
Canada Copyright Act, I certify that I have obtained a written permission from the
copyright owner(s) to include such material(s) in my dissertation and have included
copies of such copyright clearances to my appendix.
I declare that this is a true copy of my dissertation, including any final revisions, as
approved by my dissertation committee and the Graduate Studies office, and that this
dissertation has not been submitted for a higher degree to any other University or
v
Abstract
Web browsers and e-book are some of the most dominant applications on mobile devices
today. They spend a significant amount of time handling text in these documents. Based
on the experimental results from different commercial web browsers, the majority of the
time spent to display text is dedicated to layout design and painting the bitmaps of the
character glyphs on the screen; the time needed to rasterize the bitmaps of these glyphs is
negligible. Many efforts have been made in software to improve the performance of text
layout and display and very few are trying to come up with parallel processing schemes
for System-On-Chip (SoC) designs to better handle this graphic processing. This work
introduces a new novel hardware-software hybrid algorithm which performs the layout
design of text and displays it faster by using a small piece of hardware which can easily
be added to the SoCs of today’s mobile devices. This work also introduces a novel
method for applying kerning to layout design process. The performance of the algorithms
are compared to WebKit, the most widely used web rendering framework, and has
resulted in a 29X and 192X performance increases in layout design when kerning is both
vi To My Selfless Mother,
My Kind Sister,
vii
Acknowledgements
I would like to thank my supervisor, Dr. Roberto Muscedere for his continued help and
support during my entire time as a graduate student. I am very grateful for all that I have
learned from him and his patience toward me.
Also I would like to thank my committee members, Dr. N. Dimopoulos, Dr. I. Ahmad,
Dr. M. Ahmadi and Dr. R. Rashidzadeh for attending my seminars and their constructive
comments.
A very special thank to Dr. M. Ahmadi for supporting me in every step of my life as
graduate student.
In addition, I would also like to thank my parents and my kind sister for their life time
viii
Table of Contents
Declaration of Originality ... iv
Abstract ... v
Dedication ... viii
Acknowledgements ... vii
List of Tables ... xiii
List of Figures ... xiv
List of Appendices ... xvi
List of Abbreviations ... xvii
Chapter 1: Introduction ... 1
1.1 Motivation ... 1
1.2 Evolution of the Text Display Process ... 5
1.3 Dissertation Objective ... 7
1.4 Dissertation Organization ... 8
Chapter 2: Background ... 9
2.1 Proportional Text Display Process ... 9
2.1.1 Glyph Handling ... 10
ix
2.1.3 Kerning ... 12
2.1.4 Layout ... 18
2.1.5 Painting the Bitmap ... 19
2.1.6 Transfer to the Frame Buffer ... 20
2.2 Other Research in Literature... 20
2.3 Methods to Improve Mobile Performance... 22
2.3.1 Simplify Content prior to Processing ... 23
2.3.2 Optimize the rendering engine for limited scenarios ... 23
2.3.3 Optimized algorithm or technique in the software rendering engine ... 24
2.4 Summary ... 24
Chapter 3: Analysis ... 26
3.1 Introduction ... 26
3.2 Initial Testing and Platform Selection ... 26
3.3 Hardware Platform Selection... 29
3.3.1 Method of Measure ... 33
3.4 Basis of Analysis and Comparison (WebKit) ... 34
3.4.1 Internals of WebKit ... 36
3.4.2 WebKit on Microblaze ... 39
x
3.5 Summary ... 42
Chapter 4: Design and Development ... 43
4.1 Introduction ... 43
4.2 Software Only Implementation ... 43
4.2.1 Glyph Processing ... 44
4.2.2 Layout Design... 45
4.2.3 Placement... 48
4.2.4 Transfer to the Frame Buffer ... 50
4.2.5 Performance of the Software Only Implementation ... 52
4.3 Hardware Design ... 52
4.3.1 Memory Interfacing and Hardware Control ... 53
4.3.2 Hardware-Functions ... 57
4.3.3 Application Programming Interface ... 60
4.4 Summary ... 62
Chapter 5: Results ... 63
5.1 Introduction ... 63
5.2 Raw Engine Performance ... 63
5.3 WebKit Engine Performance ... 65
xi
5.6 Hardware Resources Required ... 70
5.5 Power Savings ... 71
5.6 Summary ... 72
Chapter 6: Conclusion... 74
6.1 Conclusion ... 74
6.2 Contributions ... 75
6.3 Recommendations for Future Work ... 76
References ... 77
Appendix A: System Design Procedure ... 80
A.1 Base System Builder ... 80
A.2 Convert ML505 Design to XUPV5 ... 83
A.3 TFT Display Controller ... 85
A.4 Add Custom IP Core ... 89
A.5 Software Platform Settings ... 95
A.6 Compiling Petalinux Image ... 97
Appendix B: System Design Codes ... 101
B.1 SYSTEM.UCF ... 101
B.2 SYSTEM.MHS ... 106
xii
Appendix C: Text Display Engine IP Core... 116
C.1 diplaymem2.vhd... 116
C.2 user_logic.vhd ... 123
Appendix D: Sample API Code ... 141
xiii
List of Tables
Table 3-1: Timing Comparison of Developed Software Engine between Intel and ARM
Processors ... 28
Table 3-2: Summary of components of XUPV5-LX110T Evaluation Board ... 31
Table 3-3: Glyph Rasterizing and Layout Design in WebKit for a passage of text with one million characters ... 40
Table 4-1: BUS Interfaces available on XUPV5 ... 56
Table 5-1: Raw software timing results with no kerning ... 64
Table 5-2: Raw software hardware hybrid timing results with no kerning ... 64
Table 5-3: Performance of proposed engine with and without Visual Kerning for a 2million character novel. ... 65
Table 5-4: Performance comparison between proposed engine and WebKit in Layout Design ... 66
Table 5-5: A timing comparison for Bitmap Placement Phase between WebKit and proposed engine ... 67
xiv
List of Figures
Figure 1-1: Samsung ARM Cortex A15 Exynos®5 System on Chip [3] ... 4
Figure 2-1 Glyph Metrics... 11
Figure 2-2: Comparing the effect of kerning on the placement of characters ... 14
Figure 2-3: Effect of Kerning on Readability. Part (a) is output of Microsoft Word without Kerning and Part (b) is output based on the proposed method. ... 14
Figure 2-4: Visual Kerning Calculation ... 16
Figure 2-5: Measured distance between bitmap and bounding box edges ... 18
Figure 2-6: The average time spent for each step of the Text Display Process ... 22
Figure 3-1: Beagle Board [22] ... 27
Figure 3-2: XUPV5-LX110T Evaluation Board. Image Copyright Xilinx© ... 31
Figure 3-3: High level structure of WebKit text rendering engine. ... 37
Figure 4-1: Text Display Process ... 44
Figure 4-2: Layers of a Linux based Memory in an Embedded System ... 54
Figure 4-3: Multi Port Memory Controller Module and Interface options for XUPV5 ... 55
Figure 4-4: Block Diagram of the Final Hardware System ... 59
Figure 5-1: Effect of Burst Access... 73
Figure A-1: Peripherals and their parameters for the base system ... 82
Figure A-2: How to configure MPMC Step 1 ... 91
Figure A-3: How to configure MPMC Step 2 ... 92
xv
Figure A-5: How to configure MPMC Step 4 ... 93
Figure A-6: How to configure MPMC Step 5 ... 93
Figure A-7: How to connect ports of the developed peripheral ... 94
Figure A-8: IO Mapped Memory Addresses of the system ... 95
Figure A-9: How to configure Petalinux ... 96
xvi
List of Appendices
Appendix A: System Design Procedure ... 80
Appendix B: System Design Codes ... 101
Appendix C: Text Display Engine IP Core... 116
xvii
List of Abbreviations
API Application Programming Interface CPU Central Processing Unit
DDR-RAM Double Data Rate Random Access Memory DFB Direct Frame Buffer
DMA Direct Memory Access DOM Document Object Model DTS Device Tree Source
EDK Embedded Development Kit
FB Frame Buffer
FPGA Field Programmable Gate Array GPU Graphic Processing Unit
HDMI High Definition Multimedia Interface IO Input / Output
IP-Core Intellectual Property Core
JPEG Joint Photographic Experts Group LCD Liquid Crystal Display
LPDDR Low Power-DDR LTE Long Term Evolution MMU Memory Management Unit MPEG Moving Picture Experts Group MPMC Multi-Port Memory Controller NPI Native Port Interface
OS Operating System PC Personal Computer PDA Personal Digital Assistant PDF Portable Document Format PLB Processor Local Bus
RAM Random Access Memory SoC System on Chip
TFT Thin Film Transistor TTF True Type Font ULP Ultra Low Power
1
Chapter 1
Introduction
1.1 Motivation
Many different types of multimedia content are available today on computer systems
but still text and reading materials remained as the dominant content, whether on
commercial desktop PCs or small handheld devices [1]. Despite the dominance of text
content, a significant amount of effort has been made to enhance the user experience with
3D contents and media streaming [2] but very little work has taken place in the area of
text rendering and display to make the text rendering engines faster.
Since the evolution of the personal computers, CPUs have become faster and more
capable but still users are not satisfied with their experience. A good example of this
situation is what one can experience with new cutting edge tablet computers. A high end
tablet can easily stream a Full High Definition 1080p video with no lag and even send it
out through an HDMI port to a large screen TV, but if you try to scroll through a long
text based webpage or an E-Book, the device cannot keep up with your page flipping
speed and it will start showing blank pages until you stop and let it catch up.
It is clear to any person familiar with computing systems that video and image handling
1. Introduction
2
the conclusion that faster CPUs with more cores might not be very useful in fulfilling
some basic tasks. The reason behind such a short coming is that although the text
rendering process is fairly simple, it involves many none-cachable memory accesses and
poorly predicted conditional branches, which makes it a time consuming task. In most of
today devices, there are several co-processing units to help the main processor when
dealing with 3D contents or media streaming, but there is no special unit to help the CPU
with tasks like text rendering because they are considered easy algorithms which should
be handled by the CPU on its own.
All handheld devices have restrictions in power and physical size. As the technology
advances, companies build Cellphones, Tablets or E-Readers with higher speed CPUs,
thinner sizes while trying to maintain longer lasting batteries. When Multi Core CPUs
where introduced to the mobile industry, the main issue that came up was the power
consumption. Add to this their higher and higher operating frequencies as well as
peripherals such as high resolution/luminance displays, and high speed LTE Mobile
access, will further increase the challenges for battery designers. Although companies are
all trying to build more efficient displays, and radios, the demand for power keeps
increasing.
As anyone might have experienced, although the technology on cellphones has
advanced during the past few years, they have become far more demanding on power.
1. Introduction
3
of transistors, and potentially double the power consumption, consumers don’t
necessarily experience double the response times from their devices. This is generally
due to the fact that most of the applications available don’t even take advantage of the
multicore system. It is a difficult and complicated task to develop applications that use
multi-threading or can run on multiple cores in parallel.
To mitigate some of the high power requirements, today’s devices implement different
policies for power management to reduce the clock speed when it is not required, but still
as soon as the clock speed drops the user experiences longer delays from the system and
most users prefer to keep charging their devices instead of operating at lower clock
speeds.
This dilemma forces manufacturers to search for other solutions than simply using
higher clocked CPUs. A good example is the media co-processors (audio and video
decoding) that exist in most of the SoCs in mobile devices. Such a unit works in parallel
with the CPU and requires much less power which improves the user experience by
letting the CPU perform more useful tasks.
Many of today’s low power computing devices like E-Readers, Tablets, Cellphones and
even some of the newer Laptops use SoCs in their architectures and advertised as being
1. Introduction
4
Figure 1-1: Samsung ARM Cortex A15 Exynos®5 System on Chip [3]
An SoC is a processing unit which houses the main CPU of the computer and several
other co-processors and peripherals in a single silicon die. This design analogy is aimed
to build small, low power, and high speed computer systems. In most of today’s
commercial SoCs, a CPU is embedded alongside a number of GPUs (i.e. ULP GeForce
cores in the NVIDIA Tegra 4), a video acceleration unit, cache memory, and some radio
and DSP controllers. The combination of GPUs and a cache memory makes the user
experience much smoother for Multimedia contents and 3D graphics. The above Figure
1-1 shows SAMSUNG Exynos 5 which is an example of the latest SoCs being used in
1. Introduction
5
1.2 Evolution of the Text Display Process
The text mode in the early generations of IBM Personal Computer had the advantage of
lower memory consumption and very fast screen updates. Text screens were fixed sizes
(either 80 or 132 columns with 25 or more rows) and dedicated text display hardware
which read the contents of these small arrays which contained the ASCII value of the text
to be shown. The hardware would cross reference the desired character to a pre-rendered
mono-spaced glyph and showed the image on the screen. The hardware was able to
update the display such that it met the vertical refresh time of the desired resolution.
These first generation display systems of personal computers did not have the rich
graphics which we are accustomed to today and because of that, there were very limited
choices for fonts and other graphical decorations. This original form of text mode can
still be seen today as it is enabled during the PCs power on stage. Changes to the system
configuration are done in this mode as the firmware of the PC is quite small compared to
the OSs which they eventually boot into. As video hardware improved, developers soon
started using the full graphics options which allowed them to create custom environments
and proportional spaced fonts which replicated the output of high quality laser printers.
However the wide range of hardware and vendors made it difficult for the software
developers to use as each device had to be programmed separately. There was little
support for all the custom resolutions however a standard known as the Video Electronics
1. Introduction
6
With the advent of Microsoft Windows, software drivers provided by these hardware
manufacturers eliminated this programming problem and offered software developers an
API interface independent of the hardware that was easy to work with. A wide range of
vector based fonts were becoming available which generated very rich documents unlike
pre-rasterized fonts of the past. The demands of these developers were quickly squashed
as these software APIs were slow due to the amount of code required to manage the
“windows” as well as operate the displays. Hardware designers soon started adding in
acceleration which improved the user experience; operations such as fast fills and bit
blitters for scrolling the display quickly. Over time, more advanced features have been
added as transistors have become smaller and fabrication processes have become faster.
Today’s PC entry level graphics hardware can perform media acceleration as well as high
quality 3D images. The improvement in CPU performance is the sole reason software
developers have the ability to further enrich our computer interfaces with endless
eye-popping effects. Text display to this day however has seen no benefit of hardware
acceleration. Today’s high resolution displays with very high dots-per-inch (DPI)
demand significantly more resources to render text compare to the lower resolution
displays of the past. Processor and network speeds can easily access and decode
information, however the time to display said information is slow and often leads to
delays which the user quickly notices. As this software is ported to mobile devices where
computing and memory resources are much more restrictive, the delays are far more
1. Introduction
7
The process of displaying proportional text is not algorithmically complicated however
it is memory intensive as it manipulates large amounts of arbitrary, none-cachable data
with many non-predictable branches.
1.3 Dissertation Objective
As can be seen in the example shown in Figure 1-1, modern mobile processing units are
built as SoC. This architecture makes it possible to add co-processing units that can have
interaction with the main processor with higher speed buses which reduce any loss in
time or latency. These modern SoCs all contain media decoding hardware units, and
camera image processors, as well as 2D and 3D graphic accelerators. The addition of any
other components should not be challenging to the designers.
This dissertation will present a novel hardware/software hybrid engine which can
accelerate the text display on embedded systems with restricted resources. The design is
intended to be added as a co-processor to the existing SoC environment.
This dissertation performs an in depth investigation on the text display process to
determine the bottle necks and short comings of algorithms and methods in use by
consumer electronics software developers. These results are used to guide the
development of a novel solution to make the user experience more smooth and fluid by
1. Introduction
8
In order to validate the effectiveness of the proposed method, the developer of this
work will compare the performance of the final product with a standard software engine
that is being used in today’s consumer electronics devices.
1.4 Dissertation Organization
Following this chapter, this dissertation will continue with a description of the text
display process in Chapter 2 as well as literature search. Chapter 3 will perform a series
of analyses of existing software engines to determine the performance bottlenecks; it will
also cover the hardware platforms used for this evaluation. In chapter 4 briefly details the
hardware development process and some of the challenges; a full explanation is found in
the appendices. Chapter 5 shows the performance comparison of the proposed engine and
the software competitors. Lastly chapter 6 will contain the conclusion and
9
Chapter 2
Background
This chapter will thoroughly examine the process of displaying proportional text in a
modern computer graphics environment. Non-proportional fonts and the legacy “text
mode” operation will not be discussed any further as the main focus of this dissertation is
on text display in modern GUIs.
Additionally, other research literature is reviewed which suggests text placement time
could be improved.
2.1 Proportional Text Display Process
The text display process is normally consisted of few separate tasks:
- Glyph Handling (Extracting character glyphs metrics and rasterization),
- Process any special feature like kerning distances or other decorations,
- Plan the layout of a text passage based on a text box or screen size,
- Paint the bitmap of the text passage by copying the individual rasterized glyphs to
a surface bitmap,
2. Background
10
2.1.1 Glyph Handling
The first step in any software that displays proportional text is to process the font file
that is used for the text object. A PDF reader or a web browser, for example, first looks at
the font name specified in the source document file and reads the applicable font file
(usually on a local disk). Different fonts are part of different font families and the
software decides which font file to use based on the family of the font mentioned in the
source document. It is sometimes the case that the font needed is not present, so software
is given translation tables to select the most appropriate font. This may result in poor
document rendering so PDF documents may contain embedded fonts and similarly web
pages can contain embedded fonts known as web fonts [5]. The most common used type
of font files today are either True Type Font (.TTF) or Open Type Font (.OTF, a superset
of TTF) which are supported in almost all computer operating systems. Software to
decode TTF and OTF is freely available, however some of the algorithms are patented,
but work arounds have been developed which avoid the issue [6] [7].
Based on which operating system or rendering engine is being used, a font processing
library will be called to deal with extracting data from the font file. In almost all
GNU/Linux variant OSs the FreeType library is being used to process all font files
including the legacy pre-rendered bitmaps. Microsoft Windows has a native TTF and
OTF engine although FreeType has been ported and is used by many packages to
2. Background
11
A font file basically consists of a number of tables containing bitmap or vector data of
characters, their metrics (properties such as height and width of each glyph), as well as
other information pertaining to kerning and aliasing. A font processing library like
FreeType reads this tabulated data from the font file and, based on the size requested by
the calling software or OS, rasterizes the bitmaps of characters and calculates the metrics
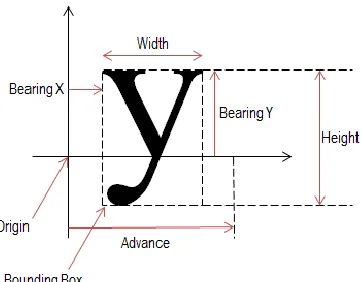
and returns them to a text rendering engine through a series of data structures. Figure 2-1
shows the glyph metrics extracted by WebKit from a font file.
Figure 2-1 Glyph Metrics
A font processing library like FreeType can rasterize bitmaps of glyphs based on the
size and aliasing option requested by rendering engine. This work does not consider the
bitmap rasterizing and font file processing as it will be shown to consume very little CPU
time. The scope of this work is to introduce a solution for faster and more efficient text
2. Background
12
It is important to note that almost all rendering engines use some kind of caching
mechanism for character bitmaps so that they can process text objects faster and not
waste time and resources to process the font file repeatedly. FreeType itself does not
offer a high level caching mechanism, whereas libraries (i.e. Pango) use FreeType for
rendering and uses its own caching mechanism.
2.1.2 Aliasing
With the advancements in display technology for both higher resolutions and varying
depths of illumination, traditional text display of black and white glyphs generated very
high contrast images which affected readability. The solution to this was to smooth the
edges of the text by blending the background colour with the foreground text [8] [9]. The
result is known as text aliasing [10] [11]. The concept of aliasing is not new, however
Microsoft developed a method known as cleartype [12] which exploits the nature of
liquid crystal displays (LCD) so that they can further improve the smoothing over
traditional text aliasing. Due to patents on cleartype, this will not be discussed here.
FreeType offers basic text aliasing which we use in the resulting bitmaps of this work.
2.1.3 Kerning
The next step in the text display process is to calculate and apply any special features
2. Background
13
decorations (underline, shadows, strike-thrus, etc.), however some are more important in
the readability experience of user.
OS developers and application designers consider a number of restrictions for the users
which ultimately makes the performance of their software better. E-Book readers
generally only support certain types of fonts and certain sizes for the text; which
eliminates the need for vector based font support. Although advertised as powerful
processing units that can handle even more tasks than simply reading books, E-Book
readers suffer from large delays when the user changes the size of the text or the font.
Kerning, an important factor to improve readability of displayed text [13], is an
example of one of the features that are ignored in text rendering. Kerning, by definition,
is the process of adjusting the spacing between characters in a word or a phrase to
achieve a more readable result [14]. The designed rendering engine of this work has the
ability to handle kerning without any significant performance loss comparing to the
existing software based rendering engines.
The following example shows how kerning can affect the spacing between the two
2. Background
14
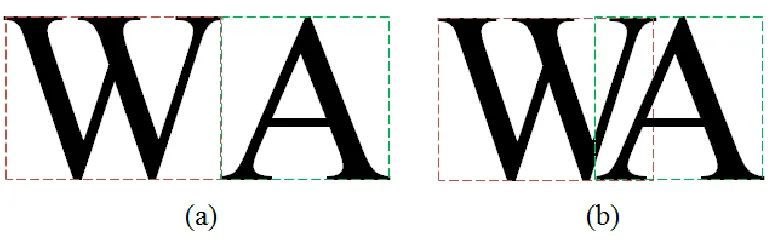
Figure 2-2: Comparing the effect of kerning on the placement of characters
In Figure 2-2(a) W and A are placed with no kerning applied, which means the
bounding box of character A started immediately after the end of the bounding box of W.
In (b) the bounding box of A has overlapped with bounding box of W since the A can be
pushed closer to W. The importance of kerning arises when we have a situation like W
and A in a word. The words WAKE and Wake are shown with and without kerning. This
situation happens for many other combinations of letters.
Figure 2-3: Effect of Kerning on Readability. Part (a) is output of Microsoft Word without Kerning and Part (b)
2. Background
15
In the first set, the letter W looks to be disconnected from the word. This will lead to
lower readability of the text. With kerning the second set shows words that feel more
connected and easier to read.
There have been some efforts from software developers and font designers to come up
with a kerning algorithm to make the displayed text more pleasant to read [15] [16].
These methods are mostly based on mathematical equations, and geometrical
relationships of individual glyph curves. The TTF and OTF font files have the ability to
provide kerning through the use of tables (described as combinations of pairs of
characters), however the implementation is poor when using large font sizes. In most
cases the data isn’t even provided at all. As one might have experienced, even with
famous commercial text editing applications like Microsoft Word, none of these methods
have made a significant difference in the appearance of text and especially for large sized
texts where the situation can be very drastic.
Another approach to kerning is to use visual inspection; schemes similar to what
humans do in hand writing. For example, we see that we can squeeze W and A more
because their shapes allow us to without overlapping them onto each other.
The same approach can be used in by a computer by looking at the bitmaps of each
characters and how close they can be placed on the screen beside each other. This method
2. Background
16
least amount of spacing such that they won’t overlap. We call this method “visual
kerning”.
Figure 2-4: Visual Kerning Calculation
In order to make the visual kerning more appealing, one must take into consideration
the fact the pixels at the edges of most characters don’t have the full luminance due to
aliasing; we cell these sub pixels. If the minimum acceptable distance between two
characters be considered as one pixel, there is difference in appearance of two pixels that
are fully illuminated and separated by one empty pixel and other two that are partially
illuminated and again separated by one empty pixel. Kerning does not have to consider
sub pixels, however the results are far better but with the cost of more resources as it
requires going through each of the bitmaps row by row and calculating the kerning
2. Background
17
The author of this work has implemented both scenarios in the software version but in
the final hardware version does not take sub pixels in to consideration so that the final
design is simpler.
The additional overhead of this method comes from two sets of calculations being
added to the text display process. As noted before, FreeType extracts the properties of
characters, the metrics, from the font file. Figure 2-1 shows some of these properties in
relation to the glyph.
The width of each glyph is considered to be the width of the bounding box of the
character bitmap. Also for many cases the advance (the horizontal increment to the next
character) is either equal or larger than the width. As shown in Figure 2-2, in many
occasions, the characters can be pushed even closer to each other than the suggested
advancement. Therefore the information provided by the font renderer is not necessarily
accurate when determining the kerning distance between a pair of characters.
In order to accurately measure the visual kerning distance between any pairs of
characters, first the proposed engine needs to generate two more sets of data from the
bitmaps of characters: The actual distance between the glyph bitmap and the bounding
box for each row on the right and the left. Once two characters need to be placed, these
measurements are compared on a row by row basis to determine how closely the bitmaps
2. Background
18
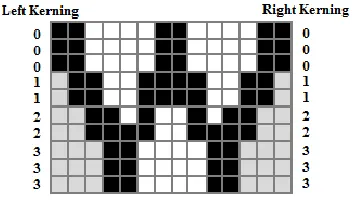
Figure 2-5: Measured distance between bitmap and bounding box edges
It is possible to cache the kerning distances for different character pairs, but this may
not be a good choice since so many possible combinations can exist due to the number of
characters that exist in font files today. Unicode offers up to 32-bits to reference a
character; the goal being to generate single font files for all languages. Any use of
caching would require strict frequency rules and memory management; a task for
software, not hardware.
One of the advantages of the proposed hardware-software hybrid text display engine is
to make it possible to implement features like visual kerning in a way that the resulting
experience is still faster than traditional software methods.
2.1.4 Layout
After the necessary character bitmaps are extracted from the font file and feature
calculations are performed, the text rendering engine starts the layout design process for
2. Background
19
Text layout is not a complicated task for CPU but involves many memory access,
additions, and comparisons. The software keeps adding the width of characters until it
reaches the end of the available width of the screen and goes to the next line. The
computer considers the alignment (e.g. left, right, center, justified) and calculates where
each line should be started on the screen.
This process seems to be a simple task for high speed CPUs, but because of the degree
of software abstraction today, it can easily become a time consuming task. The kerning
and layout calculation is actually the process of determining the individual characters
destination address in RAM.
This algorithm must also determine the height of the line for each row based on the
height of each of the characters and uses it in the placement phase to calculate the final
size of the bitmap for the desired text.
2.1.5 Painting the Bitmap
After the layout design step, the rendering engine will perform the placement by
copying bitmaps of characters to calculated places in the rendering surface. This process
involves reading bitmaps of letters pixel by pixel from an address in RAM and writing
them into another address in RAM. Although it is simple algorithmically, the process
2. Background
20
the large amount of data being copied. Furthermore, the looping strategy is short and
prone to poor branch prediction causing many pipeline flushes.
2.1.6 Transfer to the Frame Buffer
Once the painting on the surface is complete, the engine passes the surface, via some
method, to a frame buffer. This method is based on the computer system being used.
Modern GPUs, for example, will use this surface along with others and composite them
together by either simple overlays or possibly using more elaborate transparencies; this is
done by hardware. The process of transferring the surface can be impeded by restrictions
and limitations of the operating. Frame buffer memory space is considered a privileged
area and a “driver” is necessary to guarantee simultaneous access is controlled.
The proposed design uses direct frame buffer access to place the surfaces directly on
the display screen. This decision is valid as the memory space in most embedded devices
is shared between the main CPU and GPU. This method guarantees the maximum
transfer speed from surface to frame buffer which is normally done via software using
basic memory move opcodes.
2.2 Other Research in Literature
The 2D hardware in mobile SoCs has traditionally been used by the user interface for
2. Background
21
use the capabilities of the GPUs to perform image compositing as well as processing of
vertex graphics [17]. In fact most desktop web browsers today have some form of GPU
acceleration (usually compositing) [18]. It is reasonable to assume that this desktop code
will migrate into the mobile devices in time.
The process of displaying normal text is considered as a 2D graphics operation. All
aspects of this task are being done solely by the CPU. One of the major users of text
display engine in modern computer devices are Web Browsers. All major Web Browsers
have their own graphic rendering engine that reads the DOM tree (Document Object
Model) of a web page, renders the page, and paints it to the surface to be displayed on the
screen. Decoding different embedded contents such as images or interactive Flash are
performed through external libraries or plugins. The rendering engine of a web browser
does the layout design of the page and also renders the text.
Benchmarking of Microsoft Internet Explorer [19] and Apple Safari [20] shows that
anywhere from 40-70% of the time spent by the application to display the web page is
dedicated to calculating the layout design. Multimedia elements like Flash contents or
images are not the main concern in layout design. Text objects are the main bottleneck of
layout calculations. In the process of displaying text, each glyph will be rasterized to a
bitmap image which are much smaller in size in comparison to normal inline images or
Flash contents. The information in [19] and [20] is reproduced in Figure 2-6 using their
2. Background
22
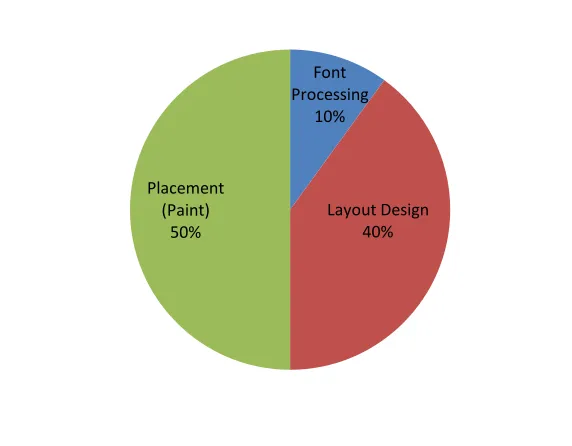
Figure 2-6: The average time spent for each step of the Text Display Process
This timing analysis illustrates that decoding font files and rasterizing glyph bitmaps
are not major contributors to the CPU load whereas up to 90% of the time is spent for the
layout design and the placement of bitmaps on the surface. This result is not surprising as
glyph bitmap caching can reduce the load on the CPU whereas copying these individual
bitmaps over and over can contribute significantly more. Our own results, shown later in
Chapter 3, will corroborate this result.
2.3 Methods to Improve Mobile Performance
Several techniques are being used in today’s devices in order to enhance the general
performance.
Font Processing
10%
Layout Design 40% Placement
2. Background
23
2.3.1 Simplify Content prior to Processing
Some mobile browsers use special proxy servers to either reduce or pre-render complex
pages prior to sending them back to the mobile device. Although an elegant solution, it
places the burden of computation on server farms as well as significantly reduces the
privacy of the user.
Many content providers offer multiple versions of their website for different types of
platforms and web browsers. In such instances a Blackberry user would see a different
webpage as compare to an Apple user.
Another trend is that native applications are being developed for each platform to
eliminate the processing delays of browsers entirely. Although speed and reduced
bandwidth are significant advantages, developing websites and clients for each platform
places a burden on the site developers.
2.3.2 Optimize the rendering engine for limited
scenarios
Embedded OS and application developers usually limit the choices for users in order to
increase performance (speed, power, etc.). In many cases the device only supports a hand
full of font styles and has limitations on image and media size and formats (e.g. video
2. Background
24
2.3.3 Optimized algorithm or technique in the
software rendering engine
Application developers, OS kernel designers and companies who manufacture mobile
processors always try to come up with techniques and algorithms to better utilize the
processing power of devices. Implementing video decoders, 3D graphics accelerators,
and other co-processing units inside SoCs is the major effort by manufacturers to solve
performance issues of CPUs. There are also software designers who try to implement
software parallel processing schemes to existing sequential algorithms [21]. One of these
efforts is the one described in [20] which will attack bottle necks of rendering engines in
web browser applications. However it is a well-known fact that “Y” number of cores
does not equal “Y” times improvement in performance as communication and
synchronization overhead can reduce performance.
2.4 Summary
This chapter covered the general process of displaying proportional text on modern UI
systems. There are four major steps: glyph handling, layout, placement, and transfer to
frame buffer. Other evidence is shown which suggests that the speed of layout and
2. Background
25
better performance. Also, some methods are listed which are employed by mobile devices
26
Chapter 3
Analysis
3.1 Introduction
Prior to any decision making in the design of the proposed system, an in depth
investigation of the text display process and a timing analysis for each step is performed.
This chapter aims to determine the bottlenecks in the text display process and what
solutions are available to make the process faster.
3.2 Initial Testing and Platform Selection
Initial tests were performed by creating custom software on a desktop PC in the
GNU/Linux OS which placed glyphs rendered by FreeType in a large bitmap surface
which is saved to disk. This code performed the fundamental algorithm discussed in
Chapter 2: glyph rendering via FreeType, and text layout (with kerning) and placement
utilizing glyph bitmap caching. These tests showed that the PC’s performance was far
exceeding what was expected. Modern PCs utilize far more resources to improve
performance compared to their mobile counterparts. A more suitable testing platform was
3. Analysis
27
The ARM architecture is currently the dominant one in the mobile market. Therefore,
in the interest of fair comparisons, the proposed system should be targeted to work in
such an environment. The Beagle Board [22], an embedded system board with similar
hardware as those found in mobile devices at the time, was selected. As shown in Figure
3-1, the Beagle Board is an embedded system based on a Texas Instruments OMAP 3530
ARM Cortex A8 superscalar processor. The SoC of this board houses 128MB of LPDDR
RAM and 256MB NAND FLASH and a 3D graphic accelerator. Other necessary
peripherals to run a full GNU/Linux OS are also available on this board.
Figure 3-1: Beagle Board [22]
The same GNU/Linux distribution (Ubuntu) [23] was compiled and installed for this
3. Analysis
28
tool for rendering text to bitmaps, PDF2TIFF, and the second to compare processor
architectural performance. The later used a vintage equally clocked desktop PC with
similar RAM speeds. The results are shown below in Table 3-1. Neither of the code used
rely on graphics or any other co-processors; they are simple tools which generate a
bitmap output.
Table 3-1: Timing Comparison of Developed Software Engine between Intel and ARM Processors
600MHz Celeron PC
Average Number of Characters (Letters) 3200
DPI 600
Proposed Code Time (Kerning Calculation + Placement – any adjustments) 0.3 Second PDF2TIF Time (Placement – any adjustments) 1.7 Second 600MHz Beagle Board with ARM Cortex A8
Average Number of Characters (Letters) 3200
DPI 600
Proposed Code Time (Kerning Calculation + Placement – any adjustments) 1.84 Second PDF2TIFF Time (Placement – any adjustments) 37 Seconds
The table shows that both the proposed software and PDF2TIFF perform significantly
faster on the Intel x86 processor as compared to the ARM (the timing is for “user time”
only, no OS overhead). The power savings in ARM based processors in comparison to
Intel x86 processors mostly comes from the difference in the architecture design [24].
The simpler architecture design of ARM processors leads to smaller micro-instructions
set which requires more clock cycles than Intel x86 processors to execute the same
algorithm resulting in the significant performance difference. The Intel x86 processor
3. Analysis
29
proposed code and PDF2TIFF illustrates the impact of code abstraction and the need for
code optimization. PDF2TIFF was given a text only document, but its pure text
performance was poor as it was never intended to operate on the ARM architecture.
As can be seen in the results, two processors with same clock cycle perform much
different based on their architecture design. This shows the necessity of having optimized
methods when dealing with embedded processing units of today’s mobile devices.
The results in the above table also seem to indicate that the glyph rasterization process
provided by FreeType is not very time consuming compared to the task of placement.
Another result shown later in this chapter will further show this is the case.
3.3 Hardware Platform Selection
The Beagle Board is a good platform for testing software implementations, but any
custom hardware is impossible to include into this system as there is no interfacing points
into the SoC. There was no environment which existed at the time this work began which
offered an ARM processor with a programmable hardware fabric. In March 2011, during
the mid-development of this work, Xilinx announced the Zynq platform which is an
ARM processor linked with an FPGA fabric. This platform would have been ideal
unfortunately it wasn’t until the beginning of 2012 that devices and software were easily
available. It was the decision to maintain the current development on the environment of
3. Analysis
30
In order to fairly show comparisons between software only and the proposed design, an
environment which was capable of running a modern OS as well as being hardware
customizable needed to be found. The only choices at the time were FPGA based, and
very few offered all the necessary key components. One of these major components is the
OS. The intended use of the proposed hardware design is to be controlled by software
(e.g. WebKit) which is designed for modern OSs. From a development point of view, the
best choice is the GNU/Linux system which fits the needs for the software but also offers
maximum flexibility as it is open source thus allowing for more in depth analysis and
modifications. Any integration of custom hardware requires some type of driver; and the
Linux kernel facilitates many ways to achieve this. Petalinux [25], a well maintained
distribution of GNU/Linux for the Xilinx Microblaze soft-core processor, was the major
contender as an evaluation environment. Altera offered their own variant of a soft-core
processor, however there were no GNU/Linux builds available. A number of other
features required were an environment with a reasonable amount of RAM, high
resolution display output, and wired networking. Although Altera had hardware which
met these needs, the OS was the key decision maker and the Xilinx hardware was
selected.
The Xilinx XUPV5-LX110T Evaluation Platform FPGA Kit [26] was used as the
hardware development environment for he proposed design. This board supports the soft
3. Analysis
31
to build a complete embedded system capable of running the Petalinux GNU/Linux
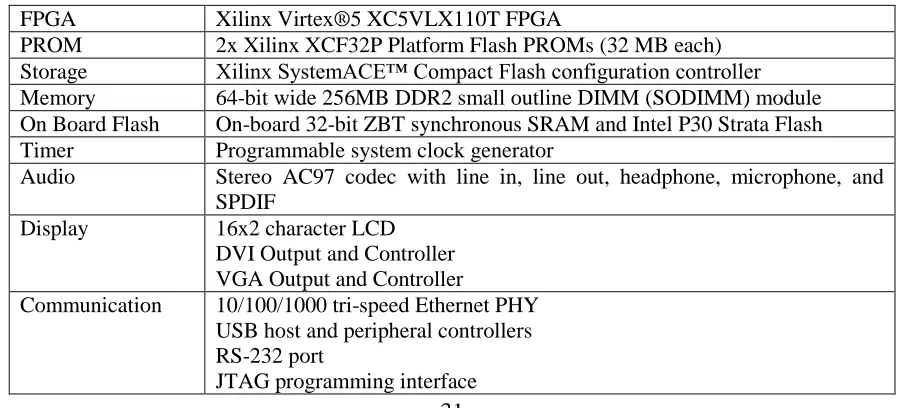
variant. Figure 3-2 shows the board and Table 3-2 summarizes its components.
Figure 3-2: XUPV5-LX110T Evaluation Board. Image Copyright Xilinx©
Table 3-2: Summary of components of XUPV5-LX110T Evaluation Board
FPGA Xilinx Virtex®5 XC5VLX110T FPGA
PROM 2x Xilinx XCF32P Platform Flash PROMs (32 MB each) Storage Xilinx SystemACE™ Compact Flash configuration controller Memory 64-bit wide 256MB DDR2 small outline DIMM (SODIMM) module On Board Flash On-board 32-bit ZBT synchronous SRAM and Intel P30 Strata Flash Timer Programmable system clock generator
Audio Stereo AC97 codec with line in, line out, headphone, microphone, and SPDIF
Display 16x2 character LCD DVI Output and Controller VGA Output and Controller
Communication 10/100/1000 tri-speed Ethernet PHY USB host and peripheral controllers RS-232 port
3. Analysis
32
The hardware design process is done using Xilinx Platform Studio (XPS) v12.4. There
are newer versions of XPS available but they were found not to be 100% compatible with
various IP cores and the Petalinux tools. Modifying any of these components or tools was
considered to be out of the scope of this work.
The Microblaze processor for this board can be clocked up to 125MHz, which is lower
than the speeds seen on today’s mobile SoC processors. The intent of this work is not to
compare the proposed system with a current mobile SoC, but to show an improvement
through the use of additional hardware. In this case, the Microblaze processor and
environment offer a platform to properly measure the performance of software versus
hardware solutions. It can always be argued that the new high speed processor might not
benefit from the proposed system, but no system was in place at the time to make this
judgment.
Although this environment is not the ideal ARM based one as specified earlier, the
software produced was all based in “C” and “C++” and contained no specific reference to
the Microblaze architecture. The hardware interfacing is memory based which is typical
for all co-processor and peripheral designs. The proposed design should therefore be
3. Analysis
33
3.3.1 Method of Measure
The performance evaluations of this work are primarily for speed improvement;
therefore all measurements are respect to time. Measuring time is generally not very
accurate as the hardware timers in most system have a limited degree of precision.
Software designers mainly use the kernel functions to access these timers for any type of
comparison. In the case of the Beagle Board and the Xilinx Microblaze processors, the
GNU/Linux system only provides a resolution down to a millisecond; which is not very
fast for hardware performance measurements.
A simpler solution is to count the number of clock cycles during a particular operation.
The real time can be derived from the number of clock cycles by using the following
equation:
( ) Eq. 3.1
By counting the number of clock cycles taken to execute a task, one can achieve the
highest possible degree of accuracy in measuring time on a system. Also when number of
clock cycles is used as the unit of measure the performance enhancement results will be
independent from the clock speed of the system. Therefore no matter how fast the CPU
3. Analysis
34
In order to perform this measurement, a custom hardware timer is added to the Xilinx
system and recorded before and after the interested function is executed. All of the timing
results presented from this point onwards are derived from counting the clock cycles.
These results are generated from several iterations of the same tasks with varying inputs
averaged together.
3.4 Basis of Analysis and Comparison (WebKit)
It is crucial in any research work to find proper candidates for performance evaluation
comparisons. There are several factors that must be taken into consideration when
choosing the competitor, but one of the most important is that the competitor should be
an industry standard. We need a competitor that is a trending solution and there are
current efforts for evolution and optimization. It is also important to have a fair
comparison and have sufficient information about the competitor, its properties, and
limitations. These factors limit the choices for this work to ones that are open sourced so
they can be examined in detail and, if possible, to extract detailed evaluation results.
In order to have a strong argument about the result of a work, one should compare the
results with the state of the art technology being used. For this purpose it was decided to
compare the final timing results of this work with a software engine that is being used in
many of the today’s handheld devices. This will show the performance difference
3. Analysis
35
proposed engine performs better than a software engine being used as a standard, then the
work has a proven value.
Most mobile devices today use a GNU/Linux derivative OS (i.e. Android) [27]. Linux
has the advantage of using open source libraries and applications. Web browsers and
E-Book reader applications are the best environment to investigate the performance of the
proposed text display engine. E-Book readers are very basic applications compared to
web browsers. Web browsers deal with all types of media and interactive elements
whereas E-Readers simply present text.
Almost all of the devices that operate on a GNU/Linux based OS have a native web
browser or some third party ones that use the WebKit [28] engine. WebKit is a powerful
and sophisticated web page rendering engine that handles the process of displaying a
webpage from the start of reading data from a network connection up to the end result
displayed page on the screen. Google Chrome, Apple Safari, BlackBerry Browser, Opera
and many others use WebKit as the web page rendering engine. Teams of programmers
from all different companies (such as the aforementioned ones) are contributing to
WebKit to enhancing its performance. This makes WebKit an excellent candidate for
comparison. It is interesting to note that Android itself uses parts of WebKit in its OS
framework for UI components. Therefore any improvement in the WebKit system could
3. Analysis
36
For this work WebKitDFB [29] [30] was used as it included an output system for Direct
Frame Buffer (DFB) access. DFB access was required to show the output on the
Microblaze hardware. Additionally, the same code base was used on a development PC
so that the code could easily be inspected, debugged, and tested prior to testing on the
Microblaze hardware.
3.4.1 Internals of WebKit
WebKit is a complete web page rendering engine which performs all the tasks needed
in a browser to display a web page. It has many different components inside it that
perform tasks like handling java elements, security features and much more. Part of
WebKit is the rendering engine. One of major challenges of this work is to examine the
steps WebKit takes to render and display elements of a web page. WebKit has a very
large code base (approximately 1.4 GB) and requires about 24 hours and 6 GB of RAM
to compile on an average modern desktop PC. For the development process, all WebKit
code was cross compiled for the Microblaze hardware.
In order to have an accurate performance evaluation, it is important to find out the exact
locations inside the code base where any task takes place. The code was compiled (debug
build) and an in-depth investigation was performed on the code by using “DDD” a free
3. Analysis
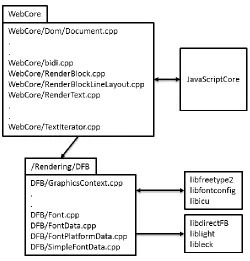
37
Figure 3-3: High level structure of WebKit text rendering engine.
When WebKit loads a web page from internet, it splits the page to objects. Then, based
on the type of each object and place of the object on the screen, it starts to render the
object and copy the bitmap to the frame buffer.
In an HTML file, a text object is declared similar to the following example:
<p style=”text-align: center; margin-left: auto; margin-right: auto; color: #000000”> <span style=”font-family: Arial, Helvetica, sans-serif; font-size: 14pt”>
This is a Sample Text. </span>
</p>
After decoding the HTML file, WebKit reads the DOM tree objects extracted from the
file. A text object in the DOM tree can contain a single or multiple paragraphs which in
3. Analysis
38
style data and then it decides whether it needs to calculate the layout design or not. If
needed, it starts to design the layout for the text object.
WebKit goes through the text array and based on the available width of the browsers
window calculates where each line of text on the screen ends. In the meantime, based on
the height of the characters in each line it calculates the vertical position of the next line
on the screen. Throughout this process, WebKit breaks the text object to Render Block
objects each representing a single line of text. The process of breaking the text object into
Render Block objects and calculating the vertical position of them takes place in the
“RenderBlockLineLayout.cpp”.
The layout design process is very similar to what is explained in chapter 2. WebKit
reads each character, calls FreeType to rasterize the glyph bitmap, gets the advance for
the character from FreeType, keeps adding them until it reaches the width of the screen,
then it decides it has to go to the next line.
If the text array is larger than 8K characters, it first reads the text array in 8K chunks
and places them in memory. Then it calculates the layout for the whole text based on the
style information and screen properties. This means it will go through the whole text and
breaks it into Render Blocks without considering if the whole text fits in the view
3. Analysis
39
Other objects in the page will also be considered as Render Blocks and their horizontal
and vertical positions on the screen will be calculated based on their width and height and
their relative positions to other Render Block objects in the page.
After the layout design is done, WebKit starts to place the page on the surface. At this
point it will start from the top of the page and paints each block on the surface until it
reaches the height of the surface. Whenever the screen is scrolled, based on the change in
the position of the view window by scrolling, WebKit decides which Render Blocks are
now in the view window and places them on the surface.
This is a very simplistic and brief description of a complicated process that takes place
inside the WebKit rendering engine whenever it renders a text object. This process
involves many function calls inside WebKit and from other libraries.
3.4.2 WebKit on Microblaze
The Petalinux tools only create a system image that only contains only the minimum
required libraries to boot up GNU/Linux on the Microblaze processor. In order to port
WebKit to the Microblaze architecture, a number of other libraries must first be ported.
This is done by using the Microblaze cross compiling tool chain provided as part of the
Petalinux package and making many changes to the source codes of some libraries as
3. Analysis
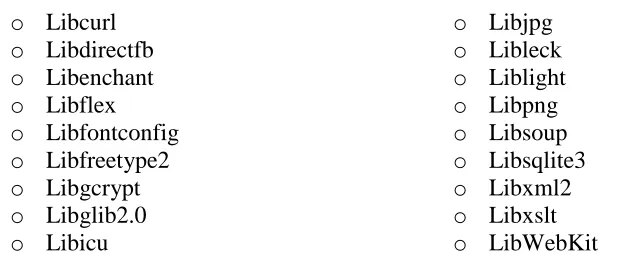
40
the list of libraries ported to Microblaze architecture in order to run WebKit on the
Microblaze embedded system:
o Libcurl
o Libdirectfb
o Libenchant
o Libflex
o Libfontconfig
o Libfreetype2
o Libgcrypt
o Libglib2.0
o Libicu
o Libjpg
o Libleck
o Liblight
o Libpng
o Libsoup
o Libsqlite3
o Libxml2
o Libxslt
o LibWebKit
Although this build of WebKit uses DirectFB as the frame buffer controller, it still does
not paint the page directly to the frame buffer. It uses a window handling library named
Liblight and paints the webpage on a surface provided to it by Liblight.
3.4.3 Performance Evaluation of WebKit
Table 3-3 shows the comparison of the time taken to rasterize bitmaps of glyphs and the
time taken by WebKit to design layout for a passage of text with one million characters.
Table 3-3: Glyph Rasterizing and Layout Design in WebKit for a passage of text with one million characters
Font Size (Pixels)
Rasterizing (ms)
Layout Design (ms)
10 403 108,150
14 452 120,100
18 474 125,836
24 518 134,978
3. Analysis
41
All of the performance evaluations of this work are performed by using public domain
English literature novels with different lengths. The novel files are taken from [32] and
are free to access.
The results shown above further confirm what is claimed earlier in this chapter from the
tests on the Beagle Board. The rasterizing of the glyph bitmaps takes significantly less
time than layout design for the text. FreeType is a modestly sized code base which
decodes mostly all known font file formats. Any attempt to parallelize this code by use of
special hardware would be unproductive as it already functions quite quickly on the
intended Microblaze and ARM architectures. Based on this fact, the proposed design will
only include the layout and placement phases for acceleration.
Due to the complexity in level of software abstraction in WebKit, the proposed design
will be a hardware-software hybrid. The software portion will translate and prepare
information from WebKit into the necessary context where then the hardware will
process it. This approach is very similar to that taken with any add-on hardware as the
software component is most commonly known as a “device driver” or device API
(Application Programming Interface).
This design will be implemented and compared with a software only version to
determine if it is in fact viable solution to improving the performance of text display in
mobile devices. Chapter 4 will cover the specifics of this design from both the software
![Figure 1-1: Samsung ARM Cortex A15 Exynos®5 System on Chip [3] ](https://thumb-us.123doks.com/thumbv2/123dok_us/1425324.1175048/22.612.178.470.115.378/figure-samsung-arm-cortex-a-exynos-chip.webp)

![Figure 3-1: Beagle Board [22] ](https://thumb-us.123doks.com/thumbv2/123dok_us/1425324.1175048/45.612.136.511.348.585/figure-beagle-board.webp)