ABSTRACT
MARKUSIC, MELANIE SUE. Effects of Design Changes on Sediment Retention Basin Efficiency. (Under the direction of Richard A. McLaughlin.)
Sediment pollution from construction sites has been of increasing concern
since the impacts on nearby streams can be severe. Controlling erosion is the
most effective approach to reducing sediment loads, but construction sites
typically have large areas of exposed soil during the active phase of clearing and
grading. As a result, sediment traps and basins are required to capture eroded
sediment on most of these sites. The purpose of this research was to determine
the trapping efficiencies of sediment basins of various designs installed on active
construction sites. Five traps and one basin were monitored in the Piedmont of
North Carolina, all on highway construction sites except one trap on a private
development. Automatic samplers were installed to measure flow and to obtain
representative samples during storm events. The basins were surveyed after
storms to determine the change in volume after repeated surveys. Trapping
efficiency was calculated from the sediment accumulation within the traps or
basin and the amount of sediment discharged, the sum of which was the total
sediment entering the device. Particle size distribution in the sediment deposits
was also determined. Two standard traps with rock outlets were found to have
37% and 46% trapping efficiencies. A standard trap with silt fence baffles was
found to have 45% and 36% efficiency rates during two time periods. Two
additional traps, one which had been sized for a 25-year storm event instead of
efficiencies of 96% and 99%, respectively. A sediment basin with porous baffles
and a skimmer outlet had a retention efficiency of 99.8%. Two standard traps had
particle size distributions for sand, silt, and clay of 34%, 36%, and 30% and 55%,
25%, 20% while a standard trap with a permanent pool had particle size
distributions of 55%, 20%, and 25%. The standard trap with silt fence baffles had
a distribution of 36%, 50%, and 14%. The 25-year trap had distributions of 75%,
18%, and 7% and the skimmer basin had a distribution of 62%, 28%, and 10%.
The higher proportion of sand in the more efficient devices suggests that the less
efficient traps are releasing significant amount of sand-size sediment. Larger
basins and surface outlets clearly provide greater sediment trapping on
Effects of Design Changes on Sediment Retention Basin
Efficiency
by
Melanie Sue Markusic
A thesis submitted to the Graduate Faculty of
North Carolina State University
In partial fulfillment of the
Requirements for the degree of
Master of Science
SOIL SCIENCE
Raleigh, NC
2007
Approved by:
_________________________ _________________________ H. Joseph Kleiss, Ph.D. Gregory Jennings, Ph.D., P.E.
________________________________ Richard A. McLaughlin, Ph.D.
Biography
Melanie S. Markusic was born June 22, 1972 in Morgantown West
Virginia. She graduated from Morgantown High School in 1990. From 1990 to
1994 she attended West Virginia University majoring in Biology among other
things. In spring of 1994 she withdrew from college to explore her options in life
without a college degree and headed to Raleigh, North Carolina. For the next 6
years she worked various jobs all within the restaurant industry. In 2000, she
decided to apply for admission to North Carolina State University. It took three
more years of hard work but she was able to receive a Bachelor of Arts in
Science, Technology, and Society in May 2003. A trip, prior to graduation, to the
Dominican Republic where she worked for Habitat for Humanity for a month,
exposed to her to numerous soil related issues that were severely impacting the
lives of the native people. It was during this trip she realized she wanted to do
more to help. After graduation in 2003 she worked for a pharmaceutical
company. In January of 2005 she began her Masters Degree in Soil Science at
Table of Contents
List of Tables ... iv
List of Figures ... vii
INTRODUCTION ...1
LITERATURE REVIEW ...4
Best Management Practices (BMPs) ...4
Efficiencies...5
MATERIALS AND METHODS...8
Sediment Trap Sites ...8
Standard Trap 14...9
Standard 10-year Trap1...10
Standard 10-year Trap with standing pool ...11
Skimmer Basin...12
Standard 25-year Trap...13
Standard Trap with Silt Fence Baffles...13
Site Surveys and Analysis ...14
Laboratory Analysis ...16
RESULTS AND DISCUSSION ...18
Standard 10-year Trap14...18
Turbidity ...18
Sediment ...19
Skimmer Basin...20
Turbidity ...20
Sediment ...21
Standard 25-yearTrap...22
Turbidity ...22
Sediment...23
Standard 10-year Trap1...25
Turbidity ...25
Sediment ...26
Standard 10-year Trap with standing pool ...27
Turbidity ...27
Sediment ...29
Standard Trap with Silt Fence Baffles...29
Turbidity ...30
Sediment ...31
CONCLUSIONS ...35
REFERENCES ...36
List of Tables
Table 1. Illustrates the basins/traps that were monitored and their specific
modifications and dimensions...38
Table 2. Particle Size Analysis for each site...39
Table 3. Bulk density was calculated to determine the weight of the soil
that was being deposited throughout the basins/traps. Samples
were taken randomly from within the basin...39
Table 4. Rainfall totals for each device including the number of storm
events...40
Table 5. Standard 10-year Trap 14 total sediment loss values on a per
storm event basis including rainfall totals...40
Table 6. Standard 10-year Trap 14 turbidity values on a per storm event
basis ...41
Table 7. Standard 10-year Trap 14 TSS measurements including flow for
a given storm event ...41
Table 8. Standard 10-year Trap 14 efficiency reuslts ...41
Table 9. Skimmer Basin total sediment loss values on a per storm event
basis including rainfall totals ...42
Table 10. Skimmer Basin turbidity values on a per storm event basis...43
Table 11. Skimmer Basin TSS measurements including flow for a given
storm event...44
Table 13. Standard 25-year Trap total sediment loss values on a per
storm event basis including rainfall totals...46
Table 14. Standard 25-year Trap turbidity values on a per storm event
basis ...47
Table 15. Standard 25-year Trap TSS measurements including flow for a
given storm event ...48
Table 16. Standard 25-year Trap efficiency results ...49
Table 17. Standard 10-year Trap1 total sediment loss values on a per
storm event basis including rainfall totals...50
Table 18. Standard 10-year Trap1 turbidity values on a per storm event
basis ...50
Table 19. Standard 10-year Trap1 TSS measurments including flow for a
given storm event ...51
Table 20. Standard 10-year Trap1 efficiency results ...52
Table 21. Standard 10-year Trap with standing pool total sediment loss
values on a per storm event basis including rainfall totals ...53
Table 22. Standard 10-year Trap with standing pool turbidity values on a
per storm event basis...53
Table 23. Standard 10-year Trap with standing pool TSS measurements
including flow for a given storm event ...53
Table 24. Standard 10-year Trap with standing pool efficiency results...54
Table 25. Standard Trap with Silt Fence Baffles total sediment loss values
Table 26. Standard Trap with Silt Fence Baffles turbidity values on a per
storm event basis...55
Table 27. Standard Trap with Silt Fence Baffles TSS measurements
including flow for a given storm event ...55
List of Figures
Figure 1. Porous baffles in a sediment basin. The flow is divided evenly
across the basin to reduce turbulence and flow rates ...57
Figure 2. Silt fence used as baffles. Weirs were cut on opposite sides to
increase the flow path as runoff moves out...57
Figure 3. North Carolina map displaying the field of study site locations...58
Figure 4. Detailed map of the I-485 project with creek monitoring stations
locations...58
Figure 5. A detailed map of the Department of Water Quality monitoring
stations ...59
Figure 6. A detailed map of the region in which the Brightleaf
development was located (Standard Trap with Silt Fence Baffles) ...60
Figure 7. Standard 10-year Trap14 with a 90 V-notch weir installed on
the downslope of the exit weir
°
...61
Figure 8. Upslope image of Standard 10-year Trap14 showing the ditch
line modification and samplers installed on the left hand side ...61
Figure 9. End contractions installed on both ends of the weir to ensure
flow diversion and to reduce erosion on side walls ...62
Figure 10. Standard 10-year Trap1 with a 90 V-notch weir installed
behind the rock weir
°
...62
Figure 11. Standard 10-year Trap with standing pool with spillway
Figure 12. Effluent from Standard 10-year Trap with standing pool is
released from this pipe. The Manning equation was used to install
and program the sampler...63
Figure 13. Skimmer Basin installed with a skimmer and emergency
spillway ... ….64
Figure 14. 15 inch culvert pipe exiting the Skimmer Basin and entering
into a level spreader ...64
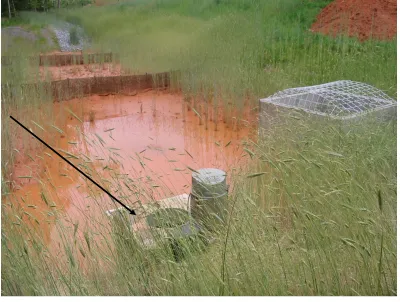
Figure 15. The Standard 25-year Trap after a storm event.. ...65
Figure 16. Standard 25-year Trap installed with a 90° V-notch weir with
head height of 20 inches...65
Figure 17. Standard Trap with Silt Fence Baffles at the onset of
monitoring ... …..66
Figure 18. Standard Basin with Silt Fence Baffes exit was installed with a
rectangular weir to monitor flow ...66
Figure 19. Textural Triangle shows types of soils according to
percentages of material involved in the make up of the soil...67
Figure 20. Standard 10-year Trap14 particle size distribution of the
trapped sediment ...68
Figure 21. Skimmer Basin particle size distribution of the trapped
sediment ...68
Figure 22. Standard 25-year Trap particle size distribution of the trapped
Figure 23. Standard 10-year Trap1 particle size distribution of the trapped
sediment ...69
Figure 24. Standard Trap with standing pool particle size distribution of
the trapped sediment ...70
Figure 25. Standard Trap with Silt Fence Baffles particle size distribution
of the trapped sediment ...70
Figure 26. Total rainfall amounts for each individual site during the period
for which they were monitored ...71
Figure 27. Standard 10-year Trap14 correlation between turbidity and
TSS...71
Figure 28. Standard 10-year Trap14 total flow of water for the life of the
trap ...72
Figure 29. Standard 10-year Trap14 sediment loss totals for the 3 storms
that were monitored in comparison to the flow-weighted mean
turbidity for each corresponding storm event ...72
Figure 30. Skimmer Basin correlation between turbidity and TSS...73
Figure 31. Skimmer Basin total flow of water for the life of the trap...73
Figure 32. Skimmer Basin sediment loss totals for the 20 storms that
were monitored in comparison to the flow-weighted mean turbidity
for each corresponding storm event ...74
Figure 33. Standard 25-year Trap correlation between turbidity and TSS ...74
Figure 35. Standard 25-year Trap sediment loss totals for the 29 storms
that were monitored in comparison to the flow-weighted mean
turbidity for each corresponding storm event ...75
Figure 36-A. Standard 10-year Trap1 correlation between turbidity and
TSS...76
Figure 36-B. Standard 10-year Trap1 correlation between turbidity and
TSS for individual storm events ...76
Figure 37. Standard 10-year Trap1 total flow of water for the life of the
trap ...77
Figure 38. Standard 10-year Trap1 sediment loss totals for the 16 storms
that were monitored in comparison to the flow-weighted mean
turbidity for each corresponding storm event ...77
Figure 39. Standard 10-year Trap with standing pool correlation between
turbidity and TSS ...78
Figure 40. Standard 10-year Trap with standing pool total flow of water for
the life of the trap ...78
Figure 41. Standard 10-year Trap with standing pool sediment loss totals
for the 3 storms that were monitored in comparison to the
flow-weighted mean turbidity for each corresponding storm event...79
Figure 42. Standard Trap with Silt Fence Baffles correlation between
turbidity and TSS ...79
Figure 43. Standard Trap with Silt Fence Baffles total flow of water for the
Figure 44. Standard Trap with Silt Fence Baffles comparison of
flow-weighted mean turbidity and mean TSS for each corresponding
storm event ...80
Figure 45. Sediment loss totals for all 6 sites that were monitored showing
amounts of sediment having left the sites for the total time ...81
Figure 46. Illustrates the range of flow-weighted mean turbidity for all sites....81
Figure 47. Illustrates the range of flow-weighted mean TSS for all sites ...82
Figure 48. Illustrates the range of r values (correlation between turbidity
and TSS) and slope factors for each site.
2
...82
Figure 49. Illustrates the trapping efficiencies with respect to total flow for
each individual site ...83
Figure 50. Illustrates particle size analysis comparisons among sites
Introduction
Soil erosion by water is the dominant force shaping land surfaces. Water
erosion occurs through two main processes: detachment and transport.
Detachment is the physical separation of soil particles from the soil mass, a
process often initiated by raindrops (Toy et al, 2002). Once overland flow is
initiated these detached particles can be transported downslope. Soil erosion
rates exceed soil formation rates over wide areas, resulting in the depletion of
soil resources and productivity (Toy et al. 2002). Construction sites are a primary
source of sediment due to the extensive land disturbance associated with these
activities. An active construction site is often an open invitation for detachment
by rain drops and transport by water to occur carrying away millions of tons of
soil per year. The extent of sediment loss ranges from minor amounts to over
224 metric tons per hectare per year (or 100 tons per acre) depending on the
installation, use, and maintenance of best management practices (BMPs) (NC
DENR, 2000). Runoff from construction sites often exceeds several hundred
nepholometric turbidity units (NTU) and more commonly several thousand NTU,
even with the proper use of BMPs (Minton, 1999).
Suspended sediments contribute to turbidity and thus affect light
transmission through the water and to the streambed (Waters, 1995). Under
storm conditions, suspended sediment concentrations commonly reach
thousands of parts per million, but increases in turbidity of only 5 NTU may have
serious effects upon aquatic organisms (Waters, 1995). Fish are highly sensitive
hypoxia, algal blooms, and even mass fish kills. North Carolina has regulations
limiting the level of turbidity of receiving waters to 50 NTU for non-trout stream
waters, 10 NTU in streams, lakes or reservoirs designated as trout waters, and
25 NTU in lakes and reservoirs not designated as trout waters. If background
turbidity exceeds these levels, the existing turbidity level cannot be increased by
runoff from construction sites (NC DENR, 2006).
North Carolina Sediment and Erosion Control Regulations state that any
land disturbing activity of one acre of land (0.4 ha) or more is required to submit
an erosion and sedimentation control plan. This plan must identify the erosion
and sediment control devices and practices to retain sediment on site (NCDENR,
2006).
Best Management Practices (BMPs) are designed to reduce the total load
of sediment leaving any given disturbed area. Some typical BMPs used on
construction sites include silt fences, mulching, rock check dams, triangular silt
dykes, sediment basins/traps, baffles, and skimmers. Silt fences are designed to
catch only sands and coarse silts (particles> 125 microns), while the fine silt and
clay size particles remain in suspension and easily pass through the silt fence
with the runoff water (Hayes, 2002). Mulching is used as a ground cover while
seeds have time to germinate and root in the soil. Check dams are used along
ditches and various other locations where flow is concentrated. The check dams
pool water temporarily to reduce erosive flows, which also allows particles to
settle out of suspension and therefore decrease the amount of sediment leaving
sediment to settle before water is discharged into a given body of water. These
structures prevent erosion and trap sediment and other coarse material.
However, these structures are less effective when swift, turbulent water moves
straight through them to the outlet. Baffles in these sediment basins serve to
slow the water and cause the larger particles to settle faster and create a less
turbid environment. Baffles can lengthen the flow path and even the flow
throughout the entire basin significantly increasing the amount of sediment that is
captured (McLaughlin, 2005). The Faircloth Skimmer is a device that is used to
dewater basins from the top of the water column. The Faircloth Skimmer floats
on the surface of the water in the sediment basin, releasing the cleanest water in
the basin instead of draining from the bottom as conventional outlets do. The
adjustable orifice regulates the filling and drawdown of the basin and improves
efficiency (Faircloth, 2006). The objective of this study was to evaluate the
effectiveness of these BMPs in improving the trapping efficiencies of sediment
basins and traps on active construction sites at several locations in North
LITERATURE REVIEW
Best Management Practices (BMPs)
The sediment retention basin is a widely used device for trapping
sediment, total suspended solids (TSS), in runoff from construction sites or any
site where more than one acre of land is disturbed. They are generally designed
to slow runoff and allow for a portion of the sediment to settle out of the water
(Thaxton et al, 2005). The design of the basins greatly affects the amount of
sediment that can be captured and retained within the basins. Simple
modifications can be made to help improve the efficiencies or capture rates of
these basins. The length to width ratio has been proven to affect the dead
storage volume within a basin (Chen, 1975; Griffin et al., 1985), with a minimum
length to width ratio of 2:1 recommended by Barfield et al. (1983), Mills and Clar
(1976), and NC DENR (2001). Baffles installed in a sediment pond increase
sediment retention rates by reducing and diffusing the inflow momentum or
velocity of water as it enters the basin, therefore minimizing dead zones (or
unused areas within the trapping device) and increasing the effective width of the
basin (Thaxton, 2004). Baffles in North Carolina are typically made of coir
matting (Figure 1) or silt fence (Figure 2) materials. The typical flow of water in
an open basin (one without baffles) receiving high flow during a storm event is
concentrated in one portion of the basin/trap. The flow does not interact with the
entire basin area thereby decreasing settling time and reducing the amount of
The principal spillway for a basin can also be considered a factor in efficiency
performance. A field study of typical sediment basins found that basins with rock
outlets trapped 59% to 69% of the sediment that was entering the basins over a
course of 20 months (Line and White, 2001). Under controlled conditions,
engineered dewatering methods have been demonstrated to have sediment
capture rates of 88% or better by using perforated risers (Fennessey and Jarrett,
1997; Ward et al., 1979; Edwards et al., 1999) or a floating skimmer (Millen et al.,
1997). The skimmer was found to be the outlet device which provided the highest
sediment capture rate. In North Carolina, the primary spillway has usually
consisted of gravel and stone. These types of dewatering methods and devices
still remain the least expensive and most popular method of releasing water from
a basin/trap (Jarrett, 2001).
Efficiencies
Sediment basins and sediment traps are both enclosures for the
temporary ponding of runoff. However, sediment traps differ from basins in that
they contain a dam made of rocks covered on the upstream side with a layer of
gravel to allow water to pass. The traps have different hydraulic characteristics
than basins, and therefore different efficiencies (Line and White, 2001). In
addition, efficiencies are affected by the particle size distribution of the material
entering the device (Jarrett, 2001).
Sediment basin or trap retention efficiencies depend on many variables:
types of BMPs implemented, and also maintenance of those BMPs (Line and
White, 2001). Schueler and Lugbill (1990) found that the severity of the storm
event could increase TSS up to four times the median value of 680 mg L-1. This resulted in a decrease in the efficiencies of the detention and retention ponds.
They also determined that soil type had an influence on trapping efficiencies.
Samples taken at the outflow of these trapping devices showed only 46% of the
sediment was retained. This in part was due to the large amount of fine clays
and silt material that was entering the device (Schueler and Lugbill, 1990).
These materials will not settle out of suspension quickly and as a result find their
way out of the basin. While this data is valuable, these devices were only
monitored for a short period of time. The data was also based on one collective
sample per storm event (Schueler and Lugbill, 1990). Line and White (2001)
found the trapping efficiency of a trap located on a Coastal Plain soil was 69%
efficient, while the efficiencies of two other traps located on a Piedmont soil
averaged 59%. These traps were monitored for an extensive amount of time (34
storm events for the Coastal Plain trap and 43 and 13 storm events for the
Piedmont traps) and individual samples throughout the storm events were
analyzed.
The ability of basins and traps to retain sediment has clearly not been well
documented, but the information available suggests that it is relatively low. The
purpose of this study was to determine sediment retention on actual construction
(coir or silt fence material), outlet type (skimmers, rock weirs), basin sizing, and
MATERIALS AND METHODS Sediment Trap Sites
The sediment traps and basins in this study were located on two North
Carolina Department of Transportation (NCDOT) highway construction sites and
one private development site in Durham, NC (Figure 3). The first site was
located in Charlotte, North Carolina at the construction of Interstate 485 (Figure
4). Along this site we monitored Standard Trap 14. It was approximately
one-tenth of a mile off Old Statesville Road near the intersection of Alexanderanna
Road. The second site was located in Johnston County, NC just southeast of
the Wake County line (Figure 5). This site was designated as a “sensitive
watershed” due to the location of endangered fresh water mussels in the tributary
that runs through much of the project. As a result, all basins and traps along this
project were designed and built based on a 25-year storm event. These basins
and traps are much larger in overall volume and surface area holding capacity.
The basin dimensions were built based on the following equation:
Equation 1 A= 435 * QpX (7.78 inches per 24 hour period)
A= the area of the basin
435= surface area (square feet) needed to be provided by basin/trap
Qp = peak flow for storms of X recurrence
X = Storm recurrence, usually 10 or 25 year.
The Charlotte and Durham basins were built based on a 10-year storm event and
as such the basin dimensions were built on the following equation:
A= 435 * Qp10 (4.93 inches per 24 hour period for Raleigh and 4.90 inches per 24 hour period for Charlotte ) (Table 1)
One basin and one trap, Skimmer Basin and Standard 25-year Trap1, were
located off of Hwy 42 adjacent to Austin Pond. Another trap, Standard 10-year
Trap1, was located off of Cornwallis Road near Hwy 42. The fourth device
monitored was Standard 10-year Trap with standing pool, located off Ranch
Road about 2 miles from the intersection with Hwy 70 East. The Durham site
involved the monitoring of one basin, Standard Trap with Silt Fence Baffles,
which was situated on the edge of the project approximately 100 yards off North
Carolina Highway 70 West (Figure 6).
Standard Trap 14
The dimensions of this trap were 6m L x 2m W x 1m D for a total volume of 12
m3 (16 yds3) according to the initial sediment and erosion control plans. The outlet used on this trap was a 2m wide rock weir. This trap is a typical silt trap
type B (NC DOT, 2006) with vertical walls, installed in a ditch line (Figure 7). The
watershed draining into the trap was approximately 0.61 ha, according to the
NCDOT plans. Below the rock dam we installed a 90° V-notch weir in a plywood
board with dimensions 2.4m L x 0.6m H below the rock dam. The board was
buried 15 cm underground with the bottom of the V-notch 10 cm above ground
There was only a 10cm standing pool behind the weir because we did not want
to alter the flow through the rock dam and disrupt the normal settling process.
An ISCO 6712 sampler with a bubbler module was installed to measure flow and
to obtain samples at the outlet of the trap (Figure 8). An ISCO 674 Rain Gauge
was attached to the sampler and used to monitor rainfall amounts. This
instrument uses a tipping bucket design to measure the precipitation amounts for
each storm event (ISCO, Inc. Lincoln, NE).
Standard 10-year Trap1
This trap was a typical silt trap type B installed with vertical walls. The
dimensions of this trap were calculated based on 51 m3 (1800 ft3) per 0.4 ha (1 acre) of drainage resulting in 131 m3 volume needed for the drainage area. This trap was built specifically for our research to enable us to study the efficiencies of
a typical 10 year storm standard trap. The outlet was a 2 m wide rock weir. We
installed a 90° V-notch weir below the rock weir with dimensions 1.2m L x 0.8m
H. Plywood side walls were installed on each end of the weir and buried in the
side walls of the basin to prevent erosion along the edges and to maintain flow
through the weir (Figures 9 and 10). The bottom of the weir was buried 15 cm
into the ground with the V-notch 10 cm above ground. This left a total of 36 cm
that made up the head of the weir. An ISCO 6712 sampler with a bubbler
module was then installed and programmed to measure flow and obtain samples
Standard 10-year Trap with standing pool
The dimensions of this trap were 15m L x 5m W x 1m D or 75 m3 (98 yds3) according to the initial sediment and erosion control plans. The outlet used on
this trap was a 3m wide rock weir. This trap was designed as a typical silt trap
type B with vertical walls and sized to capture sediment from the approximate 0.8
ha drainage area (Figure 11). However, it was installed 1 m below grade and the
rock outlet was actually controlled by the adjacent storm drain inlet. This
essentially transformed this trap into a riser basin with a 1 m solid riser, with flow
through a gravel inlet protection device. We monitored the flow at the outlet of
the storm drain, which was a 38 cm concrete pipe. The sampler was
programmed to take samples using the Manning equation (Equation 2).
Q= KAR2/3 S 1/2
n Equation 2
This equation determines the flow of the water exiting the basin using the slope
of hydraulic gradient (S), the cross sectional area of flow (A), the hydraulic radius
(R), and the roughness of the pipe (Grant and Dawson, 2001). (K) is a constant
dependent upon units and (n) is the Manning coefficient of roughness dependent
on the material of conduit used for the piping. An ISCO 6700 Series Sampler
with bubbler module was installed at the outlet of the pipe and programmed to
take samples during storm events (Figure 12).
Skimmer Basin
The dimensions of this basin were 42m L x 21m W x 1m D or 882m3 (1154 yds3) according to the initial sediment and erosion control plans. The outlet used on this basin was a Faircloth skimmer with a 50mm orifice. The basin was also
installed with an emergency spillway that consisted of a 1.5 meter high concrete
structure that spilled into the same pipe as did the skimmer effluent (Figure 13).
This basin was designed to be configured as a Hazardous Spill Basin which can
be sealed off with a sluice gate in the event of a chemical spill on the highway.
This basin was also equipped with a small level spreader at the outflow of the
basin (Figure 14). This device is used to spread the flow of water as it exits the
basin in order to decrease velocity of the water. The sides of the basin have 2:1
slopes which were stabilized with grass and excelsior erosion control blankets.
The watershed draining into the trap was approximately 1.4 ha. We monitored
the flow in the 38 cm concrete pipe draining the riser box. The sampler was
programmed to take samples based on flow calculated from water levels using
the Manning equation. An ISCO 6700 Series Sampler with bubbler module was
installed at the inlet of the pipe and programmed to take samples during storm
events. An ISCO 674 Rain Gauge was attached to the sampler and used to
monitor rainfall amounts. This instrument uses a tipping bucket design to
measure the precipitation amounts for each storm event (ISCO, Inc. Lincoln, NE).
Unlike the Standard 10-year Trap with standing pool, the bubbler tubing was
placed into the pipe where it joined with the concrete riser structure. This was
where we would normally have placed the bubbler, and as a result the readings
would have been erroneous.
Standard 25-year Trap
This trap is a typical temporary silt trap type-B with vertical side walls. The
dimensions of the Woods trap were 32 m x 16 m x1 m calculated for the 1.2 ha of
drainage for a 25 year storm event peak flow (Figure 15). The outlet for this trap
was a 2 m wide rock dam comprised of washed #57 gravel layered over large
class B stone. We installed a 90° V-notch weir on the back side of the rock weir.
The V-notch weir was 1.2 m long and 0.8 m tall. The weir bottom was buried 15
cm into the ground with the notch at 10 cm above the ground. This left a total of
51 cm for the head of the weir. An ISCO 6712 sampler with bubbler module was
attached to the weir and programmed to take samples on a flow-weighted basis
once flow was initiated (Figure 16). These individual samples that were obtained
were then analyzed in the laboratory for turbidity levels and TSS (mg L-1). An ISCO 674 Rain Gauge was attached to the sampler and used to monitor rainfall
amounts. This instrument uses a tipping bucket design to measure the
precipitation amounts for each storm event (ISCO, Inc. Lincoln, NE).
Standard Trap with Silt Fence Baffles
This basin was a typical temporary sediment basin with silt fence baffles and 2:1
the basin were 22m x 11m x 1m (242 m3 or 317 yds3) (Figure 17). These were the dimensions needed for the basin to capture sediment coming off the 0.6 ha of
drainage for a 10 year storm event at peak flow of 18.3 cm per hour. The outlet
for this trap was a 5 m wide rock dam comprised of washed #57 gravel layered
on large class B stone. We installed a rectangular weir with end contractions on
the back side of the rock weir (Figure 18). The weir was 2.4 m long and 0.8 m
tall. The weir bottom was buried 15 cm into the ground, with 10 cm from the
ground to the weir notch. This left a total of 51 cm for the head of the weir. An
ISCO 6712 sampler with bubbler module was installed and programmed to take
samples when flow reached a minimum. The samples were then analyzed in the
laboratory for turbidity and TSS (mg L-1). An ISCO 674 Rain Gauge was attached to the sampler and used to monitor rainfall amounts. This instrument
uses a tipping bucket design to measure the precipitation amounts for each
storm event (ISCO, Inc. Lincoln, NE).
Site Surveys and Analysis
All basins and traps being monitored were surveyed using a Sokkia Total
Station (Series 30R model, Olathe, KS, 2004). This instrument provided
three-dimensional coordinates of points within the basin, including the walls and
deposition or erosion areas. The initial survey of each trap or basin provided the
volume of the basin at the time the water sampling began. In most cases, we
significant changes occurred to the original dimensions due to erosion or
deposition. If the basin was modified or cleaned, another survey was taken
before and after disruptions to ensure proper calculation of sediment
accumulation. If no activity occurred throughout the study of the basin, only the
initial surveys along with a final survey were taken. In order to avoid
measurement errors, surveys were only conducted once the sediment
accumulation was significant in each basin.
To determine the volume changes in each basin, the survey data was
analyzed using an AutoCAD program (AutoCAD Land Desktop 2005, San Rafael
CA). The AutoCAD program was used to develop a three-dimensional map of
each basin for each survey. The maps were then checked for accuracy to
ensure there were no equipment or user errors. This was done by visual
inspection of the images ensuring no abstractly shaped figures or depths of
sediment accumulation that did not match other numbers within the same survey.
A volume report was generated for each survey listing in specific details the cut
or fill that was measured within the basins or traps and the overall cubic yards of
volume that the basin or trap possessed currently. The maps were then
compared and the net change in volume was calculated by simply subtracting the
Laboratory Analysis
Runoff samples were measured for turbidity using the Analite
Nepholometer, Model 152 (McVan Instruments, Australia). Each sample was
shaken for 10 seconds and then allowed to settle for 30 seconds. Readings over
the instrument limit of 3,000 NTU resulted in diluting a subsample to bring the
reading down to <30,000 NTU, and then multiplying that value by the dilution
factor. We did not make dilutions greater than 10:1 to avoid subsampling errors,
so samples which remained above 3,000 NTU after a 10:1 dilution were entered
as “>30,000 NTU.” For statistical purposes, they were calculated as 30,000
NTU.
For each set of samples from rain events, the turbidity readings from the
nepholometer were corrected against formazin standards. The standard
readings were used to correct for any instrument error that may occur. A linear
regression line was fitted and the following equation was used to calculate the
corrected turbidity.
Equation 3
Corrected turbidity = (slope*uncorrected turbidity) + intercept
Total suspended solids (TSS) was determined by filtering 50 mL of the samples
through 90 mm preweighed filters (Environmental Express, Mt. Pleasant, SC).
The samples were stirred constantly using a stir plate while the 50 mL subsample
was removed by pipette from all parts of the sample volume. The filters were
Sediment in the basins/traps was sampled at the time of the last survey.
Samples were obtained at different points representing the inlet, middle, and
outlet areas in the basins. Particle size analysis was performed on these
samples using the hydrometer method (Gee and Bauder, 1986).
Bulk density samples were taken from the basins to calculate the mass of
sediment deposited in the basins. Samples were collected by inserting a metal
cylinder of 137.4 cm3 in volume. The cylinder was carefully inserted into the sediment deposit until reaching the soil of the basin bottom, which was much
more compact than the deposits. The columns of sediment collected
represented all sediment deposited into the basin over the length of the
monitoring time. Three samples were collected from each basin at the inlet, the
middle, and near the outlet of the basin. These cores were dried at 103-105° C
until a constant weight was found. The samples were then weighed and the bulk
RESULTS AND DISCUSSION
Standard 10-year Trap 14
The Standard 10-year Trap 14 location received three rain events from
May 26 to June 29, 2006 ranging from 1.8mm to 70mm (Table 5, Figure 26).
This basin represented one of the standard basins, or “typical” sediment control
structures. Standard 10-year Trap 14 was located in a ditch line (Figures 7 and
8).
Turbidity
Turbidity ranged from 220 NTU to > 30,000 NTU during the three storm
events which were monitored. The flow-weighted mean turbidity ranged from
11,203 NTU to 14,430 NTU (Table 6). There was a high correlation between
turbidity and TSS for the site overall (r2 = 0.9606) (Figure 27). During the May 26th storm event there were 4 samples collected and analyzed for turbidity and TSS. The range for TSS was from 23 mg L-1 to 43,239 mg L-1, with a flow-weighted mean value of 11,794 mg L-1 (Table 7). During the June 3 storm event there were 6 samples collected and analyzed. The range for TSS was from 202
mg L-1 to 35,783 mg L-1,with a flow-weighted mean value of 6343 mg L-1 (Table 7). Finally, the storm event on June 25 produced 18 samples that were collected
and analyzed. The range for TSS was from 155 mg L-1 to 62,491 mg L-1, with a flow-weighted mean value of 14,253 mg L-1 (Table 7). The exceedingly high values for both turbidity and TSS could be attributed to the unstable vertical walls
which appeared to contribute a great deal of sediment within the trap itself. The
(Figures 7 and 8). Vegetation around the trap was never established during this
period, creating large gullies and rills around the perimeter of the trap. Little or
no maintenance was provided which created less than adequate volume for
settling time of the soil particles as sediment levels increased with in the trap.
The total flow exiting the trap was 262 m3 of water (Figure 28). The third storm produced over 125 m3 of water leaving the trap (Table 7). This heavy flow event produced the most runoff of the three events as well as highest turbidity and TSS
values.
Sediment
Initial volume of Trap 14 was 16m3 (21 yds3) and the final volume was 14 m3 (18 yds3), for a net increase of 2 m3 (3 yds3) of sediment within the trap. This is 2,530 kg of sediment based on an average bulk density of 1.1 g/cm3 (Table 3). A total of 4,410 kg of sediment was measured in the outflow over the
same time period (Table 5, Figure 29). The total of 6,940 kg of sediment
represents the total amount of sediment that entered the trap over the course of
the three storm events, mostly in the last storm. The net retention efficiency was
36.5% for this series of storm events (Table 8). The particle size analysis of the
trapped sediment was 34%, 36%, and 30% of sand, silt, and clay, respectively
(Table 2, Figure 20) While we do not know what the particle size distribution was
of the incoming sediment, the relatively low proportion of sand suggests that the
efficiency improvement in basins with baffles showed that the proportion of sand
in the basin will increase with higher efficiencies (Thaxton et al., 2005).
Skimmer Basin
The Skimmer Basin location received 20 rain events from March 20 to
August 24, 2006 ranging from 2.3 mm to 91 mm (Table 9, Figure 26). The
Skimmer Basin was designed to be converted to a Hazardous Spill Basin sized
for a 25 year storm event (Figure 13). The sides were well vegetated and
stabilize, and the inlets protected with Class B rock. As a result, there was little
evidence that sediment was generated within the basin.
Turbidity
The turbidity ranged from 16 NTU to 4,200 NTU, with flow-weighted mean
turbidity ranging from 17 NTU to 2,848 NTU (Table 10). The range for TSS was
from 2 mg L-1 to 7,438 mg L-1, with a flow-weighted mean value of 475 mg L-1 (Table 11). The turbidity and TSS for this basin were relatively low among those
studied. The lower turbidity and TSS range could be due to greater surface area
of the basin compared to a standard 10-year basin. The Skimmer Basin was
designed specifically for a 25 year storm event which made it much larger and
thus there was more residence time for the settling of particles out of the water
column. This basin also had porous baffles, a skimmer outlet, and 2:1 sloping
the basin would all aid in the reduction of turbidity and TSS. The correlation
between turbidity and TSS was lower (r2 = 0.792) compared to those in other basins (Figure 30). One explanation is that the basin was trapping much more
sand than others (Table 2, Figure 21), resulting in mostly clay and silt generating
turbidity. This would explain the fairly low weight in samples with high turbidity
readings. There were also initial instrumentation errors during setup for the first
5 storms giving the very low readings for turbidity and TSS. These readings
were recorded during very low flow events and may have been primarily from
water that had been standing in the basin for many days (Table 11). Flow also
was found to be low during the storm events when samples were collected which
contributed to the relatively low amount of sediment exiting the basin (Table 12).
Overall flow for the Skimmer Basin totaled 1553 m3 (Figure 31).
Sediment
Initial volume of the Skimmer Basin was 2247 yds3 (1718m3) and the final volume was 1736 yds3 (1327 m3). This left an increase of 511 yds3 (391m3) of fill (sediment) within the basin. A total of 1187 kg of sediment was measured in the
outflow over the same time period (Table 9, Figure 32). The 511 yds3 represents 383,000 kg of sediment based on the bulk density measurements of 0.98 g/cm3 (Table 3). The total of 384,187 kg of sediment represents the total amount of
sediment that entered the basin over the course of the 20 storm events. As a
result, the net retention efficiency is 99% for this series of storm events (Table
respectively. (Table 2, Figure 21). The combination of design features,
apparently proved to have reduced the sand exiting the basin. Overall, this basin
produced the lowest turbidity levels and highest sediment capture rates.
Standard 25-year Trap
The Standard 25-year Trap received 29 rain events from October 22, 2005
to August 24, 2006 ranging in rainfall from 1 mm to 91 mm (Table 13, Figure 26).
This trap represented a 25 year storm trap with a rock outlet with vertical walls.
There were no other modifications made to the trap. For much of the monitoring
period, this trap did not receive significant amounts of runoff because the
drainage area had not been brought up to final grade.
Turbidity
The turbidity ranged from 325 NTU to 29,771 NTU during the monitoring
period, with flow-weighted mean turbidity ranging from 470 NTU to 21,637 NTU
(Table 14). There were moderate correlations between turbidity and TSS. The
overall r 2 value of 0.7139 (Figure 33) was low primarily due to three storm events with TSS correlations of <0.65. Some storms had very high
Turbidity-TSS correlations. The storm event that occurred on October 22, 2005 produced
on July 25, 2006, with an r2 value of 0.99. This storm event produced 10 samples with TSS ranging from 1,008 mg L-1 to 25,982 mg L-1, with a flow-weighted mean value of 6,763 mg L-1 (Table 15). The Standard 25-year Trap had high sediment concentrations throughout the life of the trap.
This was a poorly designed trap which did not receive much runoff due to
the stage of the project. There were many barriers keeping flow diverted from
this trap, in particular the roadbed which was below grade and which diverted
flow to another basin. There were several severely eroded side walls and the
main inlet had developed a significant head cut. These areas of erosion could
have also contributed to the high levels of turbidity and TSS.
This trap was on the edge of the main road bed that was actively used, as well as
some areas of fill and cut, resulting in a highly disturbed watershed. This
provided high sediment concentrations in the runoff that did make it into the trap.
It appeared that when a storm event occurred the trap was simply re-distributing
already deposited sediment from within the basin and expelling it.
Sediment
The initial volume of the Standard 25-year Trap indicated that the trap had
395m3 (517 yds3) of volume. The final volume depicted a total of 537 m3 (702 yds3). This suggested an increase in available volume of 142m3 (185 yds3) within the trap, which was likely a result of errors in the surveying. According to
the original plans the dimensions of the trap were 32m x 16m x 1m for an overall
the initial survey results predicted. The trap had been removed by the time this
was apparent, so another survey was not possible. A visual estimation of
deposition in the trap was approximately 0.3048 m (1 ft) overall, for a total of 156
m3 or 184,080 kg of sediment (using 1.18 g/cm3 for bulk density and the original dimensions of the trap (32 m x 16 m x 1 m) (Table 3). A total of 7,837 kg of
sediment was measured in the outflow over the same time period (Table 16,
Figure 35). Of the 29 storms, two storms events (12/25 and 12/29) occurred
when the sampler malfunctioned and did not collect samples. Calculations were
made based on the 12/5 storm event in order to estimate the amount of sediment
lost during the outflow of water. On the average, during the 12/5 storm event,
0.02 kg of sediment exited the trap for every cubic foot of water. The 12/25
storm event had 124m3 (4379 cf) of water exiting in total which allowed an estimated amount of 87 kg of soil out of the trap. The 12/29 storm event had 233
m3 (8232 cf) of water exiting in which an estimated 165 kg of soil left the trap. The storm event which occurred on June 14, 2006 produced sufficient runoff that
the sampler completed sampling before the end of the storm; therefore samples
were not collected for the entire storm event. Using previous data from the same
storm event, the sediment lost for the entirety of the storm was calculated. This
amount was an additional 2,165 kg of sediment which was then added on to the
1,108 kg that were calculated from the samples taken during the storm. Using
the estimated deposition, the net retention efficiency was 96% for this series of
storm events (Table 16). The captured sediment within the trap was 75%, 18%,
and the TSS values are high, the amount of sediment that actually entered the
trap was low due to the low of stormwater during the monitoring period. As a
result, the trap was not receiving runoff from a large portion of the 1.2 ha
drainage area for which it was designed. The overall total flow of water through
the trap was 3330 m3 (Figure 34), a moderate amount compared to the other sites that were being monitored.
Standard 10-year Trap1
The Standard trap location received 16 rain events from October 7, 2005
to February 25, 2006 ranging in rainfall from 0.8 mm to 38 mm (Table 17, Figure
26). This basin represented a 10-year storm trap with a rock outlet.
Turbidity
The turbidity ranged from 406 NTU to 15,962 NTU during the 16 storm
events which were monitored. The flow-weighted mean turbidity ranged from
453 NTU to 4,629 NTU (Table 18). The majority of the storm events showed
high correlations between turbidity and mean TSS (Figure 36-B). The correlation
over all events was 0.7756 (Figure 36-A). Total suspended solids ranged from
84 mg L-1 to 20,096 mg L-1, with a flow-weighted mean value of 1,272 mg L-1 (Table 19). Overall the trap had high levels of turbidity and TSS and had
significant erosion of the deep vertical walls. There were large deltas of
overall volume of the trap. The high levels of turbidity and TSS were likely due to
the large area of land (1 ha) that was diverted directly in to the trap. High
sediment concentrations could also be associated with the outlet of the trap,
which had a rock outlet that was flush with the bottom providing no standing pool
of water. In additions, one of the two diversion ditches entering the trap was
located relatively close to the outlet of the trap. This caused the water and
sediment to rush out of the trap as soon as it entered. There were no baffles to
reduce the velocity of the water within the trap. The overall volume of water that
exited the trap was 9,632 m3 (Figure 37). Individual storm event flow shows an increase in flow was associated with an increase in TSS and turbidity (Table 19).
Sediment
Initial volume of the Standard Basin was 262 yds3 (200m3) and the final volume was 197m3 (257 yds3). This left an increase of 3 m3 (5 yds3) of fill (sediment) within the basin. A total of 5209 kg of sediment was measured in the
outflow over the same time period (Table 17). The 3m3 (5 yds3) calculated to 2,790 kg of sediment (Table 20, Figure 38 ) based on the bulk density (0.93
g/cm3) of the sediment (Table 3). The total of 7,999 kg of sediment represents the total amount of sediment that entered the basin over the course of the 16
storm events. As a result, the net retention efficiency was 35% for this series of
storm events (Table 20). The sediment was comprised of 55%, 25%, 20% sand,
may be due to many factors, but clearly most soil particles could exit the trap
without proper settling time (Table 23). Overall, the trap performed the worst of
all of the traps and basins studied, but very similar to Sediment Trap 14 (36.5%).
Standard 10-year Trap with standing pool
This trap had flow from three rain events that were monitored from April 7,
2006 to June 14, 2006 ranging in rainfall from 12 mm to 75 mm (Table 21, Figure
26).
Turbidity
The turbidity ranged from 350 NTU to 5,568 NTU during the three storm
events which were monitored. The flow-weighted mean turbidity ranged from
631 NTU to 3,671 NTU (Table 22). Turbidity and TSS were highly correlated
with an overall r2 value of 0.87. The soils being deposited are similar in comparison with soils from the Standard 10-year Trap1. This makes the
explanation of these contrasting slopes and r2 values hard to explain. The storm event on April 26th produced four samples that were analyzed. TSS ranged from 848 mg L-1 to 8,269 mg L-1, with a flow-weighted mean value of 3,833 mg L-1 (Table 23). On May 15th only one sample was produced by the rain event. It was analyzed and found to have turbidity levels of 3620 NTUs and TSS of 4062
(75,000 L, or 0.9 cm in the 0.8 ha watershed) before water flowed into the storm
drain. Long periods between rains contributed to evaporation and infiltration of
the water within the trap. The third and final storm of which data was collected
produced 5 samples. TSS ranged from 376 mg L-1 to 1608 mg L-1, averaging 835 mg L-1.
This trap was added as an extra precautionary device to the site and was
not initially on the Erosion Control Plans. It was designed as a 10-year storm
trap. At the time of our monitoring, the area was near final grade and had been
stabilized with vegetation all around the trap. Very little runoff made its way into
the trap and therefore the trap relied on heavy amounts of rain to fill. The trap
was installed with vertical walls which started to deteriorate immediately after the
first rain event. There was a large washout at the inlet of the trap forming a
significant delta. It appeared that most of the sediment in the trap came from the
walls and inlet of the trap itself. The lack of samples and low level of total
sediment leaving the trap could be explained by the relatively low flows into and
out of the trap as well as the heavy vegetation/ground cover surrounding the trap.
Also noted is the large holding capacity of the trap itself. This allows time for the
settling of sand and silt particles from the top of the water column, which is what
Sediment
The initial survey of the Standing Pool 10-year Trap showed the trap having a
volume of 78 m3 (102 yds3). After the 3 storm events a final survey was conducted. This showed the final volume of the trap to be 73 m3 (96 yds3). The overall change in volume is 5 m3. (6 yds3) The 5 m3 converts into 6,900 kg using 1.14 g/cm3 as bulk density for the particles that settled into the trap (Table 3). A total of 40 kg of sediment was lost from the trap (Table 21, Figure 41). A
combined total of 6,940 kg entered the trap giving the trap an overall 99%
efficiency rate (Table 24). Forty gram samples were taken of the soil that had
deposited with the trap. The sediment was comprised of 55%, 20%, 25% sand,
silt, and clay, respectively (Table 2, Figure 24). This particle size distribution was
very similar to that of the Standard 10-year Trap1, also located on the same site.
Again, the majority of the particles being deposited were sand due to their faster
settling rate. But in comparison to the Skimmer Basin, which had 65% sand in its
samples, its ability to settle and capture the larger particles is less effective. A
large majority of the silt and clay particles are still escaping the trap resulting in
high turbidity levels.
Standard Trap with Silt Fence Baffles
The Standard Trap with Silt Fence Baffles location received 11 rain events from
(Table 25, Figure26). The trap was designed for 10-year peak storm flows and
had a rock outlet.
Turbidity
The turbidity ranged from 451 NTU to >30,000 NTU during the 11 storm
events which were monitored. The flow-weighted mean turbidity ranged from
1,037 NTU to >30,000 NTU (Table 26). The 11 storms produced flows with high
sediment concentrations. The overall correlation between turbidity and mean
TSS was 0.80 (Figure 42). The first storm event monitored occurred on July 1,
2005. This was not, however, the first storm event that occurred in this trap. In
fact, the trap was largely filled with sediment, with the first baffle almost
overtopped with sediment when we started (Figure 17). This was a highly active
area on the construction site with severe erosion. Total flows were over 18,296
m3 for the time we monitored the trap (Figure 43). Results from the 9 samples that were collected from this event had turbidity levels ranging from 3700 NTU to
15,389 NTU (Table 26). Total suspended solids ranged from 3751 mg L-1 to 16,074 mg L-1, with a flow-weighted mean value of 9,334 mg L-1 (Table 27). The high TSS concentrations relative to the turbidity measurements suggests large
quantities of sand leaving the trap (Figure 44). In a normal functioning trap this
would be the first particle type to settle out. The correlation between TSS and
turbidity for this event was moderate with an r2 value of 0.64. The next five events produced results much like the first storm. The flow-weighted mean
-1
(T able 26). The next four storm events monitored on this trap start to decline in
the levels of turbidity and TSS. Turbidity ranges from 450 NTU to 22,000 NTU
and TSS ranges from 134 mg L-1 to 17,375 mg L-1(Table 26). While these results were still high, there was a noticeable decrease in overall values. The activity on
this part of the site began to taper off and eventually the flow from the drainage
area was diverted under the road bed and into a culvert system. Therefore this
site received no more flow from the drainage area but only flow from rain water
collecting within the trap. We abandoned the site at that point.
This trap had many reasons for the low trapping efficiency. First, the trap was
not maintained regularly which caused the collapse and compromise of the silt
fence baffles that were installed. The trap surface area decreased dramatically
and the volume of the trap was reduced. Constant change in the landscape
adjacent to the trap compromised the integrity of the structure itself and
collapsed walls became common.
Sediment
The initial survey of the trap indicated a volume of 242 m3 (316 yds3). After six storm events another survey was taken. This survey indicated a volume
of 226 m3 (295 yds3) indicating an overall change in volume of 16 m3 (21 yds3) (Table 28). The six storms which occurred between surveys totaled 22,876 kg of
rate of 45 % for this series of storm events (Table 28). A third survey was taken
on September 8, 2005 after a cleaning of the trap. The construction
management removed a minor amount of sediment from about two-thirds of the
trap. A survey indicated that 44 m3 (57 yds3) was removed from the trap. This cleaning resulted in a new overall volume of the basin to be 269 m3 (352 yds3). Five more storm events occurred before the final survey was completed
indicating a new volume of 261 m3 (341 yds3) indicating that 11 more yds3 had deposited in the trap. After the cleanout, another 5 storm events occurred with
an estimated 22,181 kg having exited the trap. Converting the 8.4m3 (11 yds3) into kilograms using 1.16 g/cm3 for bulk density equals 9,744 kg of sediment. An overall 31,925 kg of sediment entered the basin resulting in an overall trapping
efficiency of 31% (Table 28). While the volume of the basin seems reasonably
large and able to retain much more sediment, surveys were taken from the upper
most perimeter of the basin and not from the top of the weir as indicated on the
Erosion Control plans. The sediment was 36%, 50%, and 14% of sand, silt and
clay, respectively (Table 2, Figure 25). The sand content was much lower than
the other sites, which combined with the low efficiency suggests large amounts of
sand were being lost from this trap. The performance of the trap after the
cleaning did not increase but decreased dramatically. This could be due to a
number of reasons, one of which was the condition of the trap after the sediment
was removed. Because the backhoe could not reach the full width of the trap,
excavated area had very steep slopes and there was probably considerable
contribution of sediment leaving the basin from these eroding slopes.
In comparing the six different sites, the Skimmer Basin, the Standard
10-year Trap with standing pool and the Standard 25-10-year Trap had the greatest
trapping efficiencies. This would indicate that some combination of increasing
the surface area, the volume, and the storage capacity greatly improves trapping
efficiencies. Because of the nature of this study, there were many variables
which were not controlled and so the comparisons between the devices cannot
be precise in what variable was the most critical. However, it was clear that the
standard traps were significantly worse for trapping sediment than those with
recently developed refinements. The trapping efficiencies were somewhat lower
than those reported by Line and White (2001) for similar rock-outlet devices.
By most regulatory standards, three traps likely failed to provide adequate
retention of sediment. The current standard is for 70% retention of 40 um size
sediment, which was probably not achieved. They also tended to have a lower
proportion of sand in the sediment compared to the better performing basins,
suggesting that they were releasing more coarse materials. Rock outlet devices
tended to have significantly higher peak turbidity and TSS compared to those
Strong correlations between turbidity and TSS were found for all traps and
basins (Figure 48). The slope factors were quite different among the tested sites
(Figure 48), which is probably related to the particle size distribution of the
suspended materials. Lower slope factors were found with devices with higher
efficiencies and sand retained, suggesting the suspended sediment was higher in
clay and therefore had less TSS per unit of turbidity.
Sediment analysis of the basin/traps indicated that a large amount of the
sediment being captured was sand. To increase the capture rate of the silt and
clay particles, the basin/trap needs to be equipped for longer settling times,
Conclusions
This study confirms the improvements in basin performance reported under
controlled conditions in studies on skimmers (Millen et al., 1997), porous baffles
(Thaxton et al., 2004, 2005), and basin sizing (Barfield et al., 1983) . In
combination, it is clear that design changes can considerably improve sediment
capture on construction sites. The data and observations from monitoring six
sediment control devices suggest the following approaches to improving basin
performance:
• Increased surface area and volume will decrease the total load of
sediment leaving the basin/trap
• Baffles reduce the velocity of water entering the basin/trap creating time
for the heavy soil particles to fall out of the suspension.
• Vertical walls should be avoided because they fail, producing sediment
within the basins/traps and diminishing the effective volume of the device.
• Surface outlets decrease the total amount of sediment leaving the
REFERENCES
Barfield, B.J., R.C. Warner and C.T. Haan (eds.). 1983. Applied hydrology and sedimentology for disturbed areas. Oklahoma Technical Press, Oklahoma.
Chen, C. 1975. Design of sediment retention basins. Proceedings National Symposium of Urban Hydraulic Sediment Control Mini proceedings No. 2:285-286-298.
Clesceri, L.S., A.E. Greenberg and A.D. Eaton. Standard methods for the examination of water and wastewater. 2-57-2-58.
Edwards, C.L., R.D. Shannon and A.R. Jarrett. 1999. Sedimentation basin retention efficiencies for sediment, nitrogen, and phosphorus from simulated agricultural runoff. Transactions of the ASAE 42:403-409.
Faircloth, J.W. 2006. Faircloth skimmer. 2006: Accessed http://www.fairclothskimmer.com/.
Fennessey, L.A.J. and A.R. Jarrett. 1997. Influence of principal spillway geometry and permanent pool depth on sediment retention of sedimentation basins. Transactions of the ASAE 40:53-59.
Gee, G.W. and J.W. Bauder (eds.). 1986. Particle-size analysis. in methods of soil analysis, Part 1, monograph #9. Second Edition ed. Am. Soc. Agron, Adison, WI.
Grant, D.M. and B.D. Dawson. 2001. Isco open channel flow measurement handbook. Isco, Inc., Lincoln, NE.
Griffin, M.L., R.C. Barfield and R.C. Warner. 1985. Laboratory studies of dead storage in sediment ponds. ASAE 28(3):799-804.
Hayes, S. A. 2003. Polyacrylamide Use for Erosion and Turbidity Control on Construction Sites. Accessed http://www.lib.ncsu.edu/theses/available/etd-04072003-143620/
Jarrett, A.R. 2001. Designing sedimentation basins for better sediment capture. ASABE Soil Erosion Research for the 21st Century Conference:63.
Line, D.E. and N.M. White. 2001. Efficiencies of temporary sediment traps on two North Carolina construction sites. ASAE 44:1207-1215.
Millen, J.A., A.R. Jarrett and J.W. Faircloth. 1997. Experimental evaluation of sedimentation basin performance for alternative dewatering systems. ASAE 40:1087-1095.
Mills, T.R. and M.L. Clar. 1976. Erosion and sediment control- surface mining in the eastern U.S. US EPA 615/2-76-006:.
Minton, G.R. and A.H. Benedict. 1999. Use of polymers to treat construction site stormwater. IECA Conference 30:177-188.
NCDENR (North Carolina Department of Natural Resources). 2000. State of the environment report. 2006:17.
NCDENR (North Carolina Department of Natural Resources) and North Carolina Agricultural Extension Service. 2006. Sediment and erosion control manual.
2006:298. Accessed http://www.dlr.enr.state.nc.us/images/Chapter%20Six.PDF
NCDENR (North Carolina Department of Natural Resources) and North Carolina Agricultural Extension Service. 2001. Erosion and sediment control, field manual.
NCDOT (North Carolina Department of Transportation) 2006. Erosion and sediment control, field guide. North Carolina Roadside Environmental Unit.
Schueler, T.R. and J. Lugbill. 1990. Performance of current sediment control methods at Maryland construction sites. Department of Environmental Programs, Metropolitan Washington Council of Governments, Washington, D.C.
Thaxton, C. and R. McLaughlin. 2005. Sediment Capture Effectiveness of Various Baffle Types in a Sediment Retention Pond. ASAE. Vol. 48(5): 1795-1802.
Thaxton, C. and R. McLaughlin. 2004. Hydrodynamic and sediment capture assessment of various baffles in a sediment retention pond. ASAE.
Toy, T.J., G.R. Foster and K.G. Renard. 2002. Soil erosion: Processes, prediction, measurement, and control. John Wiley and Sons, Inc, New York.
Ward, A.D., C.R. Haan and B.J. Barfield. 1979. Prediction of sediment basin performance. Transactions of the ASAE 22:126-136.
Table 1. Illustrates the basins/traps that were monitored and their specific modifications and dimensions.
Standard 10-year Trap 14 Basin w/ Silt Fence Baffles Skimmer Basin Standard 10-year Trap1 Standard 25-year Trap Standard 10-year Trap with standing pool Baffles Rock Weir Outlet Standard Trap Skimmer 2:1 sloping walls Vertical Walls Weir (v-notch) Weir (rectangular) Manning Equation 6700 Series ISCO Sampler 25 year storm sizing 10 year storm sizing Drainage
Area 0.61 ha .60 ha 1.4 ha 1 ha 1.2 ha 0.8 ha
Dimensions
6m x 2m x 1m
22m x 11m x 1m
42m x 21m
x 1m 131 m3
32m x 16m x 1m
15m x 5m x 1m
Table 2. Particle Size Analysis for each site. Standard Trap 14 Skimmer Basin Standard 25-year Trap Standard 10-year Trap 1 Standard 10-year Trap 2 Basin w/ Silt Fence Baffles Sand %
34 62 75 55 55 36
Silt % 36 28 17.5 25 20 49.5
Clay % 30 10 7.5 20 25 14.5
Bulk Density Standard 25-year Trap Standard 10-year Trap1 Skimmer Basin Standard 10-year Trap with standing pool Basin w/ Silt Fence Baffles Standard 10-year Trap 14
Entrance 1.31
g/cm3 n/a
1.01 g/cm3
1.15
g/cm3 n/a 1.21 g/cm3
Middle of basin
1.15
g/cm3 n/a
1.00
g/cm3 n/a n/a n/a
Exit
1.09
g/cm3 n/a
0.93 g/cm3
1.13
g/cm3 n/a 0.99 g/cm3
Averages
1.18 *0.93 0.98 1.14 **1.16
g/cm3 g/cm3 g/cm3 g/cm3 g/cm3 1.1 g/cm3