APPLICATION OF SMA METHOD TO SEISMICALLY ISOLATED
NUCLEAR STRUCTURES
Jacques Chataigner1, Gildas Potin2
1 Technical Director, Tractebel Engineering (France) / Coyne et Bellier, France
2
Technical Coordinator Technical Direction Tractebel Engineering (France) / Coyne et Bellier, France
ABSTRACT
Seismic Margins Assessment is a widely used approach to upraise at design stage the strength margins of Nuclear Structures when submitted to design extension conditions.
In most cases, the Seismic Margin Assessment (SMA) will be developed using methodologies as proposed in existing recommendations, NUREG (1986, 1988), EPRI (1991), IAEA(2003, 2014) and EUR. Having in mind that only a limited number of seismically isolated NPPs are presently under operation or in construction, an applicability test study seemed to be useful. This study is the paper purpose; it describes the application of SMA analysis to two practical examples of NPP Nuclear islands resting on seismic isolation system (SIS).
This exploratory work was mainly aimed at actually checking the applicability of SMA methods to seismically isolated nuclear structures together with getting orders of magnitude of the strength margins factors these structures could exhibit for a selection of SIS failures modes that were considered as possibly governing ones.
For the two theoretical examples of NPP supported by SIS and for two typical failure modes, isolators ultimate shear and buckling, the ultimate strength capacity margins of the SIS were quantified.
Eventually some conclusions could be drawn, which indicated that SMA could be applied to this family of Nuclear structures and gave first estimates of the obtained margins, that could be considered as being reasonably satisfactory; practical improvements to be brought to the SMA methodology when applied to NPP structures SIS, to increase the degree of confidence the method requires, were also screened.
INTRODUCTION
In common practice, in the frame of a typical Seismic Margin Assessment (SMA) of nuclear structures, the following analysis steps will be completed:
• Identification of possible governing failure modes, Then, for each identified failure modes:
• Working out representative mathematical “model” (or “failure function”) of structure failure modes,
• Determination of median values and variabilities of parameters describing these “models”,
As the typical methodologies to carry out SMA do not till now explore the field of SIS, the aim of this paper is therefore to try and go through these distinct steps in the frame of practical examples of seismically isolated structures. Examples presented will deal with theoretical case study corresponding to NPP Nuclear islands or Seismic Isolation Systems (SIS) exhibiting overall features similar, but not identical, to the ones characterizing structures already existing or in project.
SETTING DOWN THE OUTLINE OF A PRACTICAL EXAMPLE
In the frame of this presentation that aims, in particular, at exploring and demonstrating the full applicability of SMA to seismic isolation of Nuclear Structures, we will:
• Define (essentially by its overall mass , isolation frequency and characteristic site seismic input) a first typical example consisting in a group (island) of nuclear structures resting on neoprene bearings, then,
• Consider a first example of SIS failure mode corresponding to shear failure of the isolators when they reach their expected ultimate shear strain.
BUILDING A MATHEMATICAL “MODEL” OF SHEAR FAILURE OF THE ISOLATORS
Main variables (parameters) that will be considered to build the mathematical “model” of the isolators shear strain failure mode will:
M global mass of the structures resting on the isolators
K equivalent global horizontal stiffness of the neoprene bearings; actually
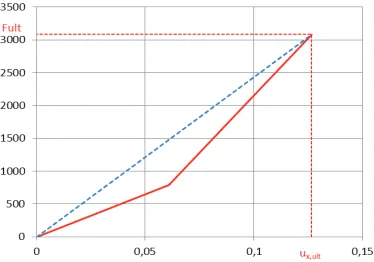
Overall stiffness K of the bearings system at ultimate state is assumed to be nonlinear (see figure 1) with an F (horizontal force) versus u (horizontal displacement) represented, as a bilinear curve characterized by {ulim,e ,Flim,e} and {ulim,u ,Flim,u} respectively corresponding to the end of the initial elastic range and ultimate capacity of the bearings.
η damping coefficient of the neoprene bearings
γi,0.05(fi), i=1,N response accelerations at frequencies fi describing the 5% damping spectrum associated to the NPP site seismic input motion
Figure 1- Typical Fh vs uh curves for SIS
reach their ultimate strain εu; principles of the algorithm used to determine γ(η ,fu) is briefly summarized in figure 2.
Figure 2- Scheme of the algorithm to determine failure acceleration γ(η,fu)
It may be noticed that this iterative process may be generally used for other failure modes of the Isolation System devices that may be envisaged.
DETERMINING MEDIAN VALUE OF CAPACITY FACTOR Fc
Median capacity factor Fc, in SMA acceptation of this factor, that leads to ultimate shear capacity of the bearings may then be determined through above described iterative process together with its
corresponding ultimate response acceleration γ (η,fu) provided all variables appearing in the failure “model” be introduced then with their median values.
In parallel, it may be recalled that if we consider that structures supported by the SIS have been designed for an acceleration level γdesign , an equivalent capacity factor as “seen” by the nuclear island upper structures supported by the SIS would be F'c, which slightly differs and appears usually to be smaller than Fc , that we will define as:
F'c= Fcdž {γdesign / γ(η,fu) } (1)
DETERMINING VARIABILITIES OF CAPACITY FACTOR Fc
Performing complete SMA, down to its end, imposes that representative estimates of individual variabilities βi associated to all parameters (variables) that are met in the “mathematical model” describing the failure mode, shall be determined.
adopted methods in SMA practice to account for the propagation of uncertainties in the failure mathematical model ; methods to be used will be the so called first order or second order moments methods or Monte Carlo Simulation (MCS)).
With account of the degree of nonlinearity which characterizes the iterative process used to determine Fc and its associated failure function, it could be recommended to make use, in most cases, of the method considered to be the most accurate and robust, i.e. MCS. We thus eliminate uncertainties that could affect the actual continuity of the derivatives of the mathematical model used to describe the SIS failure and thus impair the accuracy of the results when using first order or second order moments methods.
PRACTICAL APPLICATION OF THE METHOD: 1st example
Mean values of parameters (input data) describing 1st example
Nuclear structures and their seismic isolators system selected to carry out a 1rst practical example of Fc calculation for shear strain failure of bearing will be defined as follows:
• {M, K} such that rigid mode frequency of the oscillator modeling the Nuclear island and its SIS, is close to 1,0 Hz , which is a rather common value in seismic isolation system design.
• h = 0,07 m (overall thickness of bearings)
• hneop.= 0,04 m (total thickness of neoprene plates, in each bearing)
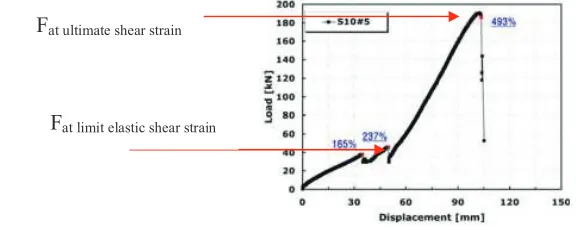
Still in the frame of this example, ultimate shear strain and limit elastic strain values together with the load ratio F(at ultimate shear strain) / F(at limit elastic strain) were taken from available literature (see Yoon and al (2013)) to describe the “force vs strain” law of the bearings.
Figure 3 - Load vs Displacement
Resulting set of input data to describe the isolator system behavior were then for this 1rst case study:
elimu/elime= 2,08
Flimu/Flime= 3,90
elime= 237%
eult= 493%
ulime= 0,0960 m
uult= 0,1997 m
Flime= 1181 MN
Fult= 4604 MN
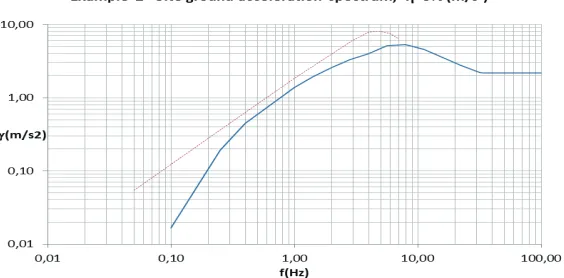
On the other hand, typical spectral data have been taken similar to those given in AFCEN (2013); their graphical representation is given below (PGA ~ 0,3 g):
Fat ultimate shear strain
Figure 4 – 1st Example : Acceleration spectra – pga~0.3g
All these input data may be considered as typical values for seismic isolated structures.
VARIABILITIES OF PARAMETERS
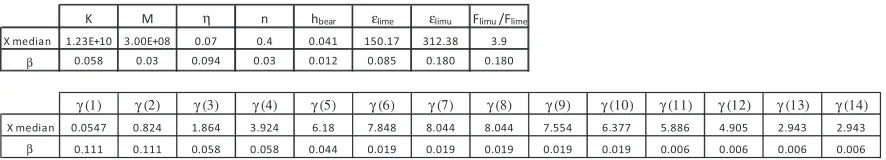
In order to actually perform full SMA for the selected failure mode, variabilities for each of the parameters have been defined on the basis of available data from technical literature among which the previously quoted references ; result of interpretation of these data led to propose the following set of (log-normal) variabilities:
Table 1 – Set of (log-normal) variabilities
< D η Ŷ ŚďĞĂƌ εůŝŵĞ εůŝŵƵ &ůŝŵƵͬ&ůŝŵĞ
yŵĞĚŝĂŶ ϭ͘ϮϯнϭϬ ϯ͘ϬϬнϬϴ Ϭ͘Ϭϳ Ϭ͘ϰ Ϭ͘Ϭϰϭ ϭϱϬ͘ϭϳ ϯϭϮ͘ϯϴ ϯ͘ϵ
β Ϭ͘Ϭϱϴ Ϭ͘Ϭϯ Ϭ͘Ϭϵϰ Ϭ͘Ϭϯ Ϭ͘ϬϭϮ Ϭ͘Ϭϴϱ Ϭ͘ϭϴϬ Ϭ͘ϭϴϬ
γ (1) γ (2) γ (3) γ (4) γ (5) γ (6) γ (7) γ (8) γ (9) γ (10) γ (11) γ (12) γ (13) γ (14)
yŵĞĚŝĂŶ Ϭ͘Ϭϱϰϳ Ϭ͘ϴϮϰ ϭ͘ϴϲϰ ϯ͘ϵϮϰ ϲ͘ϭϴ ϳ͘ϴϰϴ ϴ͘Ϭϰϰ ϴ͘Ϭϰϰ ϳ͘ϱϱϰ ϲ͘ϯϳϳ ϱ͘ϴϴϲ ϰ͘ϵϬϱ Ϯ͘ϵϰϯ Ϯ͘ϵϰϯ
β Ϭ͘ϭϭϭ Ϭ͘ϭϭϭ Ϭ͘Ϭϱϴ Ϭ͘Ϭϱϴ Ϭ͘Ϭϰϰ Ϭ͘Ϭϭϵ Ϭ͘Ϭϭϵ Ϭ͘Ϭϭϵ Ϭ͘Ϭϭϵ Ϭ͘Ϭϭϵ Ϭ͘ϬϬϲ Ϭ͘ϬϬϲ Ϭ͘ϬϬϲ Ϭ͘ϬϬϲ
Processing all these input data with specific computational tools made possible computation of Fc factor or magnification factor of the seismic input acceleration to reach shear strain failure of the isolation system; computations were carried out with MCS method (5.104 samples for this 1st example); results were as follows:
Median values of Fc and F’c (50% confidence)
Fc,0.50 F'c,0.50
6,593 4,706
Overall variabilities
β β
0,149 0,209
And finally, at 95% confidence values of Fc and F’c
Fc,0.95 F'c,0.95
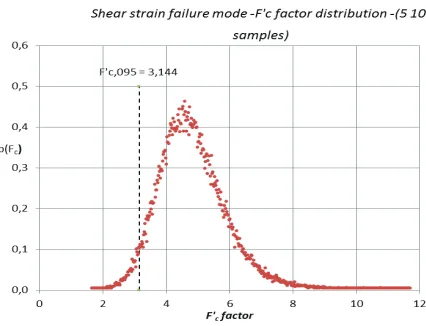
Example of resulting distribution of F'c, capacity factor is described in figure 5.
Figure 5 - Shear strain failure mode – F’c factor distribution (5.104 samples)
Results of calculations performed with this 1rst “example or shear failure mode” of an SIS, which is supposed to correspond to a typical NPP Nuclear island resting on an Seismic Isolation System consisting of neoprene pads indicate that:
• If only considering the seismic margin as regards pure shear strain failure of the bearings, this margin at 95% confidence will be for that case close to 5,15 ,which appears to be satisfactory from a design point of view,
• When considering the corresponding seismic margin as “seen” by the structures supported by the isolators, i.e. comparing the seismic acceleration for which they have been designed to the one they are actually submitted to at ultimate shear failure of the bearings, then this factor becomes close to only 3,15 which is still satisfactory from a superstructure design point of view but closer to an usual value of no less than ~1,67 that could be usually expected regarding the design seismic level.
PERFORMING CALCULATIONS FOR A 2nd CASE STUDY
A second example has been studied in order to estimate the sensitivity of the method; it concerns structures more or less similar to ongoing nuclear projects the main characteristics of which may be defined as:
• {M, K} such that rigid mode frequency of the oscillator modeling the Nuclear island and its SIS is close to 0,55 Hz, which is still a rather common value in seismic isolation system design.
• h = 0,05 m
We may notice that these design values lead to an isolation frequency of 0,55 Hz significantly differing from the previous example ; on the other hand neoprene bearings thickness or hneop.= 0,125m also differs from previous example (3 times larger).
However, ultimate shear strain and limit elastic strain values together with the load ratio F(at ultimate shear strain) / F (at limit elastic strain) have been kept identical (i.e. same shape for the F/ε law)
Spectral data have been taken similar to those used in ongoing nuclear projects; their graphical representation is given below (with a PGA close to 0,22 g):
Figure 6 – 2nd Example: Acceleration spectra – pga=0.22g
Note: Nevertheless, it is worth being noticed that site seismic spectrum content is significantly different of the spectrum content used for the 1rst example, this to also analyze sensitivity of the results to this important parameter.
Same methodological approach for the computation of Fc (or F’c) factor or magnification factor or the seismic input acceleration to reach shear strain failure of the isolation system has been used i.e. MCS method (5. 104 samples); for that 2nd example, resulting values are:
Median values of Fc and F’c (50% confidence)
Fc,0.50 F'c,0.50
14,21 9,64
Overall variabilities
β β
0,119 0,189
And finally, 95% confidence values of Fc and F’c
Fc,0.95 F'c,0.95
11,68 7,06
The results provided by this 2nd example enable to conclude that actual capacity factor Fc obtained from the SMA analysis will strongly depend on:
• the seismic isolation characteristics,
• the site spectrum content,
• the definition of the isolation frequency selected for the project.
This highlights the need for carrying out these kinds of SMA analysis to properly characterize with sufficient reliability the seismic margins as regards ultimate failure modes of the isolation system.
PERFORMING ANOTHER KIND OF PRACTICAL EXAMPLE BUT FOR ISOLATORS BUCKLING FAILURE MODE
Additional examples of practicability of SMA analysis for seismically isolated structures are eventually developed; they concerns failure mode of the isolators in relation with lateral buckling.
1,0 Hz (same as 1st previous practical example “shear failure mode”) or
0,55 Hz (same as 2nd previous practical example “shear failure mode”)
Spectrum data have also been chosen identical to those used in already described examples, i.e spectra with PGA at 0,3 g or 0,22g ; we recall that low frequency content of these spectra are also significantly different.
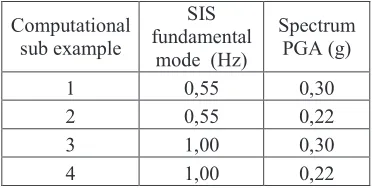
Still with aim of estimating the sensitivity of SIS SMA to input data, 4 computational sub examples have been built (crossing SIS and seismic input data - Table 2):
Table 2 – Computational sub example data
Computational sub example
SIS fundamental
mode (Hz)
Spectrum PGA (g)
1 0,55 0,30
2 0,55 0,22
3 1,00 0,30
4 1,00 0,22
To define the closed form failure functions, variation of horizontal stiffness kh of bearings as a function of • bearing lateral displacement ∆
And
• ratio of bearing critical load in its deformed state Pcr to its laterally non deformed state critical load Pcr0
Has been taken from Buckle (2002). Dependence of vertical stiffness kv as a function of: • bearing lateral displacement ∆
Has been taken as per Warn and Whittaker (2007).
Introducing the selected laws for kh(∆) and kv(∆) in a failure mode model of the SIS and, further on, through new iterative process adapted to this example, it was then possible to determine the amplification (capacity) factor Fc to be applied to input spectra to lead SIS to overall lateral buckling failure. Results that were obtained for median capacity factor Fc and F’c are:
Table 3 – Computational sub example – Factors Fc and F’c
Computational
sub example Fc,0.5 F'c,0.5 b Fc,0.95 F'c,0.95
1 5,00 7,39 0,43 2,46 3,64
2 6,90 15,88 0,40 3,57 8,23
3 5,74 7,45 0,15 4,49 5,82
4 7,68 9,40 0,15 6,00 7,34
Table 4 – computational sub example – 95% capacity factors Fc and F’c
Computational
sub example Fc,0.5 F'c,0.5 b Fc,0.95 F'c,0.95
1 5,00 7,39 0,43 2,46 3,64
2 6,90 15,88 0,40 3,57 8,23
3 5,74 7,45 0,15 4,49 5,82
4 7,68 9,40 0,15 6,00 7,34
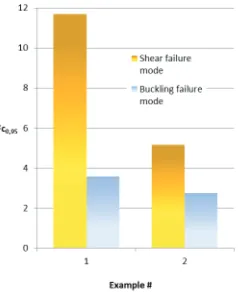
Results gained from this last SMA analysis of SIS buckling mode failure highlight:
• Similar or lower values of Fc factors compared to those obtained for SIS shear failure mode, • Great sensitivity of Fc or F’c factors to seismic input and selected at design first translational mode
frequency,
• Larger variabilities affecting the Fc or F’c results (β ~0,40),
• Fc factor values governed by actual SIS buckling failure (F’c are higher).
SUMMARIZING AND DRAWINGS CONCLUSIONS
Some examples of the use of SMA method to assess ultimate strength of isolation system based on elastomeric have been presented. The examples concerned 2 possible failure modes of the SIS: isolators failure in shear or isolators buckling. Analysis was based on simplified approaches (only one direction of seismic horizontal loads concerned) but despite the limited number of examples and failure modes investigated, these examples have shown that:
• Applying SMA method to isolation system is no major difficulty provided we are able to mathematically describe the failure modes; however, present time available technical documentation gives few indication about methods to be used for that purpose.
• Resulting Fc factors may be in agreement with recommended values, though Fc factor as seen by supported structures themselves (F’c factor) may provide less large margins in shear failure modes.
• Buckling failure modes are more sensitive to input data elementary variabilities ; this leads to capacity factors Fc at 95% confidence rather small , sometimes reaching values as low as 2,74.
• Strength factor Fc strongly depends of seismic isolators characteristics, site spectrum content and selected isolation frequency of the project.
• Fully developing the use of a SMA in the case of a seismically isolated structure, apart from the fact that it appears more or less mandatory (at least highly recommended) in present time design, standards should enable to realistically quantify the actual seismic margins of the isolation structure.
• In some cases they may be not as high as expected when taking into account all variabilities of the parameters.
• Carrying out reliable SMA analysis of such isolation system must screen as exhaustively as possible a complete set of main possible failure modes, as for example buckling of the bearings, sliding, shear under combined action horizontal and vertical forces, uplift, etc…; in parallel, secondary failures derived from the bearings failure modes (piping connections for example) shall also be quantified in a SMA approach.
• Finally, sufficient amount of values, describing at ultimate capacity the different parameters, shear modulus, ultimate shear strain, buckling limits, to be used to build failure mode models must be available; amount of these values shall be such that it makes possible for a designer to determine their median values and variabilities, including all possible effects.
• Compilation of already available data, from test data or monitoring of existing isolated structures would be most useful. Such work has been presently undertaken and is presently in progress in Tractebel Engineering.
Paying attention to above listed points would lead to safer practice of SMA analysis for nuclear structures supported by SIS and make possible rather accurate determination of their seismic margins.
REFERENCES
NUREG (1986) – “Recommendations to the Nuclear Regulatory Commission on Trial Guidelines for Seismic Margin – Reviews of Nuclear Power Plants”- CR-4482
NUREG (1998) – “An approach to the Quantification of Seismic Margins in Nuclear Power Plants: The importance of BWR Plant Systems and Functions to Seismic Margins” - CR-5076
EPRI (1991) - Report NP- 6041 – “A Methodology for Assessment of Nuclear Power Plant Seismic Margin”
IAEA (2003) – “Seismic Evaluation of Existing Nuclear Power Plants” – Safety Reports Series No.28 EUR for LWR NPP. Vol. 2 ,Chapter 4 – Sections "Seismic Hazard" & "Seismic Design"
Yoon H., Kwahk I. J., Kim Y. J. (2013) - KSCE Journal of Civil Engineering – “A study on the ultimate performances of elastomeric bearings in Korea” – Volume 17, Issue 2, 438-449
AFCEN (2013) – “French Experience and Practice of Seismically Isolated Nuclear Facilities” - (in preparation).
IAEA (2014) – “Technical Report on issues related to Seismic isolation of nuclear installations” - (in preparation).
Buckle I. (2002) – “Stability of Elastomeric Isolation Bearings”, ASCE -ST 01/2002.