NCDOT
Traffic Survey Unit
Business and Data Process Reengineering
For Traffic Volume Data
By
Larry Wikoff William Rasdorf Louis Pasquariello
Kent Taylor
OUTLINE
INTRODUCTION
Coverage Count Program Overview
Coverage Count Program Details
COVERAGE COUNT PROGRAM BUSINESS AND DATA PROCESS
REENGINEERING
PROCESSING SYSTEM ORGANIZATION FOR COVERAGE
COUNT DATA
THE CORE PROCESS
Data Collection Process
Key Data Process
Keyed Data Tables
Data Conversion Process
Converted Data Tables Input Format
Output Format Codes
Data Correction Process
Corrected Data Tables
Flagging Process
Flagged Data Tables Flagging Business Rules
Data Editing Process
Edited Data Tables
Factoring Process
Control Limits and Spatial Limits Testing Process
Investigation Process
Investigation Documentation
Acceptance Process
DATABASE ORGANIZATION
Overall Organization
Database Table Definitions
Factored AADT (Tested AADT, Accepted AADT) Analysis Documentation
Interstate Ramp Inventory Machine Inventory
USER INTERFACE
TRACKING
INTRODUCTION
The primary function of the Traffic Survey Unit (TSU) is to collect transportation data and to format it in a meaningful manner. This data can then be published for use by other NCDOT units and for use by outside agencies and interested parties. Approximately 90 percent of the data is specific to traffic volumes, vehicle types, and vehicle weights. The unit may be viewed as a traffic data warehouse.
In addition to storing data, the TSU also processes data to derive traffic and travel statistics that are of use to others. In the future, this unit would like to provide on-line access to its data for all those who might be interested in traffic information. Although the unit undertakes many activities, the one of interest in this report is the coverage count program.
Coverage Count Program Overview
The coverage count program uses conventional counters that count axle pairs. In doing so it does not distinguish between vehicle types to record the amount of vehicle traffic at a particular location. Personnel utilize the counters for a short-term count. The station locations are fixed, but the counters are portable and are installed at regular time intervals. The axle count data is ultimately used to determine Annual Average Daily Traffic (AADT) volumes.
Coverage Count Program Details
Approximately 58,000 portable count stations are monitored throughout NC. The stations are divided into several categories, including Urban, Primary, County Secondary, Interstate Mainline, and Interstate Ramps. All stations are counted annually (one count per year) with the exception of the Urban and County Secondary roads, which are counted biennially. Counts are normally taken in daily intervals for 48-72 hour durations and are recorded as daily totals.
COVERAGE COUNT PROGRAM BUSINESS AND DATA PROCESS
REENGINEERING
The TSU has initiated a directive to create a new business and data system for its coverage count program. A comprehensive system that fully captures all of the data needed to successfully execute the process of determining traffic volume AADTs was desired. Vehicle class data is not included in this process.
2
features of the process are designed to support the data inputs and outputs of the manual elements. Traffic data analysts perform evaluative and judgmental assessments of the data inputs using a variety of tools to identify data considered to be anomalous or unsuitable. The expertise provided by the analyst is critical to the analysis process. This report does not provide detailed information on these expert processes. However, the table designs developed in this study directly support the analysis process being implemented by the Traffic Survey Unit.
PROCESSING SYSTEM ORGANIZATION FOR COVERAGE
COUNT DATA
The overall coverage count program data processing can be viewed as consisting of a number of distinct global components. These are:
1) The core process 2) The database 3) The user interface 4) The tracking system 5) Publishing
6) Archiving
This report first discusses the core process and simultaneously shows how the process affects the database. Following a discussion of the core process (from data collection through acceptance) we present the fully specified database. This includes the table organization and design and a complete data dictionary.
The userinterface allows user interaction with the entire system and interjects a manual component to an otherwise partially automatic process.
The tracking process is one of informing management and analysts of the progress of the overall business and data process. It provides status reports on the progress of the work activities involved in the process.
Publishing describes making the data available to users. The goal for the business and data process is to provide archived tabular data, geographic paper maps, non interactive data that can be made available on the Traffic Survey website (tables and maps), and processable data and maps on various GISs. The first publishing activity consists of geographic paper maps.
The archiving process is one of making an archival copy of the data and storing it for future use.
THE CORE PROCESS
The core process consists of nine sub processes. These are: Key Data Process
Data Conversion Process Data Correction Process Flagging Process
Data Editing Process Factoring Process
Control Limits and Spatial Testing Process Investigation Process
Acceptance Process
On the following pages each of these is discussed individually. A description is given for each process. The inputs to and outputs from the process are described in detail. Finally, the impact of the process on the database is illustrated. That is, where useful, the data tables that are affected by the process are shown and the changes they undergo as a result of the process are illustrated.
4
Data Collection Process
Input: Blank field sheet
Process: Technician fills in the sheet with data collected in the field Output: Completed field sheet
This sheet is a paper form
The following two pages show an empty and a completed field data sheet. Data
Collection
Completed Field Sheet
Empty Field Sheet
Key Data Process
Input: Completed field sheet
Process: Data Entry PA IV personnel type in data as shown on field sheet Output: Collectively called “keyed data”
Keyed data consists of all data items on the field sheet plus following 4 items:
PageID - program generated ID that links header to its records KeyerID - person who typed in data
RecordID - program generated record ID KeyedDate - the date the data was keyed in
It results in two tables, the KeyedHeader and KeyedStationData tables.
B.R.: There can be no changes to data in any way Four new fields added and filled in
(PageID, KeyedID, RecordID, KeyedDate)
Notes: In this process the paper form is converted to a digital form. In doing so four new fields are added. But no changes are made to the data in any way.
Completed Field Sheet
Keyed Data
Program Generated RecordID
PageID KeyedID KeyedDate Keyed Data
8
Keyed Data Tables
Keyed Header
PageID Tech County Urban Type Project ID
Install Day
Install Date
Count Cycle -347 Neff, M. Burke Chapel
Hill
Retake 0 M 03/31/03 3
-346 Neff, M. Chapel Hill
Coverage 0 TU 03/25/03 3
-345 Neff, M. Chapel Hill
Coverage 0 TH 03/27/03 3
Keyed Station Data
Record ID Page ID Station ID Route ID Machine ID Cnt1 Cnt2 Cnt3
15809 -344 860 NC54 ll406 8285 7642 0
15810 -345 B65 Main St 30259 7150 6757 0
15811 -344 855 SR1009 76543 5365 5079 0
Code Remarks Location KeyerID KeyedDate TBR OK E of SR1216 Wikoff 8/6/2003
Tom S of SR1440 Wikoff 8/6/2003 Phil W of SR1147 Wikoff 8/6/2003
All fields are text fields EXCEPT PageID - Integer
KeyedDate - Date RecordID - Integer
Data Conversion Process
This process takes the initially keyed data and converts its type. Errors that cannot be converted are given NULL values. No checking or changing is done. Two fields are omitted from the conversion process because they are never again used. These are the KeyerID (the person who typed the data) and the KeyDate (when the data was typed in).
The converted tables resemble the original keyed tables (with the omission of 2 fields). The type conversion of each field is completed and the KeyedStationData table is split into two parts, separating out the counts. The new Converted Counts table includes a new CovSysID field which initially contains all NULL values. Later, during the “Flagging” process a CovSysID value is generated and inserted.
Input: Keyed Data – KeyedHeader and KeyedStationData tables.
Process: Program runs to read keyed data and convert it to the correct data types. Adjustments are also made to the table structure. A new table is created. Output: Converted Data – Converted Header, Converted Station Data, and
ConvertedCounts tables.
Converted data contains NULL values where a conversion was not possible automatically by computer.
Keyed
Data (2 Tables)
PROGRAM Data Conversion Process
(3 Tables) Converted
10
Converted Data Tables
Keyed Header
PageID Tech County Urban Type Project ID
Install Day
Install Date
Count Cycle -347 Neff, M. Burke Chapel
Hill
Retake 0 M 03/31/03 3
-346 Neff, M. Chapel Hill
Coverage 0 TU 03/25/03 3
-345 Neff, M. Chapel Hill
Coverage 0 TH 03/27/03 3
Keyed Station Data
Record ID Page ID Station ID Route ID Machine ID
15809 -344 860 NC54 NULL
15810 -345 NULL Main St 30259
15811 -344 855 SR1009 76543
Code Remarks Location KeyerID KeyedDate TBR OK E of SR1216 Wikoff 8/6/2003
Tom S of SR1440 Wikoff 8/6/2003 Phil W of SR1147 Wikoff 8/6/2003
Converted Counts
RecordID CovSysID Cnt1 Cnt2 Cnt3
15809 NULL 8285 7642 0
15810 NULL 7150 6757 0
Input Format
PageID: Integer RecordID: Integer All other fields: Text
Output Format
Converted Station Data Table PageID: Integer * RecordID: Integer * StationID: Integer RouteID: Text * Location: Text * MachineID: Text * Codes: Enumerated Remarks: Text *
Converted Counts Table RecordID: Integer * CovSysID: Integer Count1: Integer Count2: Integer Count3: Integer
Converted Header Table PageID: Integer * Technician: Enumerated County: Enumerated Urban: Enumerated Type: Enumerated ProjectID: Integer Install Date: Date
Install Day: Text * CountCycle: Integer
Note: the asterisk means a direct copy with NO conversion.
12
Codes
Some fields pose great difficulty with respect to enumerated types. The following descriptions clarify the meaning of each enumerated type.
Codes: (C, CT, CP, CO, CC, 1, 2, OW, DE, M, TB, R, SA, + all possible combinations of these)
This includes COR and RCO. Both must be recognized. Collector: (The name of all data collection employees in text) County: (The 100 NC counties numeric codes)
0, 1, 2...99
Urban: (The 17 NC urban area numeric codes) 100, 101,...116
Data Correction Process
This process takes the converted data and identifies irregularities and errors. It shows the analyst the Keyeddata file (original) and the Converteddata file so that the analyst can look at the original keyed text and decide what value should be placed in the field instead of the NULL. At this point no records are removed from the file.
This process can be done on a record by record basis. When this process is complete we have CorrectedData that is, “data in process.” Note that the term correction refers only to fixing errors related to data entry personnel incorrectly reading or typing values.
Input: KeyedHeader and Keyed Station Data Tables
ConvertedHeader, Converted Station Data, Converted Counts Tables Completed Field sheets
Process: Locate all null values in the converted original text in the keyed data tables Replace the NULL with the value decided upon by the analyst
Output: CorrectedData Tables with appropriate NULLs removed
PERSON
Corrected Data Data Correction
Process by Analyst
Keyed Data Completed
Field Sheet Converted
14
Corrected Data Tables
Corrected Header
PageID Tech County Urban Type Project ID
Install Day
Install Date
Count Cycle -347 Neff, M. Burke Chapel
Hill
Retake 0 M 03/31/03 3
-346 Neff, M. Chapel Hill
Coverage 0 TU 03/25/03 3
-345 Neff, M. Chapel Hill
Coverage 0 TH 03/27/03 3
Corrected Station Data
Record ID Page ID Station ID Route ID Machine ID
15809 -344 860 NC54 11406
15810 -345 865 Main St 30259
15811 -344 855 SR1009 76543
Code Remarks Location KeyerID KeyedDate TBR OK E of SR1216 Wikoff 8/6/2003
Tom S of SR1440 Wikoff 8/6/2003 Phil W of SR1147 Wikoff 8/6/2003
Corrected Counts
RecordID CovSysID Cnt1 Cnt2 Cnt3
15809 NULL 8285 7642 0
15810 NULL 7150 6757 0
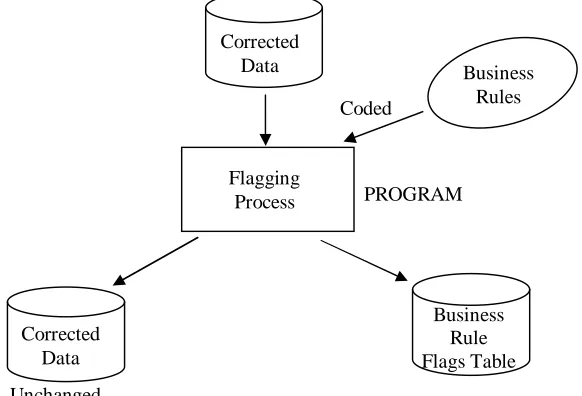
Flagging Process
This process looks at all of the corrected data and applies a set of business rules to identify errors. Thus, a new Business Rule Flags table is created and filled in with flag data. In this step no data in the original tables is changed except for CovSysID. This number is generated during the flagging process and entered into the Corrected Counts table. The remaining data is simply checked and any errors or inconsistencies are identified and entered into the FLAGS table. The purpose of the flagging process is simply to fill in the FLAGS table.
Each column in the Business Rule Flags table represents a business rule. Entries are binary with a TRUE meaning a violation of that business rule and a FALSE meaning conformance to the business rule. Recognize that business rule flags (based mostly on logic) are the first of 3 total types of flags. The second is control limit and spatial testing flags (based on statistics) and the third is analyst flags (based on judgment).
A “simple” constraint requires no complex programming or other data sources. A “complex” constraint may require additional fields or data sources (like standards) for evaluation to determine conformance.
Input: CorrectedHeader, CorrectedStationData, and CorrectedCounts tables Process: Flagging
Output: Corrected Data Tables (unchanged) plus Business Rule Flags table plus CovSysID generated and entered into the Converted Counts table
Unchanged
PROGRAM
Business Rules Corrected
Data
Flagging Process
Business Rule Flags Table Corrected
Data
16
Flagged Data Tables
Corrected Header
PageID Tech County Urban Type Project ID Install Day Install Date Count Cycle -347 Neff, M. Burke Chapel
Hill
Retake 0 M 03/31/03 3
-346 Neff, M. Chapel Hill
Coverage 0 TU 03/25/03 3
-345 Neff, M. Chapel Hill
Coverage 0 TH 03/27/03 3
Corrected Station Data
Record ID Page ID Station ID Route ID Machine ID
15809 -344 860 NC54 11406
15810 -345 865 Main St 30259
15811 -344 855 SR1009 76543
Code Remarks Location KeyerID KeyedDate TBR OK E of SR1216 Wikoff 8/6/2003
Tom S of SR1440 Wikoff 8/6/2003 Phil W of SR1147 Wikoff 8/6/2003
Corrected Counts
RecordID CovSysID Cnt1 Cnt2 Cnt3
15809 Value 8285 7642 0
15810 Value 7150 6757 0
15811 Value 5365 5079 2042
Business Rule Flags
Record ID Urban County Exclusivity
Type Project ID 4-6 7-9 10-16
15809 1-FLAG Flag
15810
15811 8-FLAG
Columns 1-6 are Header Table Constraints Columns 7-9 are Counts Table Constraints
Flagging Business Rules
Header Table Constraints Description
1. Urban County Exclusivity
2. Type Type must not be NULL
3. ProjectID IF Type = Sp Pr
THEN ProjectID must be nonzero
4. Date/DOTW Agreement Must agree
5. Date Range Installation Date must be within Range
6. Count Cycle Count Cycle within +1 or -1 of current year (current date year)
Corrected Count Constraints
7. Counts Exist IF count1=count2=count3=NULL
THEN Flag
8. Counts on Weekend No counts may exist on weekend days
9. Count Variability │count1-count2 │ > std % [complex constraint] │ count1 │
│count1-count2 │ > std %
│ count2 │
Station Data Constraints
10. CovSysID Exists Check county/urban exclusivity flag IF true (bad)
THEN CovSysTest set to true (bad) IF false (good)
THEN generate CovSysID
18
11. RampID Exists IF (stn > 5999 and stn < 8999)
THEN it is an interstate ramp
AND it must exist
12. Ramp Flow Direction Code Exists IF (it is an interstate)
THEN there must be a code
AND it must be 1 or 2
13. Ramp Flow Direction Code IF (it is an interstate ramp)
Correctness THEN on/off ramp code in Keyed Data table must match on/off ramp code (Flow) in Ramp Inventory table
14. Retake Code Correct IF (Header Data, Type) = Retake
THEN all records on this page must have
an R in the codes field
15. Machine Number Exists Machine not in Inventory
16. Machine is Available Machine Status is Available or Active You cannot use a stolen machine or one in
repair
17. RouteID The station must be shown as being on the correct route.
(compare RouteID to some field in Station Inventory table)
Data Editing Process
This process takes the unchanged Corrected Station Data table, (which has been properly converted), the Corrected Header table, the Corrected Counts table, and the Business Rule Flags table and enables the analyst to make appropriate data edits. That is, he/she uses the flags table to identify business rule violations and they then edit the corrected data file to bring these rule violations into conformance. The result is that the entries in these two tables are modified to fix problems. When a problem is fixed for a record, the flag is changed to reflect this.
The analyst may override the flags for two of the business rules instead of editing the data for them. These are the RouteID and location business rules (numbers 17 and 18). The reason for this is to retain new routes and new descriptions because there are many different ways to describe a location that are correct but that are not known to the program beforehand. In other words, the flagging process might incorrectly flag locations because it just does not know all the different ways that a location can be described.
However, no changes are ever made to the Corrected Counts table. If there are errors in the Corrected Counts (failing the business rules, for example) the process stops for those records. Their business rule violation remains flagged.
Input: Corrected Header, Corrected Station Data, Corrected Counts, and Business Rule Flags tables.
Process: Bring data into conformance with business rules.
Output: Edited Data that is in conformance with business rules (Edited Header and Edited Station Data tables).
Modified Flags correctly reflecting compliance changes (Edited Business Rule Flags table).
Unchanged
Textual documentation
Editing Process By Analyst
Business Rule Flags Table Corrected
Data
PERSON Business
20
Edited Data Tables
Edited Header
PageID Tech County Urban Type Project ID Install Day Install Date Count Cycle -347 Neff, M. Chapel
Hill
Retake 0 M 03/31/03 3
-346 Neff, M. Chapel Hill
Coverage 0 TU 03/25/03 3
-345 Neff, M. Chapel Hill
Coverage 0 TH 03/27/03 3
Edited Station Data
Record ID Page ID Station ID Route ID Machine ID
15809 -344 860 NC54 11406
15810 -345 865 Main St 30259
15811 -344 855 SR1009 76543
Code Remarks Location KeyerID KeyedDate TBR OK E of SR1216 Wikoff 8/6/2003
Tom S of SR1440 Wikoff 8/6/2003 Phil W of SR1147 Wikoff 8/6/2003
Corrected Counts
RecordID CovSysID Cnt1 Cnt2 Cnt3
15809 Value 8285 7642 0
15810 Value 7150 6757 0
15811 Value 5365 5079 2042
Edited Business Rule Flags Record ID Urban County
Exclusivity
Type Project ID 4-6 7-9 10-16
15809 Flag
15810
15811 8-FLAG
Columns 1-6 are Header Table Constraints Columns 7-9 are Counts Table Constraints
Factoring Process
Two types of factoring are treated herein. The first applies an axle factor to the raw counts to convert from axle pairs to volume. The second is the use of seasonal adjustment factors to determine an AADT for a location by taking into account the day of the week and the month (7*12=84 factors) at the time the count was taken.
Input: EditedHeader Table
(Installation Date, Count Cycle) CorrectedCounts Table
(RecordID, CovSysID, Count1, Count2, Count3) StationInventory Table
(Axle Factor, ATR Group)
Seasonal Adjustment Factors Table (Seasonal Factor)
Process: For every CovSysID we seek to generate an AADT. The installation date is obtained from the Edited Header table to obtain the month and day of the week (DOTW). The Count Cycle tells us what year this AADT will be for. The Axle Factor and ATR Group come from the Station Inventory table. The axle factor is applied to the raw counts to generate a daily volume. This is not stored. It is used in the AADT calculation. The ATR Group, the month, and the day of the week are used to look up the Seasonal Factor. The AADT is stored in a new, Factored AADT table.
Output: In this process we are creating a new FactoredAADT table. In this table we are copying in two fields (CovSysID from the Corrected Counts table and the Count Cycle from the Edited Header table) and generating values for a third new field (AADT).
22 Factored AADT
CovSysID AADT Count Cycle FLAGS Acceptability
CL1 CL2 SL1 SL2
NULL NULL NULL NULL
Additional flag fields will also be added which will be used in the next process (Control Limit and Spatial Testing Process). For now, these flag fields will be filled in with NULL values. Finally, there is a one more flag that indicates the final acceptability of the AADT after all is said and done. This field is also filled with NULL values.
Edited Data
Factoring Process
Factored AADT Table PROGRAM
Station Inventory Table Seasonal Adjustment
Factors Table
Control Limits and Spatial Limits Testing Process
This process looks at all the AADTs that have been generated to find suspect values. That is, this process uses statistical algorithms to identify significant variability in AADT values, whether via control limits or via spatial testing. In doing so it identifies values that, for whatever reason, may be incorrect. These are then flagged. The purpose of this process is to set the flags for the AADT's that have suspect values.
Input: Factored AADT Table
Process: Statistical analysis that remains to be fully defined and developed. A spatial statistical examination and a control limit examination are examples of two possible checks, among others yet to be decided upon.
Output: A flag in the AADT table for each control limit or spatial violation resulting in a Tested AADT table.
It should be noted that at the present the control limit and spatial testing constraints have not yet been defined. In the table we merely show two control limit constraints (CL1, CL2) and two spatial testing constraints (SL1, SL2) for illustrative purposes. In the future, the exact number and nature of these constraints will be determined.
Tested AADT Table
CovSysID AADT Count Cycle FLAGS Acceptability
CL1 CL2 SL1 SL2
NULL FLAG FLAG NULL Suspect Factored
AADT Table
Tested AADT Table Control Limit and
Spatial Testing Process PROGRAM
Flag fields are NULL Flags inserted for
24
Investigation Process
Investigation
The process incorporates this analysis at two points, the Flagging Process and the Control Limit and Spatial Testing Process. The analyst will initiate the analysis due to flags indicating anomalous data that are output of these two processes. In each instance, the investigation may result in the editing of data that would require the reprocessing of one or more records through one (Flagging) or both processes.
The Investigation Process is initiated when a data record (whether count data or AADT data) is flagged as not conforming to a rule or exceeding a statistical limit. The analyst performs a manual comparative evaluation of current and historic count and AADT data. This evaluation generates an assessment of whether the variability occurring at a station is consistent with its history. Stations that are inconsistent will result in a recount (when practical). Areas where more than one station deviates from historic characteristics require investigation to determine if changes in land use or the highway system justifies the change in traffic. A record of these assessments and information gained from any investigations are recorded in the Analysis Documentation Table. This information is used as the basis for accepting/not accepting current year data that has been flagged. When a recount is collected, the Acceptance Process for both the original and recount AADT data is performed simultaneously.
Input: All data resources. Anything available to the analyst.
Process: Use all resources to investigate flags and resolve and/or document them. Output: Analysis Documentation table.
Documentation
Prior to the acceptance process the analyst is looking at all of the control limit and spatial testing flags from the Tested AADT table and making notes to document their thinking and analysis. These notes are recorded in a table called Analysis Documentation. The process of investigation and documentation can be triggered by either the Flagging Process or the Control Limits and Spatial testing processes.
Input: Tested AADT tables
Process: Reviewing the flags in the AADT table during the Acceptance Process the analyst documents his/her remarks
Output: Analysis Documentation table with completed fields. The Analysis Documentation table is a textual record of what the analyst did and thought about and considered in making his/her decision on acceptability.
Investigation
Process Analysis
This process can occur prior to, as a result of, or during the acceptance process. Documentation captures the analyst’s thinking and reasons for making a decision of acceptable or not acceptable for an AADT value.
Note that analyst flags are the third of 3 types of flags. The first is business rule flags (based on logic) and the second is control limit and spatial analysis flags (based on statistics).
Analysis Documentation
CovSysID CountCycle Analyst Entry Date Analyst Flags Remarks
2219 DWANCHOCK 7/24/2003 (MDL-1)(RC-1)(TD-1)
(TN-1)(AOK-0)
Flags caused by 2001 counts
2246 DWANCHOCK 7/24/2003 (TD-1)(TN-1)(AOK-0)
26
Acceptance Process
This process involves an analyst looking at flag combinations, data collected in the investigation process, and the characteristics of the same data at neighboring stations to determine the acceptability of each AADT. The analyst looks individually at each AADT. Using flag data, and any other data he deems necessary, the analyst sets the flag to accepted or not accepted.
Input: Tested AADT Table - all acceptance fields set to NULL, flags exist for suspect AADT values
Process: Evaluate the acceptability of the AADTs
Output: Accepted AADT Table - all acceptance fields filled in (accepted or not accepted)
Note that control limit and spatial testing flags (based on statistics) are the second of the 3 total types of flags. The first is business rule flags (based mostly on logic) and the third is analyst flags (based on judgment).
Accepted AADT Table
CovSysID AADT Count Cycle FLAGS Acceptability
CL1 CL2 SL1 SL2
NULL FLAG FLAG NULL Accepted
Tested AADT Table
Analysis Documentation
Table
Person Accepted or Not accepted Values inserted into
acceptability field Acceptability fields
are NULL
Accepted AADT Table Acceptance
DATABASE ORGANIZATION
Overall Organization
The following pages contain full descriptions of the database tables proposed herein. Those included are listed below.
Table Name
1 Keyed Header 2 Keyed Station Data
3 Converted Header (Corrected Header, Edited Header)
4 Converted Station Data (Corrected Station Data, Edited Station Data) 5 Converted Counts (Corrected Counts)
6 Business Rule Flags (Edited Business Rule Flags) 7 Station Inventory
8 Seasonal Adjustment Factors
9 Factored AADT (Tested AADT, Accepted AADT) 10 Analysis Documentation
11 Interstate Ramp Inventory 12 Machine Inventory
Database Table Definitions
28
Keyed Header
This table contains the data from the header portion of each completed field sheet. This data applies to all subsequent data entries on the field sheet.
Keyed Header (PageID, Technician, Date, County, Urban, Type, ProjectID, InstallDay, InstallDate, CountCycle)
Page ID - a unique identifier for header data for a set of counts
Technician - a unique identifier for the field technician who collected the counts County - the name of the county in which the count was taken
Urban - the name of the urban area in which the count was taken Type - the type of count
ProjectID - an identifier for special projects
InstallDay - the day of the week the machine was installed InstallDate - the calendar date the machine was installed CountCycle - the count year that a count is taken at this location
Keyed Station Data
This table contains the data from the completed field sheet with four added fields - RecordID, PageID, KeyerID, and KeyedDate. All values in this table are text fields except that RecordID and PageID are integers, KeyedID is text, and KeyedDate is a date field. The table holds the data exactly as it was entered on the field sheet.
Keyed Station Data (RecordID, PageID, StationID, RouteID, Location, Direction, MachineID, Count1, Count2, Count3, Codes, Remarks, KeyerID, KeyedDate)
RecordID - a unique identifier for each count
Page ID - a unique identifier for header data for a set of counts
StationID - the unique identifier for the location in the county at which the count was taken
RouteID - a textual description of the route on which the count was taken Location - a textual description of the location where the count was taken MachineID - the unique identifier of the machine collecting the count
Count1, Count2, Count3 - the total number of axle pairs counted by the machine in a 24 hour period. Typically, only two counts are taken
Codes - this field identifies count events and road conditions
Remarks - a textual statement that provides additional information about the codes as well as any other pertinent information
KeyerID - a unique identifier for the office personnel typing in the data KeyedDate - the date the keyed data was typed in
Converted Header (Correcter Header, Edited Header)
Converted Station Data (Corrected Station Data, Edited Station Data)
Thsese three are exactly the same as the Keyed Station Data table except that they contain data types other that text. See the Converted Data Tables section of their report for the data type of each field.
In addition, the KeyerID and KeyedDate fields are dropped. Those two fields are not used beyond the Keyed Station Data table. Finally, the Count1, Count2, and Count3 fields are also removed.
Converted Station Data (RecordID, PageID, StationID, RouteID, Location, Direction, MachineID, Codes, Remarks)
RecordID - a unique identifier for each count
Page ID - a unique identifier for header data for a set of counts
StationID - the unique identifier for the location in the county at which the count was taken
RouteID - a textual description of the route on which the count was taken Location - a textual description of the location where the count was taken MachineID - the unique identifier of the machine collecting the count Codes - this field identifies count events and road conditions
Remarks - a textual statement that provides additional information about the codes as well as any other pertinent information
Converted Counts (Corrected Counts)
This table holds the raw count data. The raw counts that are recorded on the field sheets are entered.
Converted Counts (RecordID, CovSysID, Count1, Count2, Count3)
RecordID - a unique identifier for each count
CovSysID - a statewide unique identifier for this count station location
Count1, Count2, Count3 - the total number of axle pairs counted by the machine in a 24 hour period. Typically, only two counts are taken
Business Rule Flags (Edited Business Rule Flags)
Business Rule Flags (RecordID, 1, 2, 3, 4, 5, 6, 7, 8, 9, 10, 11, 12, 13, 14, 15, 16)
30
Station Inventory
The information required to fully describe the Coverage Count Program stations is contained herein. Note that some of the columns shown do not exist in the present program, and will be added to allow new reporting functions. Conversely, some of the existing columns may be deleted as the program matures.
Description
Column Name Type Description
CovSysID Number(8) Statewide unique station identifier CountyID Number (3) County unique identifier
UrbanID Number(3) Urban area identifier StationID Number(3) Station unique identifier Legacy
County/Urban
Number (3) Previous county/urban code
Legacy StationID Number (5) Previous StationID
Cycle Char(1) Count Cycle: A = all years, E = even years, O = odd years, V = variable
RouteCode Char(1) Route Type: 1 = Interstate, 2 = US, 3 = NC, 4 = SR, 5 = Local
RouteNumber Varchar2(25) Route number for numbered routes RouteName Varchar2(25) Street name, if applicable
Location Varchar2(40) Text description of station location AxleFactor Number(2) The axle correction factor for the station
Note 1
ATRGroup Number(2) The ATR group assigned to the station, seasonal correction
Note 1
Active Number(4) Year of activation Inactive Number(4) Year of deactivation LocStatus Char(1) Location information status
Note 2
Status Char(1) Active/Inactive
Notes:
1. Required for AADT computations.
Seasonal Adjustment Factors
This table gives the factor value used for calculating AADT for each specific ATR group for any given month and day of the week.
Seasonal Adjustment Factors (ATR Group ID, Month, Day, Factor Value)
ATR GroupID - specific group number for the different areas of use of an Automatic Traffic Recorder
Month - month that the count reading is taken
Day - day of the week that the count reading is taken
Factor Value - seasonal adjustment factor used as a multiplier in calculating AADT; depends on the ATR group, day of week, and time of the year
Factored AADT (Tested AADT, Accepted AADT)
The AADT table gives the traffic volume associated with a specific road FTSeg. Through a series of flags it also identifies AADT values that are in some way suspect.
AADT (CovSysID, AADT, Count Cycle, CL1 Flag, CL2 Flag, SL1 Flag, SL2 Flag, Acceptability)
CovSysID - Identification number of a count station; a numerical value that combines county and station ID number in one overall value; unique statewide. AADT - The traffic volume for this specific count station, measured as the number
of cars that pass over this location over a specific period of time - daily. CountCycle - Specific cycle of time used for counting cars at the count station (all
years, even years, odd years, or variably).
CL1 Flag - A flag whose positive presence means that control limit 1 has been violated.
CL2 Flag - A flag whose positive presence means that control limit 2 has been violated.
SL1 Flag - A flag whose positive presence means that spatial limit 1 has been violated.
SL2 Flag - A flag whose positive presence means that spatial limit 2 has been violated.
32
Analysis Documentation
The analysis documentation table stores data related to the performance of the analysis process.
Analysis Documentation (CovSysID, CountCycle, Analyst, Entry Date, Analyst Flags, Remarks)
CovSysID - a statewide unique identifier for this count station location
CountCycle - specific cycle of time used for counting cars at the count station (all years, even years, odd years, or variably).
Analyst - the name of the analyst entering the documentation Entry Date - the date the analyst entered the data for that record
Analyst Flags - a list of codes that represent a flag noted by the analyst as he/she performed the acceptance process
Remarks - comments recorded by the analyst regarding the flags and the acceptance process itself
Interstate Ramp Inventory
Interstate Ramp Inventory (RSeq, Route, Exit, CountyID, County Name, RampID, Direction, Flow, Description, Status, Open Year, Close Year)
RSeq - approximate mile number Route - the route number
Exit - the mile post identification for the exit or the name of the exit CountyID - the unique county identifier
County Name - the name of the county RampID - the unique ramp identifier
Direction - direction of flow on the main line the ramp services Flow - on or off
Description - a textual description identifying the ramp location
Status - the current status of a ramp (active, under construction, etc.) Open Year - the first count cycle the ramp was operating
Close Year - the last count cycle the ramp was operating
Machine Inventory (for counters)
This table simply records the status of each counting machine.
Machine Inventory (Machine ID, Status)
Machine ID - the unique identifier of a counting machine
USER INTERFACE
The user interface design is not a part of the present scope of work. The final user interface design will be done by Kent Taylor in conjunction with the GIS Unit. However, some general requirements and observations are presented here.
Three main functionalities need to be provided by the user interface. Display
Execute sub process Edit data
For display it is envisioned that the TSU will use ArcView8 with a Visual Basic interface. Visual Basic will be used to execute both ArcView commands and SQL commands. ArcView will be used in two capacities. The first is display and the second is “select.” The user interface will provide both a display and a menu. It will enable a user to select a geographic area using ArcView and then retrieve various data items identified by the Visual Basic menus. A further study of the user interface process is recommended.
TRACKING
The purpose of the tracking system is to generate reports on the status of the PTC process work. A number of types of reports are envisioned.
Management reports Supervisory reports Field reports
The reports may identify progress on data collection, data analysis, or counting and recounting. With respect to geographical display we would be interested in statewide, by county, or by “fenced” geographical areas also.
A further study of the tracking process is recommended. The full tracking process definition is out of the scope of the present study.
PUBLISHING
The publishing process is one of making final, accepted AADT data available to various customers and users.
34
data. At this point, the accepted AADT values that have been produced during the count year are moved into a table that is separate from the process that generates the AADT data. The point is that the publishing process is done for only the accepted data, and all at the same time.
When the data is published, it is made available to its customers. This can take several forms:
• The AADT volumes are entered on paper maps, and the maps are subsequently reproduced.
• The paper maps are scanned into digital images, and these images are made available on CD or via a web site.
• The data will be entered into a database that can be accessed interactively via a web site.
• For legacy customers, the data will be moved into a file on the mainframe.
• The data will be added to the archived AADT database.
ARCHIVING
The archiving process is one of making an archival copy of the data and storing it for future use. All tables in the database would be archived.
The archiving process involves adding the year’s worth of working data and published data into a repository of similar data for safekeeping and future reference. There are several sets of data involved in the archiving process: AADT data; keyed, corrected, and edited raw; and analysis documentation data.
•AADT – As each count year’s processing is complete, and the AADT data is published, the data is placed on a server with previous years’ data. So, in addition to being a safe place for the data, it also serves as a reference for historical AADT data, which is used in many aspects of the transportation planning process. Note that in the archive process, all AADT data is saved, including that which was not accepted, and therefore not published.
•Raw data – The original keyed data is preserved, once the typos have been corrected and the keyed data matches the field data sheets. In addition, the corrected data and the edited data are both preserved.
•Analysis data – In order to preserve the analysts’ flags and remarks, the analysis documentation table will be saved at publication time. The purpose of this is to allow the analysts access to previous years’ analysis.
The archiving process will include:
•Copying the data to CD for off-site backup.
•Copying the map images to CD for off-site storage.
•Moving the year’s worth of raw data (which has just been analyzed) from the working tables and adding it to a raw data archive, including the original raw data, the first set of converted data, and any records of the converted data that have been edited. This data must be available to the Investigation process.
•Making a CD backup of the raw data archive.
•Moving the year’s worth of analysts’ flags and free form remarks from the Analysis Documentation Table and adding it to an archive table. This data must be available to the Investigation process.
•Making a CD backup of the year’s worth of analysts’ flags and free form remarks.