LEVY, REBECCA ABAGAIL. A Control-Group Evaluation of the HELPS-Small Group Reading Fluency Program. (Under the direction of Dr. John Begeny).
by
Rebecca Abagail Levy
A thesis submitted to the Graduate Faculty of North Carolina State University
in partial fulfillment of the requirements for the degree of
Master of Science
Psychology
Raleigh, North Carolina 2015
APPROVED BY:
_______________________________ ______________________________
John Begeny Scott Stage
Committee Chair
BIOGRAPHY
TABLE OF CONTENTS
LIST OF TABLES ... vi
A Control-Group Evaluation of the HELPS-Small Group Reading Fluency Program ... 1
Oral Reading Fluency ... 2
HELPS One-on-One Program ... 3
Lack of School Resources ... 5
Small-group Reading Interventions ... 6
Importance of Manualized Interventions ... 9
RTI, Manualized Interventions, and Small-group Interventions ... 11
Ecological Validity ... 11
Purpose of Study ... 12
Method ... 13
Research Design ... 13
Participants ... 13
Student participants... 13
Assigning students to HELPS-SG... 14
Teachers and observers... 15
Setting... 17
Reading Assessment Materials ... 18
DIBELS-Next Oral Reading Fluency (DORF)... 18
Test of Word Reading Efficiency, Second Edition (TOWRE-2)... 20
Instructional Materials ... 21
HELPS Curriculum... 21
HELPS-SG implementation materials... 21
Procedures ... 22
Assessments... 22
Teacher training... 23
HELPS-SG procedures... 24
Individual assessments (Steps 1-2)... 25
HELPS-SG instruction (Steps 3-13)... 26
Results ... 27
Statistical Analysis Strategy ... 27
Principal Component Factor Analysis ... 28
Repeated-Measures Analysis of Variance ... 30
Implementation Integrity ... 30
Inter-rater Agreement ... 32
Discussion ... 32
Limitations and Future Directions ... 33
Sampling limitations... 33
Timeline and project adherence problems... 36
Future directions... 40
REFERENCES ... 44
APPENDICES ... 58
Appendix A: HELPS Program for Small Groups Implementation Flow Chart ... 59
Appendix B: Scripted Directions ... 60
Appendix C: Implementation Protocol ... 63
Appendix D: Checklist for Individual Assessment Implementation ... 66
Appendix E: Checklist for Small-group Implementation ... 67
Appendix F: Individual Progress Graph ... 70
Appendix G: Individual Progress Tracking Form ... 71
Appendix H: Group Star Chart ... 72
Appendix I: Group Progress Tracking Form ... 74
LIST OF TABLES
A Control-Group Evaluation of the HELPS-Small Group Reading Fluency Program According to the National Center for Education Statistics (NCES; 2011), when students perform at the Proficient level, their achievement “represents [a] solid academic performance” (p. 6). However, in the fourth grade assessment of U.S. students’ reading skills, only 34% scored at or above the Proficient level. Equally concerning, 33% of these students are reading below even a Basic level. In the area of reading fluency, a critical component of early literacy development, the most recent national data show that approximately 40% of fourth graders are “nonfluent” readers (Daane, Campbell, Grigg, Goodman, & Oranje, 2005). Furthermore, the Common Core State Standards (CCSS) support the need for fluency development beginning in the early elementary grades (National
Governors Association Center for Best Practices & Council of Chief State School Officers,
2010). There is an apparent discrepancy between the CCSS’s emphasis on fluency instruction and the actual fluency performance of U.S. students. The aforementioned information is important to highlight because academic performance in elementary school, specifically reading achievement, is not only important for a student’s childhood, but can influence the course of his or her life.
Furthermore, students who dropout of high school often miss out on opportunities that would otherwise be available to them if they earned a high school diploma: attending college and following certain career paths. For example, in 2010, young adults who earned a bachelor’s degree made 114% more (based off of median incomes) than young adults who did not graduate from high school (Aud et al., 2012). It is also important to note that the occupations that are currently increasing in the U.S. workforce have higher literacy requirements than the jobs that are decreasing (Barton, 2000); students who are poor readers may have difficulty excelling in a job market that has increased literacy qualifications. Because performing well in reading and ultimately graduating from high school is important for an individual’s success in life, this study will focus on improving young struggling readers’ oral reading fluency performance.
Oral Reading Fluency
Oral reading fluency (ORF) is defined as a student’s ability to read with “speed, accuracy, and proper expression” (National Institute of Child Health and Human
Development [NICHHD], 2000, p. 3-1). The Instructional Hierarchy—developed by Haring and Eaton (1978)—explained that becoming fluent in a skill (i.e., reading) happens
Given the importance of reading fluency and the large number of students who do not read fluently, educators and reading researchers have developed and evaluated a range of ORF interventions and strategies. Evidence-based ORF interventions include the following: modeling, repeated readings (RR), phrase-drill (PD), progress monitoring, goal setting, cued-reading, feedback, and reinforcement (Morgan & Sideridis, 2006; Therrien, 2004). Therrien (2004) conducted a meta-analysis of RR intervention studies and found that certain
instructional components added to the RR intervention increased mean fluency effect sizes. Effective add-on strategies included: (a) cueing participants to focus on speed and
comprehension (ES= .94), (b) working with adult tutors (ES= 1.37), (c) receiving corrective feedback (ES= .51), (d) setting a performance criterion (ES= 1.70), and (e) charting students’ progress (ES= .57). Interventions such as these improved fluency for both learning disabled and non-learning disabled participants (Chard et al., 2002; Therrien, 2004). Furthermore, Morgan and Sideridis (2006) conducted a meta-analysis of the effectiveness of fluency interventions from single-subject design studies and found that goal setting, feedback, and contingent reinforcement were effective in improving students’ reading fluency.
HELPS One-on-One Program
Mitchell, & Whitehouse, 2012). For example, using 2nd grade participants, Begeny et al. (2010) compared the HELPS program to the Great Leaps Reading Program (Mercer & Campbell, 1998) and a control group, and found that only students receiving HELPS significantly outperformed the control group. Significant differences were found with measures of reading fluency, reading comprehension, sight word efficiency, and phonemic decoding; effect sizes ranged from 0.62-1.02. In another study, Begeny, Mitchell and colleagues (2011) used an experimental control group design to examine the effects of HELPS on struggling readers when implemented by school personnel. Students in the HELPS condition performed significantly better on all assessed measures of reading
performance compared to students in the control group, with effect sizes ranging from 0.50-1.05. This study also showed that both classroom teachers and teacher assistants could implement HELPS with strong implementation integrity following relatively brief training workshops and some follow up implementation feedback sessions.
Lack of School Resources
According to Oliff, Mai, and Leachman (2012), more than two-thirds of U.S. states are providing less funding to schools than they did in the year 2008, and budget cuts are causing schools to reduce the amount of time spent in the classroom. Due to less funding, teachers may be experiencing a substantial reduction in time and resources. The Metropolitan Life Insurance Company (MetLife; 2012) annual survey results indicate that 63% of U.S. teachers reported an increase in class size from the previous year. Furthermore, an annual survey of North Carolina teachers discovered that 38.5% of teachers believe class sizes are too large to have enough time to meet all of their students’ needs (Hirsch & Maddock, 2012). It can be concluded from the aforementioned reports that teachers’ ability to do their jobs effectively and efficiently (e.g., improve students’ reading performance) can be increasingly more difficult if budget cuts are prevalent, class sizes are increasing, and class time is decreasing.
to save teachers time and increase classroom efficiency by working with more than one struggling student at a time.
Small-group Reading Interventions
Despite the strong research evidence showing the effectiveness of one-on-one ORF interventions (Chard et al., 2002; Morgan & Sideridis, 2006; Therrien 2004), initial research suggests that small-group reading interventions may be just as successful for some students. Vaughn et al. (2003) found that small-group reading interventions—when implemented with groups of 3 students—tend to be just as effective as one-on-one reading interventions on students’ reading fluency performance. Additionally, Gersten et al. (2008) recommend conducting reading interventions in a small-group format (3-4 students), and argue that small groups are “considered more practical for implementation” (p. 19).
Although there are many effective small-group reading interventions that can be found in the literature, few focus on reading fluency. In an exhaustive review of the empirical literature, only 10 studies were found that examined the effects of small-group reading
improvements, but only students who received the wide-reading intervention made
substantial comprehension improvements. In another study, Bonfiglio et al. (2006) conducted an experimental analysis in order to determine which small-group intervention package would be the most efficient while remaining effective for the participating students. The identified intervention package—which included taped-preview, error correction, and choral reading—was the most effective and efficient for improving students’ reading fluency, as measured in word correct per minute (WCPM). Also using a single-case experimental design, Begeny and Martens (2006) used an ABAB multiple-baseline design to examine the effects of a small-group ORF intervention across groups. The intervention consisted of multiple commonly used fluency strategies: choral reading, listening passage preview (LPP; similar to modeling), RR, and PD. Clear increases in WCPM from baseline to intervention indicated that the group fluency intervention improved students’ ORF.
More recently, Begeny, Braun and colleagues (2012) conducted a one-group pretest-posttest quasi-experimental design with a double pretest in order to test if seven elementary-aged participants’ reading achievement significantly improved after receiving the only known manualized small-group reading intervention that targets fluency (i.e., the HELPS Program for Small Groups; HELPS-SG). The pretest score was students’ growth from the fall ORF benchmark to winter ORF benchmark (i.e., from pretest 1 to pretest 2). The
periods, favoring students’ growth from pretest 2 to posttest and therefore providing some preliminary evidence for HELPS-SG (T= 0, p= .02). The authors also determined that the posttest scores of all but one student exceeded nationally derived norms of ORF growth. Although these findings offered preliminary evidence for HELPS-SG, three major limitations were reported. The researchers had a limited sample size (N= 7), did not utilize a control group, and only used one outcome measure of reading (i.e., growth in ORF from a validated and commonly used ORF assessment).
2012). Clearly, more group design studies are needed to examine small-group interventions that target ORF.
Another important limitation of this research is that only one study (Begeny, Braun et al., 2012) examined a manualized intervention program. All other studies used intervention strategies and materials that were developed or used for the sole purpose of the research; those studies do not describe available materials or clear directions for day-to-day intervention implementation. The importance of this limitation is evidenced below. Importance of Manualized Interventions
If an intervention is insufficiently described for teachers’ use, then the teacher will most likely have a difficult time implementing the intervention with integrity. Manualized interventions are important for use in schools because they (a) provide teachers with specific procedures and detailed implementation instructions (Simmons et al., 2011) that may
Of these reasons for using manualized interventions in schools, there is also empirical research evidencing its importance. For example, Schoenwald and colleagues (2008)
conducted a study examining the maintenance outcomes of a popular manualized therapy— Multisystemic Therapy (MST)—on youth’s behavior change. The researchers focused on therapist adherence to the MST protocols; they found that participants whose therapists followed the guidelines more strictly improved more so than other participants. Although this article did not focus on a school-based intervention, it supports the use of manualized
interventions with youth.
problem-solving systems such as Response to Intervention (RTI). The next section will discuss the connections between RTI, manualized interventions, and small-group interventions. RTI, Manualized Interventions, and Small-group Interventions
RTI is a problem-solving framework that is increasingly being used by more schools (Denton, 2012; Gersten et al., 2008). According to Gersten and colleagues, RTI combines “universal screening and high-quality instruction for all students with interventions targeted at struggling students” (2008, p. 4). According to Denton (2012), there are typically three tiers within RTI systems. Tier 1 is class wide instruction, or “primary prevention” (p. 233), with universal screening. Tier 2 is the first level of intervention for struggling students, and provides struggling students with supplemental, often small group, instruction. At this Tier of support, prescriptive problem-solving is commonly used (see Begeny, Schulte, and Johnson, 2012, p. 18), which means that a specific research-supported (often manualized) reading intervention is provided for all students who are known to lack the same targeted skills. Lastly, Tier 3 interventions are more intensive and are only necessary when students fail to respond to Tier 1 and Tier 2 instruction, and in this Tier it is more common for individualized (rather than prescriptive) problem-solving. Creating manualized interventions that fit into the RTI framework should enhance schools’ capacity to use RTI successfully, but such
interventions can also be well-suited for schools using other approaches to assisting struggling learners (Begeny, Schulte, & Johnson, 2012).
Ecological Validity
supposed or assumed to have by the investigator” (p. 516). In other words, when a study is ecologically valid the study is conducted in the most appropriate setting for what behavior is being observed. Ecological validity is important because it allows researchers to interpret and apply their findings to the real world because the studies are conducted in a “true
environment” (Schmuckler, 1997, p. 421). Furthermore, an ecologically valid study must contain naturalistic features across the setting, stimuli, and observed behaviors (Schmuckler, 1997). In sum, an ecologically valid study will (a) take place in a real-world environment, (b) use materials and people that are typically found in that environment, and (c) measure
behaviors that coincide with that environment. Purpose of Study
The overall rationale for this study is supported by the following: ORF is a necessary skill in students’ reading development, schools often lack resources for one-on-one
interventions, there are numerous advantages to using manualized interventions, and small-group reading interventions show promise as an effective practice for improving students’ fluency. However, more studies are needed to demonstrate the effectiveness of these small-group practices—particularly well-powered, ecologically valid, control-small-group designs. Given this rationale, the purpose of this study is to use a non-randomized control-group design to evaluate the effects of HELPS-SG implemented by teachers with their second and third grade struggling readers.
suggesting that students who receive the HELPS-SG intervention tend to improve their reading fluency more than expected over time (Begeny, Braun et al., 2012), it is hypothesized that students who receive HELPS-SG will significantly improve their reading performance compared to the students who do not receive the intervention.
Method
The North Carolina State University Institutional Review Board approved all of the methodological procedures prior to commencing this study.
Research Design
A two-group pretest-posttest quasi-experimental design was used to determine if students receiving HELPS-SG would have a positive significant effect on their reading performance compared to students in a wait-list control group.
Participants
Students reading below the 10th percentile were not eligible for this study because it is likely these students would benefit from a more intensive reading intervention (e.g., 20-30 minutes of daily one-on-one reading intervention). Furthermore, students were excluded from participating in this study if they received special education services or pullout English as a Second Language (ESL) services. Due to school district-wide policies of not being allowed to share which participants received specific low-intensity (i.e., transitional) ESL services, it is uncertain which participants in this study received these transitional ESL services within their general education classrooms. Transitional ESL services are indirect in nature and for those ESL students who are nearly proficient in English; the general education teacher makes all accommodations for ESL students after consulting with the ESL teacher.
Originally 50 students were identified as participants for this study, however 4 participants moved, 3 students received HELPS-SG regularly from their teacher who learned the intervention from a prior research study, and 1 student was later determined to be
receiving special education services. This left a total sample size of 42 students; 24 second graders and 18 third graders. Of the 42 participants, 57.1% were White, 16.7% were Black, 14.3% were Hispanic, 7.1% were multiracial, 2.4% were Asian, and 2.4% were Native American. Furthermore, 59.5% (n= 25) of the sample was female, and the mean age was 8.18 (range= 7.08-9.67).
Lou et al. (1996) and Gersten et al. (2008) into consideration, it was expected that the
participants in the HELPS-SG condition would be assigned to homogeneous groups of 3 to 4 students based on ability. Reading ability was assessed with the HELPS placement
assessment (Appendix J) and the DORF results. Due to the participating school’s policies, teachers were in charge of determining which participants they would provide the
intervention to. Basing their decisions off of the Text Reading and Comprehension (TRC; Wireless Generation, 2007), a running record type of assessment with un-reported
psychometric characteristics, the participating teachers assigned eligible participants to the control or intervention group. Ultimately, 18 students received the intervention and 24 students were assigned to the control group. Despite what was asked of the teachers (to implement the intervention in groups of 3-4), the small groups ranged from 3-6 students.
A chi-square analysis for independence was conducted to ensure that the intervention and control groups were similar in age, ethnicity, and gender. This analysis determined that the intervention and control group did not significantly differ on the measures of age (χ2 (1) = 21.04, p= .46), ethnicity (χ2 (1) = 6.22, p= .29), and gender, (χ2 (1) = .206, p= .65).
Additionally, there were no significant differences found between the intervention and control groups at pretest on all of the included measures (which will be discussed below): DORF-Winter (t (40)= -.97, p= .34), TOWRE-SWE (t (40)= .02, p= .99), TOWRE-PDE (t (39.37)= -.65, p= .52), GORT-Fluency (t (40)= 1.16, p= .25), and GORT-Comprehension (t (40)= .53, p= .60).
Teachers and observers. Two female teachers employed in the school as
course of this study. Both of the participating teachers hold master’s degrees in education. Teacher A, who worked with all the second grade participants, had been a teacher for 23 years and at the participating school for 16 years. Teacher B worked with all third grade participants, had been a teacher for 16 years, and taught at the participating school for 4 years. Furthermore, Teacher A worked with each of her two groups for 30 total sessions, and Teacher B worked with one of her groups for 25 sessions and her other group for 26 total sessions. In sum, students in the intervention group received an average of 25.94 HELPS-SG sessions (range= 21-30; SD= 3.15). An independent t-test was conducted to determine if intervention group participants in the two different grades received a different number of HELPS-SG sessions. Results indicated that second grade participants (M= 28, SD= 1.95) received significantly more sessions than the third grade participants (M= 22.71, SD= 1.38; t (16)= 6.22, p < .001).
within 5 consecutive sessions (Begeny, Upright, Easton, Ehrenbock, & Tunstall, 2013), (c) correctly identify HELPS-SG core procedural mistakes with 100% integrity for 3 observed sessions, and (d) correctly identify HELPS-SG tips and reminders procedural mistakes with 90% integrity for 3 observed sessions. Furthermore, all RAs were trained and considered proficient in teacher feedback procedures for a prior research study evaluating the effects of feedback on teacher implementation integrity of HELPS-SG.
Setting
Reading Assessment Materials
DIBELS-Next Oral Reading Fluency (DORF). The DORF (Good, Kaminski, Cummings et al., 2011) is a measure of ORF and was developed according to the standards, procedures, and research associated with Curriculum-based Measurement (CBM; Deno, 1989). During each DORF assessment a student is presented with grade-level reading material and asked to read three consecutive passages, one minute per passage, while the assessor listens. During each timed reading, the assessor records any errors (e.g.,
substitutions, omissions, hesitations for 3 or more seconds) the student makes and ultimately determines the number of words read correctly per minute (WCPM). The median WCPM score represents the overall DORF score.
According to Good, Kaminski, Dewey et al. (2011) the DORF is a reliable
measurement of ORF. All of the reported reliabilities for second and third grade are above .90. The two-week alternate-form reliability coefficients range from .96-.97, the median reliability for immediate alternate-form coefficients range from .94-.97, and the two-week test-retest reliability coefficients range from .91-.93. The inter-rater reliability for both grade levels is .99.
Gray Oral Reading Test, Fifth Edition (GORT-5). The GORT-5 (Wiederholt & Bryant, 2012) is an individual, standardized, and norm-referenced text reading fluency measure that takes an average of 20-30 minutes to administer. This assessment examines accuracy and rate while also looking for prosodic features of a student’s ORF. The GORT-5 has two equivalent forms (A and B); each form has 16 reading passages with 5
comprehension questions associated with each passage, but students may not read all 16 passages due to basal and ceiling rules. Each administration of the GORT-5 yields multiple scores: rate, accuracy, fluency (combination of rate and accuracy), comprehension, and oral reading index (ORI; combination of fluency and comprehension score). The fluency and comprehension scores will be analyzed in this study.
The GORT-5 is considered to be a reliable measurement of reading fluency and comprehension. The coefficient-alpha for both forms A and B is .93 for fluency and .94 for comprehension. The alternate forms immediate reliability between forms A and B is .94 for fluency and .87 for comprehension. Test-retest reliability, which ranged from 1-2 weeks in delayed administration of the same form, is .90 for fluency and .82 for comprehension. Alternate forms reliability between form A and B (administered with a 1-2 week delay) is .88 for fluency and .77 for comprehension. The inter-scorer reliability for fluency and
comprehension is .99.
coefficients were considered to be strongly correlated with other commonly used reading measures.
Test of Word Reading Efficiency, Second Edition (TOWRE-2). The TOWRE-2 (Torgesen, Wagner, & Rashotte, 2012) assesses a student’s reading efficiency by having the student read real words (sight words) and nonwords (phonemic decoding). Consisting of two subtests—sight word efficiency (SWE) and phonemic decoding efficiency (PDE)—the TOWRE-2 is administered in approximately 5 minutes. The total word reading efficiency index (TWRE) is a combination of the two subtests, but in this study SWE and PDE will be reported and analyzed as separate measures. During each assessment session, the assessor has the student (a) read the SWE practice word list, (b) read the SWE test list for 45 seconds, (c) read the PDE practice nonword list, and (d) read the PDE test list for 45 seconds. During each subtest, the student is instructed to read as many words or nonwords as he or she can in the allotted time. The student’s score is the total words read correctly in the 45-second sessions.
The TOWRE-2 is supported as being a valid measurement of sight word efficiency and phonemic decoding efficiency. Criterion-validity was calculated by comparing multiple reading measures (e.g., DIBELS NWF, DORF, GORT-4 Fluency) to the TOWRE-2 subtests. The overall coefficient averages for reading measures were strongly correlated with SWE (.90) and PDE (.89).
Instructional Materials
HELPS curriculum. As previously discussed, the HELPS program uses eight common strategies (e.g. Therrien, 2004; Morgan & Sideridis, 2006) to improve students’ reading fluency. The HELPS curriculum (Begeny, Mann, Cunningham, & Tsuen, 2009), which was developed to use with the available HELPS programs (one-on-one and small-group), includes 100 reading passages with predetermined difficulty levels. The passages become slightly more difficult as a student moves through the curriculum, with Spache (1953) readability values ranging from 1.7-4.9. Passages are either narrative (i.e., fiction) or expository (i.e., non-fiction) and do not include pictures. All the Dolch sight words (Dolch, 1936) are included throughout the curriculum. Varying in types of narrators, verb tenses, and topics, the passages are intended to be age-appropriate and interesting for elementary-aged readers while giving them repeated practice with frequently used (e.g., Dolch) and novel words.
found in the curriculum. Four primary protocols make up the guidelines for implementing HELPS-SG correctly: (1) the implementation flow chart (Appendix A) consists of 13 core procedures of the HELPS-SG program; (2) the scripted directions (Appendix B) provide the teacher with a procedural script of the specific directions to say at each core step; (3) the extended implementation protocol (Appendix C), which helps the teacher learn and better understand the core procedures; and (4) the checklist for implementation (Appendix E) which acts as a procedural checklist of the core implementation adherence and the implementation quality (Tips and reminders; i.e., teaching characteristics and methods that implementers should use in order to best engage the students).
Procedures
Assessments. Approximately two and a half months prior to students being assigned to experimental group, the TOWRE-2 SWE and PDE measures (form A) and the GORT-5 Fluency and Comprehension measures (form A) were administered. At posttest, which began the day following the last intervention day, all participants were administered the alternate forms of the assessments that were used at the beginning of the study. Specifically, at posttest participants received the TOWRE-2 SWE and PDE measures (form B), and the GORT-5 Fluency and Comprehension measures (form B). All assessments were administered in assessor-student dyads by the primary investigator and other trained data collectors (graduate school psychology students and RAs) and occurred in an empty classroom in the
students receiving intervention and the spring benchmarks within 2-3 weeks of the last day of HELPS-SG intervention.
Teacher training. The primary investigator met HELPS-SG implementation criteria through training provided by the HELPS-SG developer and is considered “trained” because she is (a) able to implement HELPS-SG core procedures with 100% integrity 3 times within 5 successive sessions, and is (b) able to implement HELPS-SG tips and reminders protocol with 90% integrity 3 times within 5 consecutive sessions (Begeny, Upright et al., 2013). The participating teachers were trained during 2 separate 1.5-2 hour HELPS-SG workshops. One workshop occurred two months before the start date of the study, and the other workshop occurred one week before the start of the study. As part of research guidelines, teachers were told not to discuss the HELPS-SG procedures with any non-participating teachers.
The HELPS-SG workshops consisted of instructing teachers how to use the program (e.g., implementation protocol, scripted directions) and the associated forms (e.g., Star Chart, tracking forms, flowchart), and opportunities for practice with immediate corrective
feedback. Teachers had the opportunity to practice implementing HELPS-SG with the RAs and received feedback from the principal investigator and the RAs they practiced with. At the end of the training workshop, teachers were allowed to keep all provided implementation and practice materials for reference.
were able to implement HELPS-SG core procedures with 100% integrity 3 times within 5 successive sessions, and were able to implement HELPS-SG tips and reminders with at least 80% integrity 3 times within 5 consecutive sessions. To maintain teachers’ accurate
implementation of HELPS-SG, for the following three weeks of the study, the teachers were observed for one session a week. After these sessions, the RAs provided corrective feedback. These three additional sessions of feedback were provided to the teachers to ensure proper implementation of HELPS-SG due to several unexpected events in the school that seemed to have a significant impact on the normal school routine and schedule. Specifically, during the first six weeks of the study the school environment (as reported regularly by school staff and administration) was frenzied due to bad-weather days, delayed starts, early dismissals, field trips, and an atypically high number of student and staff absences due to illness. After the first six weeks of the study, the school climate reportedly returned to normal and teachers no longer received feedback from the RAs. Even though the school environment was frenzied for the first half of the study, HELPS-SG was reportedly implemented in a quiet classroom away from noise and other distractions.
unable to find time to conduct the individual assessment piece of HELPS-SG prior to each group session. As a way to provide support to the school and teachers, undergraduate volunteers who are trained in HELPS-SG procedures by the primary author conducted the brief individual assessments for each small group in the morning each day the students received the intervention from their teachers. The teachers then implemented the group portion of HELPS-SG with their small-groups later in the day.
HELPS-SG instruction (Steps 3-13). All core procedures are shown in the full implementation protocol (Appendix C) and summarized in the flowchart (Appendix A). However, to ensure clarity the procedures are also summarized below.
Once individual assessments for each participant were completed, the teacher then determined which flowchart path to follow. The students would reach the group reading goal (GRG) if at least half of the students met their IRG, and not meet the GRG if less than half met the IRG. After determining whether the students meet the GRG, the teacher will review the you/me game. The you/me game consists of students (“you”) and the teacher (“me”) earning points. Students were able to earn points if they are paying attention, following along, and putting in effort throughout the HELPS-SG session. Conversely, the teacher earned points if the students were not paying attention, following along, or putting in effort. Before the session began (at Step 5) a predetermined amount of points needed to win the you/me game was established and stated by the teacher.
Passage retell (Step 6) is when the students are instructed to reiterate what they remember from the passage, in sequential order. One student was randomly selected to say what happened in the beginning, another student was asked to say what happened next, and so forth until all students were called on once. During modeling (Step 7), the teacher read the entire passage aloud while sporadically pausing and calling on a random student from the group to read the next word in the passage. During the phrase-drill error correction procedure (Step 9) the students chorally practiced 3-7 word phrases that contained a word that at least one student read incorrectly during that session’s oral reading of the passage (based on Steps 5 and 8). Once the teacher concluded steps 1-10, she provided praise and feedback on the group’s reading performance and wrote in 1-3 stars on the group star chart (Appendix H). One star was earned if the students tried their best but did not win the you/me game or reach the GRG; two stars were earned if the students won the you/me game and tried their best; and three stars were earned if the students reached the GRG, won the you/me game, and worked their hardest. Lastly, the teacher wrote down all the information from that day’s session on the group progress tracking form (Appendix I).
Results Statistical Analysis Strategy
and is considered to have sufficient power to find results, if there are any to be found, in the following analyses. Furthermore, it is important to note, that all following analyses were conducted using the Statistical Package for the Social Sciences (SPSS; IBM Corp., 2010). Principal Component Factor Analysis
A principal component factor analysis (PCA) was conducted to examine whether all reading measures are psychometrically structured as a unified construct, and thus can be reduced down from 5 separate dependent measures to 1 unified measure of “reading performance.” The PCA included the following pretest measures: DORF-Winter, TOWRE-SWE, TOWRE-PDE, GORT-Fluency, and GORT-Comprehension. The results of this analysis showed a sufficient sample for factor analysis (Kaiser-Meyer-Olkin= .801),
in a PCA (Odum, 2011; Thompson, 2004), and this method is most widely used and understood (Tabachnik & Fidell, 2007).
Because one unified measure of reading performance was created for the first time point (i.e., pretest), a second PCA was run to provide a unified measure of reading
competence for the second time point (i.e., posttest). Similar to the first PCA, the second PCA included the following posttest measures: DORF-Spring, SWE, TOWRE-PDE, GORT-Fluency, and GORT-Comprehension. The results of this second analysis showed a sufficient sample for factor analysis (Kaiser-Meyer-Olkin= .796), explaining 64.03% of the variance, and Bartlett’s test of Sphericity (χ2 (10)= 101.21, p < .001) indicated correlations were significantly strong enough to be analyzed together. This analysis
determined all of the above-mentioned posttest reading measures makeup a unified construct with principal components or factor loadings ranging from .695-.908. For this second PCA, the regression approach was also used to create a new unified measure of posttest-reading performance. These two new unified variables (i.e., pretest and posttest reading performance) will be used in a repeated measures analysis of variance (RM-ANOVA) to evaluate
Repeated-Measures Analysis of Variance
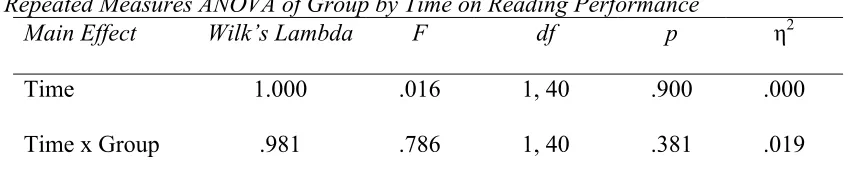
A RM-ANOVA was conducted to compare experimental groups on the unified measures of reading performance. In this analysis, the within-subjects factor was time (pretest vs. posttest) and the between-subjects factor was group (intervention vs. control). In this RM-ANOVA, homogeneity of variance and covariance was not violated, indicating that it is appropriate to report multivariate Wilk’s Lambda main effects; results are reported in Table 2. Results indicated there is no significant effect of time or significant interaction between time and group, suggesting there are no differences between the intervention and control group on reading performance.
Implementation Integrity
Implementation integrity of each teacher was conducted in vivo during 36% of the total teachers’ HELPS-SG sessions. The primary investigator and RAs used a procedural checklist(Appendix E)to maintain accurate records of the teachers’ small-group
Teacher A ranged from 25%-100%, and 70%-100% for Teacher B. An independent t-test was conducted to determine if the teachers’ average implementation integrity across sessions significantly differed. Results indicated that the second grade teacher and third grade teacher did not significantly differ on implementation of core procedures (t (38)= -1.13 p = .27). However, the second grade teacher and third grade teacher significantly differed on implementation of tips and reminders procedures (t (38)= -2.54, p = .015).
Furthermore, in order to be considered providing the intervention as intended, the following criteria were set by the HELPS-SG manual for interventionists to achieve for each session: all core procedures must be completed at 100% integrity, and all tips and reminders procedures must be completed at 90% integrity (Begeny, Upright et al., 2013). To further understand teachers’ implementation of HELPS-SG, a chi-square analysis for independence was conducted to determine if teachers significantly differed on meeting the aforementioned criteria across all sessions observed. This analysis determined that the teachers did not significantly differ on meeting criteria for the core procedures (χ2 (1) = 2.13, p= .14) or the tips and reminders procedures (χ2 (1) = 1.91, p= .17) across sessions.
integrity across volunteers was 92.1%. The average inter-scorer agreement of WCPM and WIPM across volunteers was 99% and ranged from 95%-100%.
Inter-rater Agreement
Inter-rater agreement across RAs was conducted via audio recordings for 41.7% of the all TOWRE assessments collected and for 29.7% of all the GORT assessments collected. Inter-rater agreement percentages were calculated with the following formula: number of agreements divided by number of agreements plus disagreements. For the observed TOWRE-2 assessments, RAs had a strong inter-rater agreement on both the SWE measure (M= 99.0%, range= 93.6%-100%) and the PDE measure (M= 98.1%, range= 83.8%-100%). For the observed GORT-5 assessments, RAs also had a strong inter-rater agreement on both the Fluency measure (M= 99.2%, range= 97.5%-100%) and the Comprehension measure (M= 99.3%, range= 80%-100%).
Discussion
inconsistent with previous research that suggests a treatment effect would be found when using the HELPS small-group and one-on-one programs (e.g., Begeny, Braun et al., 2012; Begeny, Laugle et al., 2010; Begeny, Mitchell et al., 2011).
There are two key explanations for these unexpected findings. First, HELPS-SG may not be effective compared to what the participating school was already using curriculum-wise within the classrooms, or effective with the specific students who were chosen to be
participants in this study. Although prior research would suggest a treatment effect, this study was unique to the small-group ORF intervention literature in that it had a slightly larger sample size and, unlike most other previous studies, included a control group. Second, the myriad of limitations in the study may have masked what would have otherwise been a treatment effect. The key limitations of this study will be discussed next.
Limitations and Future Directions
A multitude of limitations and threats to internal validity occurred across almost all aspects of this study. The overarching themes of all key limitations are grouped as such: sampling limitations, timeline and project adherence problems, and poor integrity with program implementation. These limitations will be discussed below, and then future directions in response to the limitations will be discussed.
Sampling limitations. First, students were not randomized to the intervention or the control group. The intervention teachers chose which of their students would receive
HELPS-SG, which may have resulted in two unequal groups. Although pretest measures showed that the two groups did not differ significantly on the reading skills that were
(e.g., student behavior, motivation, self-confidence). In addition, although attempts were made to measure several different reading constructs (e.g., fluency, phonemic decoding, comprehension), results of the factor analyses revealed that these assessments actually seemed to measure one unified construct—and as such, relevant reading skills (and possible differences between the groups on those skills) may not have been adequately assessed. These unmeasured group differences may have influenced the participants’ responsiveness to HELPS-SG. This indicates there was a lack of control within this study over individual idiosyncrasies between those students placed in the intervention and control groups.
Another lack of control within this study is that there were other teachers within the school that were trained in HELPS-SG for a different study. Despite the primary
Second, a small sample size limited the types of analyses that could be run for this study. In order to have enough power to be considered a “powered” study (.80; Faul et al., 2007), the individual reading measures needed to be unified into composite pretest and posttest measures. Despite that the analysis run for this study was deemed appropriate (Faul et al., 2007; Tabachnick & Fidell, 2007; Thompson, 2004), it would have been more
consistent with existing intervention research to have sufficient power to analyze the effects of HELPS-SG on the individual measures that are intended to assess reading fluency, reading comprehension, and word reading efficiency. Despite this study being a powered study by way of analyses used, a larger sample might have either detected differences between the groups at pretest on all or some measures, showing that the groups were different at the start from the group assignment process; or would have detected a possible treatment effect on all or some measures at posttest with a repeated measures multivariate analysis of variance (Tabachnick & Fidell, 2007).
(89% of the intervention group and 54% of the control group). Because the purpose of this study (and the primary intent of HELPS-SG) is to improve struggling reader’s ORF, the inclusion of many non-struggling readers (representing nearly half of the control group) may actually have decreased the likelihood of finding a treatment effect. However, because the sample size itself was relatively small to begin with, the 31% of participants who performed above the 35th percentile were not removed from the sample.
Timeline and project adherence problems. Regarding the timeline of this study, there were multiple gaps in both pretest assessment and intervention implementation due to multiple factors. First, the pretest standardized assessments (i.e., TOWRE-2 and GORT-5) were collected 2.5 months prior to the start of the intervention. In general, it is possible that students’ reading skills—especially in the early grades when skill deficits are being targeted in the classroom—may change over the course of 2.5 months. Thus, by starting the
intervention 8-12 weeks after the pretest assessments, it is an invalid assumption that participants’ pretest reading scores were consistent with their reading performance just before intervention began.
Tier 2 small-group intervention (Fuchs & Fuchs, 2009), it was common for the teachers and students to meet once or twice a week, rather than three times a week as recommended by the HELPS-SG manual (Begeny, 2013). Ultimately, if the participants received HELPS-SG as often as intended they would have received 39 sessions, however the participants only received an average of 26 sessions. These timeline problems may have influenced the effectiveness of the intervention and the participating teachers’ implementation integrity.
Poor integrity with program implementation. As noted previously, the teachers irregularly implemented HELPS-SG with their student participants throughout this study. Ultimately, the third grade students had fewer opportunities to receive the intervention and received significantly less intervention sessions than the second graders. Bad weather days (resulting in early student dismissal from school) were the main culprit of preventing regularity in intervention delivery, and this affected third graders’ intervention time more than the second graders’ due to the intervention teachers’ implementation schedule. Also, third graders received a week less of intervention than second graders because of school-wide testing. If third graders received as much intervention as the second graders, student performance on the posttest measures may have been impacted.
Another major limitation of implementation integrity is that the quality of instruction provided by the two participating teachers varied. Qualitative observations revealed that the two teachers had very different demeanors towards their students, which could have
or the steps of HELPS-SG that focus on quality of instruction and how much the teacher engaged the students, the participating teachers varied significantly. The teacher that worked with the third graders appeared to understand the tips and reminders better and reportedly was more likely to provide praise and motivate the participants than the teacher that worked with the second graders. Because the second grade teacher’s implementation integrity of tips and reminders was highly variable compared to that of the third grade teacher, second grade participants ultimately did not receive the intervention with the same quality as the third graders, which could also have limited the impact of the intervention due to poor
implementation integrity. Furthermore, both teachers did not reach 90% integrity for tips and reminders steps until much later in the study than expected. This is another indication that the teachers were having a difficult time learning, remembering, and implementing HELPS-SG tips and reminders steps correctly.
2013). Although HELPS-SG procedures allow interventionists to recruit some assistance with the individual assessments, it is recommended that interventionists conduct the
assessments with the child at least once per week. In the present study, interventionists never completed steps 1 and 2.
Lastly, HELPS-SG intervention sessions were much longer than prescribed, groups included a range in reading ability levels, and group sizes were varied. All intervention sessions ranged from approximately 15-20 minutes, however the HELPS-SG manual
suggests that the sessions should only last approximately 12 minutes. Needing more time for HELPS-SG implementation could be attributed to teachers’ lack of ease in using HELPS-SG or working with larger than recommended sized groups. The groups also consisted of a range of reading ability as measured by the pretest DORF. For example, one of the second grade group’s DORF scores ranged from 35-81 across participants. This large variation across scores indicates that the groups may not have been homogenous in reading ability; implementing HELPS-SG with homogenous reading ability groups is a suggestion for implementation within the HELPS-SG manual. Next, limitations regarding group sizes will be discussed.
small-group interventions (Gersten et al., 2008). Furthermore, Begeny, Levy, and Field (2014) recently conducted a small-group ORF intervention literature review and found that the average group size was approximately 4 students. Out of the 12 studies Begeny and
colleagues (2014) evaluated in their review, 8 of the studies used groups of 3-4 participants and only 4 of the studies used groups of 5 or more during the small-group ORF interventions. This indicates that the majority of the small-group ORF intervention literature used groups of 3-4 participants, supporting the smaller group size recommendation. In sum, HELPS-SG was not implemented exactly as intended over the course of this study.
if matched controls will improve as much as those who receive the researched small-group ORF intervention (Shadish, et al., 2002).
Additionally, it is recommend that future studies evaluating HELPS-SG use a
classroom quality measure, such as The Early Language and Literacy Classroom Observation Tool (ELLCO; Smith, Brady, & Clark-Chiarelli, 2008), to gain a truer understanding of how teacher quality influences implementation and treatment effects of HELPS-SG. This current study relied solely upon implementation integrity checklists as a quality measure, however using other measures, such as the ELLCO, may allow for additional insight about how teachers’ quality may influence HELPS-SG implementation and student outcomes.
Because the current study did not have the teachers collect the individual assessments required for HELPS-SG, despite it being prescribed by the intervention manual, it is
recommended that future HELPS-SG research focus on measuring the differences of student outcomes between groups with varying degrees of teachers collecting individual assessments. For example, one experimental group could have a teacher collect all the individual
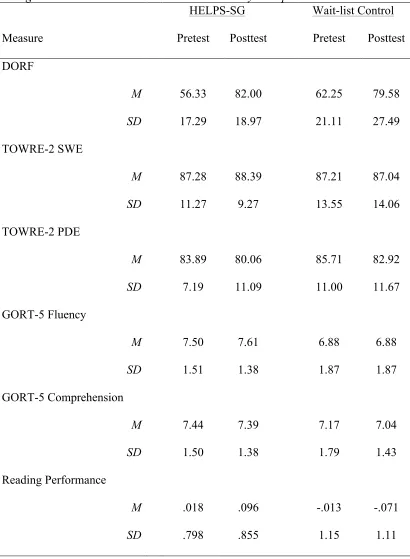
Table 1
Reading Measures Means and Standard Deviations by Group at Pretest and Posttest HELPS-SG Wait-list Control
Measure Pretest Posttest Pretest Posttest
DORF
M 56.33 82.00 62.25 79.58
SD 17.29 18.97 21.11 27.49
TOWRE-2 SWE
M 87.28 88.39 87.21 87.04
SD 11.27 9.27 13.55 14.06
TOWRE-2 PDE
M 83.89 80.06 85.71 82.92
SD 7.19 11.09 11.00 11.67
GORT-5 Fluency
M 7.50 7.61 6.88 6.88
SD 1.51 1.38 1.87 1.87
GORT-5 Comprehension
M 7.44 7.39 7.17 7.04
SD 1.50 1.38 1.79 1.43
Reading Performance
M .018 .096 -.013 -.071
Table 2
Repeated Measures ANOVA of Group by Time on Reading Performance
Main Effect Wilk’s Lambda F df p η2
Time 1.000 .016 1, 40 .900 .000
Time x Group .981 .786 1, 40 .381 .019
REFERENCES
Alexander, K. L., Entwisle, D. R., & Horsey, C. S. (1997). From first grade forward: Early foundations of high school dropout. Sociology of Education, 70(2), 87-107.
Aud, S., Hussar, W., Johnson, F., Kena, G., Roth, E., Manning, E., Wang, X., & Zhang, J. (2012). The condition of education 2012 (NCES 2012-045). U.S. Department of Education, National Center for Education Statistics. Washington, DC. Retrieved from http://nced.ed.gov/pubsearch.
Barton, P.E. (2000). What jobs require: Literacy, education, and training, 1940-2006. Washington, DC: Educational Testing Service.
Begeny, J. C. (2009). Helping early literacy with practice strategies (HELPS): A one-on-one program designed to improve students’ reading fluency. Raleigh, NC: The HELPS Education Fund. Retrieved from http://helpsprogram.org.
Begeny, J. C. (2011). Effects of the helping early literacy with practice strategies (HELPS) reading fluency program when implemented at different frequencies. School
Begeny, J. C. (2013). Helping Early Literacy with Practice Strategies for Small Groups (HELPS-SG): A program designed to improve students’ reading fluency. Raleigh, NC: The Helps Education Fund. Manual in preparation.
Begeny, J. C., Braun, L. M., Lynch, H. L., Ramsay, A. C., & Wendt, J. M. (2012). Initial evidence for using the HELPS reading fluency program with small instructional groups. School Psychology Forum: Research in Practice, 6(3), 50–63.
Begeny, J. C., Hawkins, A. L., Krouse, H. E., & Laugle, K. M. (2011). Altering instructional delivery options to improve intervention outcomes: Does increased instructional intensity also increase instructional effectiveness? Psychology in the Schools, 48(8), 769–785.
Begeny, J. C., Krouse, H. E., Ross, S. G., & Mitchell, R. C. (2009). Increasing elementary-aged students’ reading fluency with small-group interventions: A comparison of repeated reading, listening passage preview, and listening only strategies. Journal of Behavioral Education, 18(3), 211–228.
Begeny, J.C., Levy, R.A., & Field, S.A. (2014). Using small-group instruction to improve students’ reading fluency: An evaluation of the current research and suggestions for future investigations. Manuscript in preparation.
Begeny, J. C., & Martens, B. K. (2006). Assisting low-performing readers with a group-based reading fluency intervention. School Psychology Review, 35(1), 91–107.
Begeny, J. C., Mann, C. M., Cunningham, M. D., & Tsuen, H. Y. (2009). The helping early literacy with practice strategies (HELPS) curriculum: Instructional passages
developed for use with the HELPS program. Raleigh, NC: The HELPS Education Fund. Retrieved from http://helpsprogram.org.
Begeny, J. C., Mitchell, R. C., Whitehouse, M. H., Samuels, F. H., & Stage, S. A. (2011). Effects of the HELPS reading fluency program when implemented by classroom teachers with low-Performing second-grade students. Learning Disabilities Research, 26(3), 122–133.
Begeny, J. C., Schulte, A. C., & Johnson, K. (2012). Enhancing instructional problem solving: An efficient system for assisting struggling learners (pp. 3-15). New York, NY: The Guilford Press.
Begeny, J. C., & Silber, J. M. (2006). An examination of group-based treatment packages for increasing elementary-aged students’ reading fluency. Psychology in the Schools, 43(2), 183–195.
Begeny, J.C., Upright, J.J., Easton, J.E., Ehrenbock, C.A., & Tunstall, K.R. (2013). Validity estimates and functionality of materials and procedures used to monitor the
implementation integrity of a reading intervention. Journal of Applied School Psychology, 29(3), 284-304.
Begeny, J. C., Whitehouse, M. H., Methe, S. A., Codding, R. S., Stage, S. A., & Neupert, S. (2013). Do intervention-embedded assessment procedures successfully measure student growth in reading? Manuscript submitted for publication.
Bonfiglio, C. M., Daly, E. J., Persampieri, M., Andersen, M. (2006). An experimental analysis of the effects of reading interventions in a small group reading instruction context. Journal of Behavioral Education, 15, 93-109.
Bronfenbrenner, U. (1977). Toward an experimental ecology of human development. American Psychologist, 32(7), 513-531.
Chambless, D. L., & Ollendick, T.H. (2001). Empirically supported psychological
interventions: Controversies and evidence. Annual Review of Psychology, 52, 685-716.
Chapman, C., Laird, J., Ifill, N., and KewalRamani, A. (2011). Trends in High School Dropout and Completion Rates in the United States: 1972–2009 (NCES 2012-006). U.S. Department of Education. Washington, DC: National Center for Education Statistics. Retrieved from http://nces.ed.gov/pubsearch.
Chard, D. J., Vaughn, S., & Tyler, B. J. (2002). A synthesis of research on effective interventions for building reading fluency with elementary students with learning disabilities. Journal of Learning Disabilities, 35, 386-406.
Department of Education, National Center for Education Statistics. Washington, DC: Government Printing Office.
Daly, E. J., III, Chafouleas, S., & Skinner, C. H. (2005). Interventions for reading problems: Designing and evaluating effective strategies (pp. 75-76). New York: Guilford Press.
Daniel S. S., Walsh A. K., Goldston D. B., Arnold E. M., Reboussin B. A., & Wood F. B. (2006). Suicidality, school dropout, and reading problems among adolescents. Journal of Learning Disabilities, 39, 507-514.
Deno, S. L. (1989). Curriculum-based measurement and special education services: A fundamental and direct relationship. In M. R. Shinn (Ed.), Curriculum-based
measurement: Assessing special children (pp. 1-17). New York, NY: Guilford Press.
Denton, C. A. (2012). Response to intervention for reading difficulties in the primary grades: Some answers and lingering questions. Journal of Learning Disabilities, 45(3), 232– 243.
Faul, F., Erdfelder, E., Lang, A-G., & Buchner, A. (2007). G*Power 3: A flexible statistical power analysis program for the social, behavioral, and biomedical sciences. Behavior Research Methods, 39, 175-191.
Foorman, B. R., & Torgesen, J. (2001). Critical elements of classroom and small-group instruction promote reading success in all children. Learning Disabilities Research & Practice, 16(4), 203-212.
Fuchs, D., & Fuchs, L. S. (2006). Introduction to response to intervention: What, why and how valid is it? Reading Research Quarterly, 41, 93-99.
Fuchs, D., & Fuchs, L.S. (2009). Responsiveness to intervention: Multilevel assessment and instruction as early intervention and disability identification. The Reading Teacher, 63, 250-252.
Fuchs, L. S., Fuchs, D., Hosp, M. K., & Jenkins, J. R. (2001). Oral reading fluency as an indicator of reading competence: A theoretical, empirical and historical analysis. Scientific Studies of Reading, 5(3), 239-256.
Gersten, R., Compton, D., Connor, C.M., Dimino, J., Santoro, L., Linan-Thompson, S., & Tilly, W.D. (2008). Assisting students struggling with reading: Response to
guide. (NCEE 2009-4045). Washington, DC: National Center for Education Evaluation and Regional Assistance, Institute of Education Sciences, U.S. Department of Education. Retrieved from http://ies.ed.gov/ncee/wwc/ publications/practiceguides/.
Good, R. H., Kaminski, R. A., Cummings, K., Dufour-Martel, C., Petersen, K., Powell-Smith, K., Stollar, S., & Wallin, J. (2011). Dynamic indicators of basic early literacy next assessment manual. Eugene, OR: Dynamic Measurement Group, Inc.
Retrievable from http://www.dibels.org.
Good, R. H., Kaminski, R. A., Dewey, E. N., Wallin, J., Powell-Smith, K.A., & Latimer, R. J. (2011). Dynamic indicators of basic early literacy next technical manual (draft). Eugene, OR: Dynamic Measurement Group, Inc. Retrievable from
http://www.dibels.org.
Haring, N. G., & Eaton, M. D. (1978). Systematic instructional procedures: An instructional hierarchy. In N. Haring, T. Lovitt, M. Eaton, & C. Hansen (Eds.), The fourth R: Research in the classroom (pp. 23-40). Columbus, OH: Merrill.
Hirsch, E., & Maddock, A. (2012). North Carolina teacher working conditions survey summary results. Retrieved from http://www.ncteachingconditions.org.
IBM Corp. (2010). IBM SPSS Statistics for Macintosh, Version 19.0. Armonk, NY: IBM
Corp.
Kazdin, A. E. (2011). Single-case research designs: Methods for clinical and applied settings (2nd ed.). New York, NY: Oxford University Press, Inc.
Klubnik, C., & Ardoin, S. P. (2010). Examining immediate and maintenance effects of a reading intervention package on generalization materials: Individual verses group implementation. Journal of Behavioral Education, 19(1), 7-29.
Kuhn, M. R. (2005). A comparative study of small group fluency instruction. Reading Psychology, 26(2), 127-146.
Lou, Y., Abrami, P.C., Spence, J.C., Poulsen, C., Chambers, B., & d’Apollonia, S. (1996). Within-class grouping: A meta-analysis. Review of Educational Research, 66(4), 423-458.
Retrieved from
https://www.metlife.com/assets/cao/contributions/foundation/american-teacher/MetLife-Teacher-Survey-2011.pdf
Mercer, C. D., & Campbell, K. U. (1998). Great Leaps reading program, Kindergarten–2nd grade. Gainesville, FL: Diarmuid.
Mercer, C. D., Campbell, K. U., Miller, M. D., Mercer, K. D., & Lane, H. B. (2000). Effects of a reading fluency intervention for middle schoolers with specific learning
disabilities. Learning Disabilities Research & Practice, 15, 179–189.
Morgan, P. L., & Sideridis, G. D. (2006). Contrasting the effectiveness of fluency
interventions for students with or at risk for learning disabilities: A multilevel random coefficient modeling meta-analysis. Learning Disabilities Research & Practice, 21(4), 191-210.
National Governors Association Center for Best Practices & Council of Chief State School
Officers. (2010). Common Core State Standards for English language arts and
literacy in history/social studies, science, and technical subjects. Washington, DC:
National Center for Education Statistics (2011). The nation’s report card: Reading 2011. National assessment of educational progress at grades 4 and 8, NCES (2012-457). Institute of Education Sciences, U.S. Department of Education; Washington, D.C.
National Institute of Child Health and Human Development. (2000). Report of the National Reading Panel. Teaching children to read: an evidence-based assessment of the scientific research literature on reading and its implications for reading instruction: Reports of the subgroups (NIH Publication No. 00-4754). Washington, DC: U.S. Government Printing Office.
Odum, M. (2011). Factor scores, structure and communality coefficients: A primer. Paper presented at the Annual Meeting of the Southwest Educational Research Association. San Antonio, TX.
Oliff, P., Mai, C., & Leachman, M. (2012). New school year brings more cuts in state funding for schools (pp. 1-14). Washington, D.C.
Reeves, J. (2010). Teacher learning by script. Language Teaching Research, 14(3), 241-258.
Rosnow, R. L., & Rosenthal, R. (1996). Computing contrasts, effect sizes, and counternulls on other people’s published data: General procedures for research consumers. Psychological Methods, 1, 331–340.
Schmuckler, M. A. (1997). What is ecological validity? A dimensional analysis. Infancy, 2(4), 419-436.
Schoenwald, S. K., Carter, R. E., Chapman, J. E., & Sheidow, A. J. (2008). Therapist
adherence and organizational effects on change in youth behavior problems one year after multisystemic therapy. Administration and Policy in Mental Health, 35, 379-394.
Shadish, W. R., Cook, T. D., & Campbell, D. T. (2002). Experimental and quasi-experimental designs for generalized causal inference. Boston, MA: Houghton Mifflin.
Simmons, D. C., Coyne, M .D., Hagan-Burke, S., Kwok, O., Simmons, L., Johnson, C., Zou, Y., et al. (2011). Effects of supplemental reading interventions in authentic contexts: A comparison of kindergarteners’ response. Exceptional Children, 77(2), 207-228.
Spache, G. (1953). A new readability formula for primary-grade reading materials. The Elementary School Journal, 53(7), 410-413.
Tabachnick, B.G., & Fidell, L.S. (2007). Using multivariate statistics (5th ed.). Boston, MA: Pearson.
Therrien, W. J. (2004). Fluency and comprehension gains as a result of repeated reading: A meta-analysis. Remedial and Special Education, 25(4), 252-261.
Thompson, B. (2004). Exploratory and confirmatory factor analysis: Understanding concepts and applications. Washington, D.C.: American Psychological Association.
Torgesen, J. K., Wagner, R. K., & Rashotte, C. A. (2012). Test of word reading efficiency, (2nd ed.). Austin, TX: Pro-Ed.
Vaughn, S., Linan-Thompson, S., Kouzekanani, K., Pedrotty Bryant, D., Dickson, S., & Blozis, S. A. (2003). Reading instruction grouping for students with reading difficulties. Remedial and Special Education, 24(5), 301-315.
experiential deficits as basic causes of specific reading disability. Journal of Educational Psychology, 88, 601-638.
Wasik, B. (2008). When fewer is more: Small groups in early childhood classrooms. Early Childhood Education Journal, 35, 515-521.
Wiederholt, J. L., & Bryant, B. R. (2012). Gray oral reading test, (5th ed.). Austin, TX: Pro-Ed.
Appendix A
HELPS Program for Small Groups Implementation Flow Chart
1. One-on-one assessment with each student in group, facilitated by any trained educator
2. Steps 1a – 1d are completed with each remaining student from the group.
3. Make decision about students meeting the Group Reading Goal (GRG)… At least ½ of the students meet _______OR_______ Less than half of the students the IRG (see table below) meet the IRG (see table below)
↓ ↓
(3a) Verbally acknowledge that group met GRG and earned a star; tell students they will practice a new passage (Passage B)
(3b) Acknowledge student improvements; tell students that they will practice
Passage A again ↓_________________________________________↓
↓
4. Review goals and rules of You/Me Game (0.5 min) ↓
5. Students read Passage aloud for 1st time (1.5-2 min) ↓
6. Passage retell (0.5-1 min) ↓
7. Model reading by teacher (1-2 min) ↓
8. Students read Passage aloud a 2nd time (1.5 min) ↓
9. Phrase Drill Error Correction (0.25-0.75 min) ↓
10. Students read Passage aloud a 3rd time (1.5 min) ↓
11. Enthusiastic praise and feedback for students; distribution of stars based on GRG and You/Me Game—3 stars maximum (0.5-1 min)
↓
12. Teacher records group information on group tracking form ↓
13. Teacher reviews flow chart for possible steps missed and records this info on tracking form
WCPM with Passage A WIPM with Passage A First Grade 80 or more 3 or less Second Grade 100 or more 3 or less Third Grade 120 or more 3 or less Fourth Grade 135 or more 3 or less
! a. ORF assessment with Passage A
! b. ORF assessment with Passage B (as needed)
! c. Record all data on Graph and offer praise and feedback about student’s retention score ! d. Record all information on Tracking Form