Mohammed mannaa1, Ahmed Abdel Bary2, Mona El Assal*3, Fathy Abdullah4
1
Pharmacist in Military Medical Academy. [email protected] 2
Prof.in Pharmaceutics and pharmaceutical Industries Department, Facultyof Pharmacy, Cairo University, Egypt. 3
Assoc. Prof.in Pharmaceutics and Pharmaceutical Technologie Department, Faculty of Pharmaceutical Sciences and Pharmaceutical Industries, FUE University, Egypt.
4
Prof.in Pharmaceutics and pharmaceutical Industries Department, Faculty of Pharmacy, El Azhar University, Egypt. *Corresponding author’s E-mail:[email protected]
Accepted on: 30-09-2016; Finalized on: 30-11-2016.
ABSTRACT
The objective of this study is to achieve the controlling dissolution rate of Metformin HCl, a freely water soluble antidiabetic drug. Solid dispersions microcapsules were prepared using solvent evaporation method which enclosed preparation of a uniform dispersion of Metformin HCl in (Hydroxy propyl methylcellulose k100, Ethyl cellulose, Eudragit RL PO, RS PO & Compritol 888 ATO). A two-factor, General factorial statistical design was used to quantitate the effect of polymer type (X1) and drug: polymer ratio(X2) on the release profile. Where polymer type and drug: polymer ratio were selected as independent variables, while Y1 (cumulative drug release after 1 hr. ) and Y2 (cumulative drug release in 3 hrs. ), Y3 (cumulative drug release in 10 hrs.),Y4 (angle of repose ) and Y5 (Hausner ratio) were selected as dependent variables. The solid dispersions were characterized for their in vitro- release rate. The optimized formulation was further characterized by Drug scanning calorimetry, infrared spectrophotometry, X-Ray Diffractometer and SEM analysis. A convenient statistical model was made and a significantly controlled release rate was exhibited .the optimized formulation was investigated by DSC, XRD, FTIR and SEM data which showed the crystalline nature of Metformin HCl in a solid dispersion, the statistical model helped us to recognize the effects of formulation variables on the dispersion.
Keywords: Metformin HCl, Solid dispersion, controlled release, factorial design, HPMC k 100, Ethyl cellulose, Eudragit RL, RS& Compritol ATO 888.
INTRODUCTION
ontrolled drug delivery is one which delivers the drug at a predetermined rate and controls release rate that maintain uniform blood level for a specified period of time. Controlled release drug delivery utilizes drug-encapsulating devices from which therapeutic agents may be released at controlled rates for long periods of time. Such systems are preferred over traditional methods of drug delivery due to numerous advantages including modifying of drug release rates, protection of fragile drugs and improve patient comfort and compliance1. Solid dispersion methods have been used widely in a various formulation to enhance dissolution rate and bioavailability of poorly water soluble drugs2, 3, 4, 5. Preparation of matrices with water insoluble and water swellable polymers using solid dispersion method is valuable in the production of controlled release products. Many studies have been reported in the literature for the preparation of controlled release system, using solid dispersion technique6, 7. The controlled release solid dispersions generally prepared by any of the methods: by dissolving the ingredients in a solvent followed by evaporation or by melting the active and inert ingredient. The carriers which are used include (ethyl cellulose, hydroxyl propyl methylcellulose, compritol ATO888, and meth acrylic acid copolymers).
The structure of the solid dispersion is monolithic wherein the drug molecules uniformly dispersed and it has a great advantage of avoiding the risk of burst release concerning the reservoir type, controlled release preparations. Both synthetic and biologically derived (natural) polymers have been extensively fulfilled as biodegradable polymers. Biodegradation of polymeric biomaterials includes cleavage of hydrolytically or enzymatically sensitive bonds in the polymer leading to polymer erosion8.
Metformin hydrochloride is an oral anti-hyperglycemic agent, an orally administered biguanide, which is widely used in the management of type II diabetes, shows incomplete absorption from the gastrointestinal tract and the absolute bioavailability is (50 –60 %) with a short plasma half-life of (1.5 -4.5 h). An obstacle to the more successful use of Metformin therapy is the high incidence of concomitant gastrointestinal symptoms, such as abdominal discomfort, nausea, and diarrhea9. The target of this study is to formulate and evaluate of sustained release (SR) microcapsules of Metformin HCl that would maintain the plasma levels of the drug for eight to twelve hours which might be sufficient for once daily dosing of Metformin HCL. Administration of a sustained-release Metformin dosage form once daily could reduce the dosing frequency and improve patients compliance10.the Full factorial experimental design is one of the best tools
Formulation, Optimization, and Evaluation of Solid Dispersions of metformin HCl Using
Factorial Design
C
to declare the effect of different variables on the parameters of any formulation.
A statistical model was developed to optimize the solid dispersions and a significantly controlled release rate and flow properties were declared with the optimized dispersion microcapsules.
MATERIALS AND METHODS
Materials
Metformin HCl was brought as a gift from Ferchem Srl Co., Milano (Italy), Eudragit RLPO, Eudragit RSPO were brought as a gift from Rohm pharma, GMBH (Germany).Hydroxy propyl methylcellulose. HPMC K100 and compritol ATO 888 were obtained from colorcon limited, Luna supplier. All of the other chemicals and solvents were of reagent grade.
Methods
Preparation of solid dispersions
Microcapsules were produced by solvent evaporation method11.By dispersing accurately weight quantities of Metformin HCl and polymers individually(ethyl cellulose 300 cps, Eudragit RLPO, Eudragit RSPO, compritol ATO 888 and HPMC K 100) dissolved at different ratios (1:1 to 1:4) in a solvent(combination of mixture dichloromethane: chloroform(1:1)with continuous stirring and evaporation in open air, subsequently the solid mass was pulverized and passed through sieve No 18 ,the sieved granules were stored at 25 °C in a well-closed container until use.
Formulation Design
General factorial design has 2 to 15 factors, each factor must have at least 2 levels and at most 100 levels, but the number of levels can be different for each factor. The number of runs is limited to 10000, thus there is no catalog of available designs. In this study general factorial design containing 2 independent variables evaluated. one of them X1(a type of polymer)at 5 levels (HPMC,EC, Eudragit RLPO, Eudragit RS PO and Compritol )and the other X2(drug -polymer ratio ) at 4 levels(1:1,1:2,1:3 and 1:4).The experimental trials were performed at 20 combinations.
Evaluation of Solid Dispersions
In-vitro Dissolution studies
The dissolution rate of Metformin HCl was estimated for all formulations using USP type II with six rotating basket, speed 100 rpm (Mumbai, India)12and the dissolution media utilized was 900 ml of HCl pH 1.2 for 2 hrs. then converted to phosphate buffer pH 6.8 at 37ºC by adding 30 gm of Tri- sodium orthophosphate.12 H2o13. At
suitable intervals, 5 ml of each sample was taken and assayed at 232 nm by UV-visible spectrophotometer and replaced by fresh dissolution media.
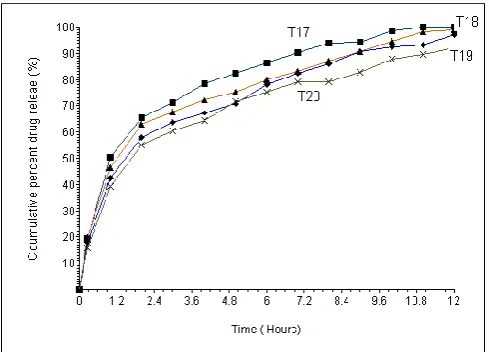
Figure 1: In-vitro release of Metformin HCL capsules containing drug Compritol
ATO 888 microcapsules (1:1, 1:2, 1:3, 1:4)
Fig (1) showing dissolution profile of Metformin HCL-compritol microcapsules at different ratios (1:1,1:2,1:3 and 1:4).The data were analyzed by MINI TAB SOFTWARE (version 17). Metformin HCl microcapsules were optimized based on the percentage drug release criteria test to confirm acceptance criteria of USP14 as follow:
Release at 1hr : 20 to 40% Release at 3 hrs. : 45 to 65% Release at 10 hrs. : Not less than 85%
Drug content and percent yield
Metformin HCl content of microcapsules was determined by an extraction method5. Microcapsules equivalent to (50mg) were weighed accurately, crushed and added to Methanol (20 ml) in volumetric flask and make up the volume with 100 ml 0.1 N HCl, And The solution is shacked well and filtered through whatman filter paper no 44 and 10ml of filtrate was taken out and diluted up to 100ml with 0.1 N HCl, again 2 ml was taken out and diluted up to 10 ml with 0.1 N HCl and absorbance was assayed spectrophotometrically at 232 nm against 0.1 N HCl as a blank, the percent yield of each formulation was also calculated.
Characterization the physical properties of the produced Metformin HCl microcapsules
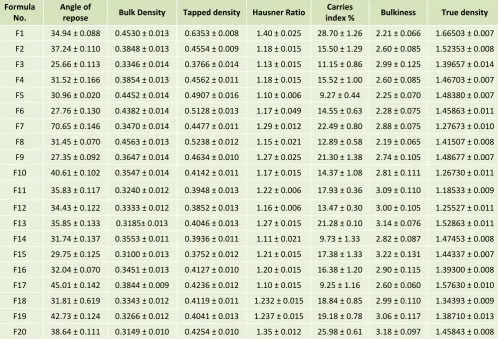
Table (1): Physical properties of the produced Metformin HCl microcapsules
Formula No.
Angle of
repose Bulk Density Tapped density Hausner Ratio
Carries
index % Bulkiness True density
F1 34.94 ± 0.088 0.4530 ± 0.013 0.6353 ± 0.008 1.40 ± 0.025 28.70 ± 1.26 2.21 ± 0.066 1.66503 ± 0.007 F2 37.24 ± 0.110 0.3848 ± 0.013 0.4554 ± 0.009 1.18 ± 0.015 15.50 ± 1.29 2.60 ± 0.085 1.52353 ± 0.008 F3 25.66 ± 0.113 0.3346 ± 0.014 0.3766 ± 0.014 1.13 ± 0.015 11.15 ± 0.86 2.99 ± 0.125 1.39657 ± 0.014 F4 31.52 ± 0.166 0.3854 ± 0.013 0.4562 ± 0.011 1.18 ± 0.015 15.52 ± 1.00 2.60 ± 0.085 1.46703 ± 0.007 F5 30.96 ± 0.020 0.4452 ± 0.014 0.4907 ± 0.016 1.10 ± 0.006 9.27 ± 0.44 2.25 ± 0.070 1.48380 ± 0.007 F6 27.76 ± 0.130 0.4382 ± 0.014 0.5128 ± 0.013 1.17 ± 0.049 14.55 ± 0.63 2.28 ± 0.075 1.45863 ± 0.011 F7 70.65 ± 0.146 0.3470 ± 0.014 0.4477 ± 0.011 1.29 ± 0.012 22.49 ± 0.80 2.88 ± 0.075 1.27673 ± 0.010 F8 31.45 ± 0.070 0.4563 ± 0.013 0.5238 ± 0.012 1.15 ± 0.021 12.89 ± 0.58 2.19 ± 0.065 1.41507 ± 0.008 F9 27.35 ± 0.092 0.3647 ± 0.014 0.4634 ± 0.010 1.27 ± 0.025 21.30 ± 1.38 2.74 ± 0.105 1.48677 ± 0.007 F10 40.61 ± 0.102 0.3547 ± 0.014 0.4142 ± 0.011 1.17 ± 0.015 14.37 ± 1.08 2.81 ± 0.111 1.26730 ± 0.011 F11 35.83 ± 0.117 0.3240 ± 0.012 0.3948 ± 0.013 1.22 ± 0.006 17.93 ± 0.36 3.09 ± 0.110 1.18533 ± 0.009 F12 34.43 ± 0.122 0.3333 ± 0.012 0.3852 ± 0.013 1.16 ± 0.006 13.47 ± 0.30 3.00 ± 0.105 1.25527 ± 0.011 F13 35.85 ± 0.133 0.3185± 0.013 0.4046 ± 0.013 1.27 ± 0.015 21.28 ± 0.10 3.14 ± 0.076 1.52863 ± 0.011 F14 31.74 ± 0.137 0.3553 ± 0.011 0.3936 ± 0.011 1.11 ± 0.021 9.73 ± 1.33 2.82 ± 0.087 1.47453 ± 0.008 F15 29.75 ± 0.125 0.3100 ± 0.013 0.3752 ± 0.012 1.21 ± 0.015 17.38 ± 1.33 3.22 ± 0.131 1.44337 ± 0.007 F16 32.04 ± 0.070 0.3451 ± 0.013 0.4127 ± 0.010 1.20 ± 0.015 16.38 ± 1.20 2.90 ± 0.115 1.39300 ± 0.008 F17 45.01 ± 0.142 0.3844 ± 0.009 0.4236 ± 0.012 1.10 ± 0.015 9.25 ± 1.16 2.60 ± 0.060 1.57630 ± 0.010 F18 31.81 ± 0.619 0.3343 ± 0.012 0.4119 ± 0.011 1.232 ± 0.015 18.84 ± 0.85 2.99 ± 0.110 1.34393 ± 0.009 F19 42.73 ± 0.124 0.3266 ± 0.012 0.4041 ± 0.013 1.237 ± 0.015 19.18 ± 0.78 3.06 ± 0.117 1.38710 ± 0.013 F20 38.64 ± 0.111 0.3149 ± 0.010 0.4254 ± 0.010 1.35 ± 0.012 25.98 ± 0.61 3.18 ± 0.097 1.45843 ± 0.008
Data Analysis
The response values for this study are Y1 (cumulative drug release in 1 hr),Y2 hrs (cumulative drug release in 3 hrs),Y3(cumulative drug release in 10 hrs,Y4(angle of repose) and Y5 (Hausner ratio).The multiple regression analysis was made using MINI TAB 17 software. Interaction plots and Contour plots are obtained from designed experiments by Analysis of data of full factorial design using ANOVA.The response values are subjected to multiple regression analysis to show the relationship between the factors and the responses values.
Formulations Optimization
The optimized formulation was estimated by using software MINI TAB 17 and applying constraints on dependent variables. one optimized formulation is obtained.The optimized batch(s) was further investigated by DSC,FTIIR, XRD, and SEM.
Differential Scanning Calorimetry
Differential Scanning calorimeter DSC60A, Shimadzu, japan was used. Samples (10mg) were weighted and sealed in flat-bottomed aluminum pans, then heated from 30oC – 450oC in an atmosphere of nitrogen. The thermograms of the products were obtained with
thermal analyzer equipped with advanced computer software programs at a scanning rate of 10°Cmin-1
Fourier Transform Infrared Spectroscopy (FT-IR)
Using FT-Infrared spectrophotometer, Perkin-Elmer, USA Infrared spectra of drug or polymer alone and drug-polymer microcapsules were measured at Functional Group Region (4000-1500 cm-1). For analysis, the disks were made by mixing a suitable amount of each sample with 200mg of KBr and compressing the mixture under high pressure. Each FTIR spectrum was obtained by averaging 16 scans at a resolution of 4 cm–1.
Powder X-ray diffraction studies
The X-ray diffraction patterns of the powdered samples were recorded using Philips X-ray diffractometer equipment model pw/1710 with copper tube anode target, voltage 40 kV, current 35 mA, scanning rate of 4°C. Samples (Metformin HCl, and microcapsules) were scanned over a range of 2θ angles from 4000-70000 at an angular speed of 0.02° per second.
Scanning Electron Microscopy
reduced pressure. The sample assembly was placed in the microscope and vacuum was applied. The microcapsules were observed under SEM.
RESULTS AND DISCUSSION
Data Analysis
The responses were recorded and data was analyzed using ANOVA. The individual parameter was evaluated using F-test and a polynomial equation for each response was generated using Multiple Regression analysis . Final Equation in Terms of Coded Factors:
Response: (Y1)
Y1 = 33.2143 + 28.524 X1(1) - 22.760 X1(2) + 5.440 X1(3) - 22.581 X1(4) + 11.377 X1(5) + 11.5990 X2_1 + 1.4990 X2_2 - 2.7037 X2_3 - 10.3943 X2_4+ 22.263 X1*X2(1) 1-2.971 X1*X2(1) 2- 1.681 X1*X2(1) 3 - 17.611 X1*X2(1) 4 - 5.303 X1*X2(2)1 - 0.653 X1*X2(2) 2 + 0.716 X1*X2(2) 3 + 5.240 X1*X2(EC) 4 - 4.236 X1*X2(3)1 + 2.880 X1*X2(3) 2 - 0.884 X1*X2(3) 3 + 2.240 X1*X2(3) 4 - 6.732 X1*X2(4) 1 + 0.334 X1*X2(4) 2 + 1.370 X1*X2(4) 3 + 5.028 X1*X2(4) 4 - 5.991 X1*X2(5) 1 + 0.409 X1*X2(5) 2 + 0.479 X1*X2(5) 3 + 5.103 X1*X2(5) 4
Response: (Y2)
Y 2 = 46.7532 + 33.2135 X1(1) - 24.0165 X1(2) + 4.4385 X1(3) - 32.5365 X1(3) + 18.9010 X1(5)+ 8.4595 X2(1) + 0.7915 X2(2) - 2.1065 X2(3) - 7.1445 X2(4) + 11.574 X1*X2(1) 1 - 1.458 X1*X2(1) 2 - 3.827 X1*X2(1) 3 - 6.289 X1*X2(1) 4+ 5.367 X1*X2(2) 1 - 3.828 X1*X2(2) 2 - 1.080 X1*X2(2) 3 - 0.459 X1*X2(2) - 9.385 X1*X2(3) 1 + 3.283 X1*X2(3) 2 + 4.448 X1*X2(3) 3 + 1.653 X1*X2(3) 4 - 4.643 X1*X2(4) 1 + 0.992 X1*X2(4) 2 + 0.490 X1*X2(4) 3 + 3.161 X1*X2(4) 4 - 2.914 X1*X2(5) 1 + 1.011 X1*X2(5) 2 - 0.031 X1*X2(5) 3 + 1.934 X1*X2(5) 4
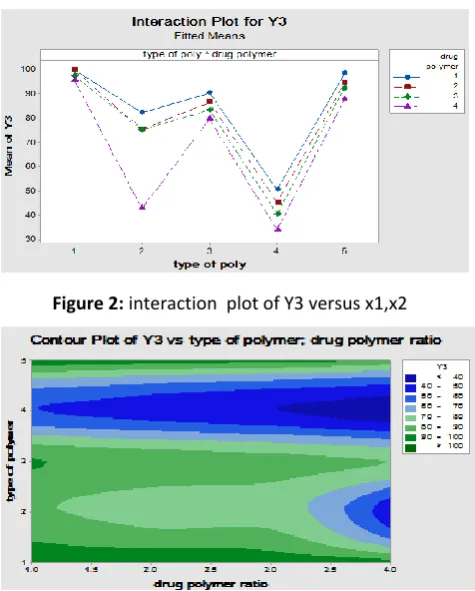
Response: (Y3)
Y3 = 77.653 + 20.597 X1(1) - 8.673 X1(2) + 7.455 X1(3) - 35.120 X1(4) + 15.740 X1(5) + 6.778 X2(1) + 2.700 X2(2) + 0.227 X2(3) - 9.705 X2(4) - 5.028 X1*X2(1) 1 - 1.117 X1*X2(1) 2 - 0.910 X1*X2(1) 3 + 7.055 X1*X2(1) 4 + 6.662 X1*X2(2) 1 + 3.753 X1*X2(2) 2 + 6.093 X1*X2(2) 3 - 16.508 X1*X2(2) 4 - 1.353 X1*X2(3) 1 - 1.242 X1*X2(3) 2 - 1.835 X1*X2(3) + 4.430 X1*X2(3) 4 + 1.222 X1*X2(4) 1 + 0.033 X1*X2(4) 2 - 2.260 X1*X2(4) 3 + 1.005 X1*X2(4) 4 - 1.504 X1*X2(5) 1- 1.427 X1*X2(5) 2 -1.087 X1*X2(5) 3 +4.018 X1*X2(5) 4
Response: angle of repose: (Y4)
Y4 = 36.423 - 3.249 X1(1) + 3.811 X1(2) + 0.386 X1(3) - 4.074 X1(4) + 3.126 X1(5) - 0.925 X2(1) - 2.590 X2 (2) + 4.522 X2(3) - 1.007 X2(4) + 6.028 X1*X2(1) 1 + 6.656 X1*X2(1) 2 - 12.040 X1*X2(1) 3 - 0.644 X1*X2(1) 4- 8.328 X1*X2(2) 1 - 9.883 X1*X2(2) 2 + 25.994 X1*X2(2) 3 - 7.783 X1*X2(2) 4 - 8.530 X1*X2(3) 1 + 6.395 X1*X2(3) 2
- 5.497 X1*X2(3) 3 + 7.632 X1*X2(3) 4 + 4.436 X1*X2(4) 1 + 1.981 X1*X2(4) 2 - 7.118 X1*X2(4) 3 + 0.701 X1*X2(4) 4 + 6.393 X1*X2(5) 1 - 5.149 X1*X2(5) 2 - 1.338 X1*X2(5) 3 + 0.094 X1*X2(5) 4
Response: hausner ratio :(Y5)
Y5 = 1.18383 + 0.04033 X1(1) - 0.05300 X1(2) + 0.01867 X1(3) - 0.05550 X1(4)+ 0.04950 X1(5) - 0.00050 X2(1) + 0.00083 X2 (2)- 0.02517 X2(3 )+ 0.02483 X2(4)+ 0.17967 X1*X2(1) 1 - 0.04167 X1*X2(1) 2 - 0.07233 X1*X2(1) 3 - 0.06567 X1*X2(1) 4 - 0.02700 X1*X2(2) 1 + 0.10167 X1*X2(2) 2 - 0.07567 X1*X2(2) 3+ 0.00100 X1*X2(2) 4 + 0.07133 X1*X2(3) 1 - 0.03667 X1*X2(3) 2 + 0.03933 X1*X2(3) 0.07400 X1*X2(3) 4 - 0.09450 X1*X2(4) 1 - 0.02250 X1*X2(4) 2 + 0.07350 X1*X2(4) 3 + 0.04350 X1*X2(4 ) 4 - 0.12950 X1*X2(5) 1 - 0.00083 X1*X2(5) 2 +
0.03517 X1*X2(5) 3 + 0.09517 X1*X2(5) 4
In ANOVA,values of "Prob > F" less than 0.05 indicate model terms are significant. In this case X1, X2, X1*X2 are significant terms.
The interaction plot of X1*X2 on Y1 showed that HPMC at level (1:1),and Eudragit RL at level(1:3) and compritol(1:4) showed the optimum release rate at 1 hr(20-40%). Contour plot of X1*X2 on Y1 shows that HPMC allows different cumulative percent of drug released after 1 hr using different drug polymer ratio. at level (1:1) drug to polymer ratio above 80 % of drug released. Increasing ratio at (1:2,1:3) percent of drug released decreased to be between(60-80%).At (1:4) level decreased the percent of drug released to be (20-40%).
The interaction plot of X1*X2 on Y2 showing levels (compritol,EUD RL,and EUD RS) at a drug : polymer ratio(1:4)showing the optimized release at 3 hrs (45-65%).The contour plot of X1*X2 on Y2 showed that Eudragit RS allows percent of drug release less than 20 % after 3hrs in all drug polymer ratio.Ethylcellulose at drug- polymer ratio (1:1,1:2) allows percent of drug release (20-40%) after 3hrs. when increasing the ratio to (1:3,1:4) percent of drug released decreased (less than 20 %). Compritol at (1:1, 1:2, 1:3)drug-polymer ratio released percent of drug range (40-60%) when increasing the ratio to (1:4) drug release percent decreased.
Figure 2: interaction plot of Y3 versus x1,x2
Figure 3: contour plot of Y3 versus x1,x2
The contour plot fig (3) showed that HPMC released percent of drug (90-100%) in all drug- polymer ratio after 10 hrs. Ethyl cellulose at level 1(1:1) released (80-100 %) after 10 hrs which decreased by increasing drug-polymer ratio (1:2,1:3) to be (70-80%) ,(20-40%)cumulative amount of drug release ratio.
the interaction plot of X1*X2 on Y4 and contour plot of both X1*X2 on angle of repose indicated that using HPMC (1:3), EC(1:2), Eudragit RL (1:1), Eudragit RS (1:3) and compritol (1:2) gives the minimum value for angle of repose which means good flow character .
The interaction plot and the contour plot of both X1*X2 effect on Y5 (Hausner ratio) indicated that using HPMC(1:3), EC(1:3), Eudragit RL (1:4),Eudragit RS (1:1) and compritol (1:1) gives the minimum value for Hausner ratio, less than 1.1 which means good flow character.
On the basis of dissolution studies of formulations and constraints applied,the results of factorial design suggested only one optimized combination of polymers by which maximum desirability has been achieved.The check out batch was selected for further studies.
3.2. Differential Scanning Calorimetric
The thermo gram of Metformin HCl (fig.4 (a)) did not show any endothermic transition between 30°C – 450°C because of its melting point at 230.051°C and an associated enthalpy 358.895 J/G indicating its anhydrous crystalline state.
In order to study Metformin HCl polymer interactions the analysis will depend on polymer characteristic thermal properties as follow:
Figure 4: the thermogram of Metformin HCL-compritol 888 ATO Microcapsules (a) Metformin HCL (b) Metformin HCL-compritol microcapsules (c) compritol ATO 888
Compritol ATO 888 polymer alone (fig.4(c)) showed a sharp endothermic peak, with a melting point at 69.635 o
C because of its crystalline nature and associated fusion enthalpy 118.124 J/G.
The DSC thermogram of Metformin-compritol microcapsules (fig.4(b)) showed a sharp endothermic peak at 232.295oC of Metformin an endothermic peak at 78.851 of compritol. This slight change of melting points of both of the components may be related to the dilution factor.
Fourier Transform Infrared Spectroscopy (FTIR)
FTIR spectrums of Metformin HCl and Metformin HCl-compritol microcapsules were applied from which we found 1-Pure Metformin HCl (fig.5(a)) shows characteristic bands from different functional group at:(3373.9-3299.5) cm–1 due to NH3 group primary stretching vibrations,(3173.2) cm–1 due to secondary stretching NH3 group, (1631.1-1573.4) cm–1 due to - C=N group stretching vibrations, and (1061,933.4) cm–1 due to C-N stretching vibrations and -NH out of plane bending. These results are in good agreement with the finding of other authors on Metformin HCl.
Figure 5: The FTIIR spectra of (a) Metformin HCL (b) Metformin HCL-Compritol microcapsules (c) compritol 888 ATO
Powder X-ray diffraction studies
X-ray diffraction studies were applied on Metformin HCl alone, polymer alone and drug loaded polymer.
1- X-ray diffraction pattern of pure Metformin HCl showed sharp numerous distinct peaks notably at 2θ angles, were 12.2°, 23.7°, 24.5°, 37.1° and 50°. This series of sharp and intense diffraction peaks were emphasized the crystalline state of pure Metformin HCl. 2- X-ray diffraction pattern of compritol ATO 888shows two peaks at 21° and 23 ° due to lipid Polymorphism.
3- The X-ray diffraction pattern of drug loaded microcapsules prepared by solid dispersion using compritol ATO 888 showed all the intense peaks of both the drug and the polymer. The crystallinity of drug in the solid dispersion was less than that observed before preparation. But the pattern still showing the typical signals of Metformin HCl but the intensity is weakened as shown in fig (6).
Figure 6: X-ray diffraction pattern of drug loaded microcapsules of Metformin with compritol 888 ATO
Scanning Electron Microscopy
Photo-microscopic technique was used to give us a clear picture about the shape and the surface of the pure crystalline powder of Metformin HCL and the prepared Metformin HCl microcapsules.
It was found that the majority of Metformin HCl microcapsules were irregular in the shape and the sizes of the tested formulae were different in diameters as shown in fig. (7). this was clear because the sample from each formula was taken before doing the sieve analysis.
Figure: 7 SEM of Metformin HCL-compritol micro capsules.
CONCLUSION
In present study, The results of experimental study showed that the factors(polymer type and drug : polymer ratio)significantly affects the dependent variables, Y1(cumulative percent drug release in 1 hr. ), Y2(cumulative percent drug release in 3 hrs.), Y3(cumulative percent drug release in 10 hrs.),Y4(angle of repose) and Y5(Hausner ratio). It was clear that the use of solid dispersions can control the drug release, which was achieved by dispersion in polymeric carriers, HPMC k100, Ethyl cellulose, Eudragit RLPO, Eudragit RSPO and Compritol ATO 888. On the basis of dissolution studies of formulations and goals applied the ratio of polymers and Metformin HCl required to control release of Metformin HCl was obtained and optimized using 2 factor general full factorial designs. The results of factorial design suggested only one optimized combination of the polymer by which maximum desirability obtained. The optimized batch was further studied by Drug scanning calorimetry, Infrared spectrophotometry, X-ray diffractometer and Scanning electron microscopy, which showed that Metformin HCl, did not lose the crystalline nature. In conclusion: Solid dispersion of Metformin HCl was found to be a useful technique for controlling release.
REFERENCES
1. DebjitBhowmik, HarishGopinath, B.PragatiKumar, S.Duraivel, K.P, SampathKumar, Controlled Release Drug Delivery Systems, The pharma. Journal, Vol.1 No.10, 2012, P24:32.
2. M. Ganesh B, Chandra Shekar,Y. Madhusudan,Design and Optimization of Rivaroxaban Lipid Solid Dispersion for Dissolution Enhancement using Statistical Experimental Design, Asian Journal of Pharmaceutics, 10(1), 2016, p59-64.
3. Shamsuddin, Fazil M, Ansari SH, Ali J.Devehamsuddin, Ali J,
Development and evaluation of the solid dispersion of spironolactone using fusion method,Int J Pharma Investig, 6(1), 2016, 63-68.
4. Shamsuddin, Fazil M, Ansari SH, Ali J,Atorvastatin solid dispersion for bioavailability enhancement,J Adv Pharm Technol Res, 7, 2016, 22-26.
5. Gerasimov AV, Varfolomeev MA, Ziganshin MA, Gorbatchuk VV, Rakipov IT, Klimovitskii AE, Thermodynamics of dissolution and infrared-spectroscopy of solid dispersions of phenacetin. JAdv Pharm Techno Res, 7, (2016), 6-12.
6. TappanKumargiri, kuleshKumar,Amit alexander, Ajazuddin, Hemant Badwaik, Dulal Krishna, Tripathi, Anovel and alternative approach to controlled release drug delivery system based on solid dispersion technique, Bulletin Faculty of Pharmacy Cairo Univ, vol 50, 2012, 147-159. 7. Fayeza Tahseen, A.B Gangurde, Formulation Development
and In-vitro Evaluation Of Sustained Release Tablets of Carvedilol Solid Dispersion, International Journal of
Pharmaceutical Research & Allied Sciences, Volume 3, 2014, 52-61.
8. D.S Kattia, S Lakshmia, R Langerb, C.TLaurencina,Toxicity, biodegradation and elimination of poly anhydrides, Advanced Drug Delivery Reviews, Volume 54, Issue 7, 2002, P 933–961.
9. Kamlesh J, Wadher,Arvind Bagde, Shailesh Ailwar, Milind Umeka, Formulation and evaluation of sustained release gastro-retentive dosage form of Metformin HCl , Der Pharmacia Lettre, 5 (2), 2013, 264-271.
10.Jagdale SC, Patil SA, Kuchekar BS, Chabukswar AR, Preparation and characterization of Metformin hydrochloride–compritol 888 ATO solid dispersion, JYoung Pharmacists, 3, 2011, 197-204 .
11.SunitaDahiya, RagineeOinker, Influence of polymethacrylates and compritolon the release profile of a highly water soluble drug Metformin hydrochloride, Ars Pharmaceutical, 56(1), 2015, 24-31.
12.Satish Pandav, Jitendra Naik, Preparation and In Vitro Evaluation of Ethylcellulose and Polymethacrylate Resins Loaded Micro particles Containing Hydrophilic Drug, Journal of Pharmaceutics, vol 14, 2014, 1-5 .
13.Shu X.Z., Zhu K.J., Song W., Controlled drug release properties of ionically cross-linked chitosan beads and the influence of anion structure, Int.J.pharm, 233(1-2), 2002, 217-25,
14. Rockville, MD, United States Pharmacopeia 32–National Formulary 27, 32(6), 2009, 1722-1735.