Article
Screening of Immunosuppressive Factors for
Identifying Breast Cancer Malignant Phenotypes
Using mRNA Microarray Datasets
Zhuoqi Liu 1, Xiaohong Yang 1, Yunlei Song 1, Bo Huang 2, Yingqun Xiao 2, Weifeng Zhu 1, Lehan Yu 1, Xi Liu 1, Fusheng Wan 1,* and Daya Luo 1,3,*
1 Medical College of Nanchang University, Nanchang 330006, China; [email protected] (Z.L.); [email protected] (L.Y.)
2 Department of Pathology, Affiliated Infectious Diseases Hospital, Nanchang University, Nanchang 330002, China
3 Jiangxi Province Key Laboratory of Tumor Pathogens and Molecular Pathology, Nanchang University, Nanchang 330006, China
* Correspondence: [email protected] (F.W.); [email protected] (D.L.)
Abstract: To screen and validate immunosuppressive factors in luminal- and basal-like breast cancer cell lines and tissue samples associated with malignant phenotypes. The mRNA microarray datasets, GSE40057and GSE1561, were downloaded and remodelled. Differentially expressed genes (DEGs) were identified. Enrichment analyses performed and the online resources, GOBO and Kaplan-Meier Plotter, were employed to screen for immunosuppressive factors associated with breast cancer malignant phenotypes. qRT-PCR and western blot were used to validate the expression of CD274 and IL8 in cell lines and immunohistochemical detected the MIF and VEGFA on tissue microarrays. The results showed that CD274 and IL8 were both upregulated in basal-like cell lines. That MIF expression was dramatically increased in patients with breast cancer metastases (p<0.05) and that VEGFA expression positively correlates with breast cancer pathologic grade (p<0.05).During the formation and development of breast cancer, immune-related genes are always activated, and immunosuppressive factors CD274, IL8, MIF and VEGFA are upregulated. Such molecules could be used as biomarkers for breast cancer prognosis. However, because individual immune-related factors can play several biological roles, the mechanistic relationship between immunosuppressive factors and breast cancer malignant phenotypes and the feasibility of their application as drug targets require further investigation.
Keywords: breast cancer; immunosuppressive factor; biomarker; online database
1. Introduction
Breast cancer is the most diagnosed malignancy and second leading cause of cancer death in women worldwide, with one in eight women developing this disease[1]. With the advent of gene expression profiling over the last 15 years, breast cancers have been classified into five categories: luminal A, luminal B, human epidermal growth factor receptor 2 (HER2 or ERBB2)-enriched, basal-like (BL), and claudin-low[2,3]. Among these categories, basal-basal-like breast cancer has garnered significant attention among researchers, as it accounts for ~75% of the highly malignant triple negative subtype. This biologically aggressive neoplasia takes on several malignant phenotypes, including early onset, higher histological grade, increased distant recurrence and visceral metastases, insensitivity to endocrine and targeted therapy and poor prognosis[4]. Although biomarkers for breast cancer prognosis and therapy[5] have markedly improved treatment decisions, inconsistent diagnostic criteria for BL breast cancer and controversial research findings necessitate the discovery of more specific molecular markers[6].
other factors in the tumour microenvironment[7]. The tumour microenvironment is composed of tumour cells, various types of stromal cells and the extracellular matrix, in which tumour cells and stromal cells interact by releasing a variety of cytokines, chemokines and growth factors[8]. In recent years, it has become apparent that tumour cells, as well as other cells and factors that accumulate in tumour-bearing hosts, play a critical role in patient outcome[9]. On one hand, a variety of immune cells can be induced to kill tumour cells. On the other hand, tumour cells have many strategies for escaping immune attack, including their release of immunosuppressive factors. The presence of immunosuppressive factors induces local regions of immunosuppression in the tumour microenvironment, which thwart anti-tumour immune responses and pose a major obstacle to many immunotherapeutic or conventional therapeutic approaches. However, due to the multifaceted functions of many immunosuppressive factors in different tumour types and stages of development, there remains controversy regarding their true and fundamental roles in tumour pathology. This ambiguity prevents the clinical application of immunosuppressive factors as diagnostic and therapeutic biomarkers.
In this paper, by comparing gene expression patterns between basal- and luminal-like breast cancer cell lines and tissue samples, which have different levels of aggressiveness and malignancy, we attempt to screen and verify the immunosuppressive factors associated with a malignant phenotype. These immunosuppressive factors could be used as additional markers to further tailor therapies for individual breast cancer patients.
2. Results
2.1.1. GO and KEGG Pathway enrichment analysis
To study the gene expression profiles of different breast cancer cell lines and tissue-based microarray datasets, GSE40057 and GSE46581 from the GEO database were downloaded, re-modelled, analysed and compared(Figure S1). The results showed that the number of statistically significant DEGs between cell lines and tissue samples were 2189 and 1963, respectively. Gene Ontology (GO) and KEGG pathway terms were performed for DEGs using the DAVID annotation analysis system (Table 1).
Table1 Functional clustering annotations using the DAVID resource
Count Percentage P-Value FDR GO TERM_MF_FAT
Top cluster for the set of GSE40057 differentially expressed genes (FDR: 0.05)
GO:0008092~cytoskeletal protein binding 90 4.217 3.37E-06 0.006
GO:0003779~actin binding 62 2.905 2.02E-05 0.033
GO:0005520~insulin-like growth factor binding 12 0.562 2.81E-05 0.046
Top cluster for the set of GSE1561 differentially expressed genes (FDR: 0.05)
GO:0008009~chemokine activity 19 0.977 1.15E-06 0.002
GO:0042379~chemokine receptor binding 19 0.977 3.38E-06 0.005
GO:0001871~pattern binding 37 1.903 1.80E-05 0.026
GO:0030247~polysaccharide binding 37 1.903 1.80E-05 0.026
KEGG_PATHWAY
Top cluster for the set of GSE40057 differentially expressed genes (P-Value: 0.01)
hsa04510: Focal adhesion 39 1.828 0.001 1.58
hsa04530: Tight junction 26 1.218 0.010 11.51
Top cluster for the set of GSE1561 differentially expressed genes (P-Value: 0.01)
hsa04110: Cell cycle 46 2.366 3.07E-10 3.81E-07
hsa03030: DNA replication 18 0.926 1.51E-06 0.00
hsa03430: Mismatch repair 11 0.566 5.35E-04 0.66
hsa04115: p53 signaling pathway 20 1.029 0.002 2.19
hsa00030: Pentose phosphate pathway 10 0.514 0.005 5.78
2.1.2 The expression of immune-related genes
According to the Cancer Inflammation & Immunity Crosstalk PCR Array profile from Qiagen (http://www.sabiosciences.com/rt_pcr_product/HTML/PAHS-181Z.html), a total of 84 key genes, including 16 immunosuppressive factors were enrolled for subsequent analysis. The Venn diagram (Figure 1a) shows the intersection between immune-related genes and DEGs from GSE40057 and GSE1561. There are 15 immune-related genes in GSE40057, including 4 immunosuppressive factors, CD274, CSF2, IL8 and TGFβ1; 32 immune-related genes in GSE1561; 6 immunosuppressive factors, CXCL12, CXCL5, IDO2, MIF, PTGS2 and VEGFA; and 6 immune-related genes in both. Interestingly, ccompared with the luminal-like(LL) cell lines and tissue samples, most immune-related genes identified in basal-like malignancies are upregulated, except CXCL12 (Figure 1b and 1c).
Figure1 The expression of immune-related genes in cell lines and tissue samples. (a) The Venn diagram shows the intersection between immune-related genes and DEGs from GSE40057 and GSE1561 (b-c) Hierarchical clustering analysis of Immune-related genes expression in Cell lines (b) and Tissue samples (c). Each row corresponds to an Immune-related genes and each column corresponds to an independent cell or tissue sample. The darker colour means a higher expression and the immune-related genes in red letters are thought to be immunosuppressive factors.
2.2.3 GOBO and Kaplan Meier Plotter analysis
Kaplan Meier Plotter (http://kmplot.com/analysis/), an open web-based resource[11], was used to determine the relationship between survival rate and mRNA expression levels of 6 immunosuppressive factor genes screened from tissue samples of GSE1561. Analysis of overall survival showed that lower CXCL12, CXCL5, IDO2 and PTGS2 mRNA expression levels were correlated with a comparatively lower survival rate (p<0.01), while lower MIF and VEGFA expression levels were correlated with a higher survival rate (p<0.01) (Figure S3).
2.2.4 CD274 and IL8 are highly expressed in BL breast cancer cell lines
To validate the expression pattern of CD274 and IL8, qRT-PCR and western blot were used to detect mRNA and protein expression from 4 breast cancer cell lines: 2 BL lines (BT549 and MDA-MB-231) and 2 LL lines (MCF7 and T47D)[12]. qRT-PCR results (Figure 2A) show that CD274 and IL8 were upregulated in the basal-like breast cancer cell lines, BT549 and MDA-MB-231 (p<0.01). Similar to qRT-PCR results, western blot analysis (Figure 2B) indicates that CD274 and IL8 protein were increased in BT549 and MDA-MB-231, compared to MCF7 and T47D cell lines.
2.2.5. Expression of MIF and VEGFA in breast tissue microarrays
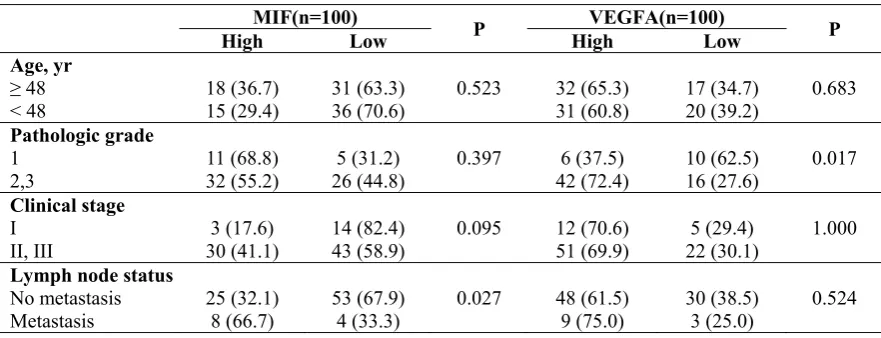
To determine whether MIF and VEGFA protein expression is associated with breast cancer malignancy, immunohistochemical detection was performed in tissue microarray with 90 primary tumour tissues and 10 normal breast tissue samples (p<0.01) (Figure 3). The results show that MIF expression is increased dramatically in the metastasis group (p<0.05) and that VEGFA expression positively correlates with tumour grade (p<0.05) (Table 2).
Figure 3 Immunohistochemical detection of MIF (Row 1) and VEGFA (Row 2) in breast cancer tissue microarray.(a) and (D), Negative expression in Cancer adjacent normal breast tissue. (b) and (e), Negative expression in Invasive ductal carcinoma. (c) and (f), Positive expression in Invasive ductal carcinoma. (Original magnification × 200; inset × 400)
Table2 Relationship between MIF, VEGFA expression level and clinico-pathologic parameters of breast cancer by tissue microarray
MIF(n=100) P VEGFA(n=100) P
High Low High Low
Age, yr
≥ 48 18 (36.7) 31 (63.3) 0.523 32 (65.3) 17 (34.7) 0.683
< 48 15 (29.4) 36 (70.6) 31 (60.8) 20 (39.2)
Pathologic grade
1 11 (68.8) 5 (31.2) 0.397 6 (37.5) 10 (62.5) 0.017
2,3 32 (55.2) 26 (44.8) 42 (72.4) 16 (27.6)
Clinical stage
I 3 (17.6) 14 (82.4) 0.095 12 (70.6) 5 (29.4) 1.000
II, III 30 (41.1) 43 (58.9) 51 (69.9) 22 (30.1)
Lymph node status
No metastasis 25 (32.1) 53 (67.9) 0.027 48 (61.5) 30 (38.5) 0.524
Metastasis 8 (66.7) 4 (33.3) 9 (75.0) 3 (25.0)
3. Discussion
GO term and KEGG pathway analysis based on DEGs reveals that malignant-phenotype-associated molecular mechanisms for breast cancer cell lines and tissue samples are different.
The breast tumour microenvironment consists of epithelial tumour cells and the extracellular matrix (ECM), including stromal cells such as fibroblasts, adipocytes, endothelial and resident immune cells, a multitude of soluble factors (such as growth factors, chemokines and cytokines), and more recently identified regulatory mediators, such as microRNAs, metabolites and exosomes[13]. Although cancer progression has been associated with genetic mutations and epigenetic changes in tumour cells, increasing evidence suggests that it is not entirely driven by cancer cell processes and may be influenced by the interplay between cancer cells and their surrounding microenvironment (i.e., tumour-stroma crosstalk)[14]. Such crosstalk is mediated either by cell–cell interactions or the regulatory factors mentioned above. There is evidence demonstrating that both stroma and tumour cells evolve upon tumour initiation and progression, which makes the tumour-stroma environment distinct from that of healthy tissue[15]. Upon its conversion from normal stroma, tumour stroma thwarts anti-cancer activities and promotes cancer progression[16]. Based on the aforementioned reasons, the molecular changes in tumour cells often do not reflect all the changes that occur during tumour-stroma crosstalk in the microenvironment[17]. In this paper, 2 original datasets, GSE40057 and GSE1561, were downloaded from the GEO database To avoid the inaccuracy produced by ‘edged’ samples, only 8 cell lines from GSE40057 and 32 tissue samples from GSE1561, representing basal-like and luminal-like groups were chosen for subsequent analysis. GO term and KEGG pathway analysis based on DEGs reveals that malignant-phenotype-associated molecular mechanisms for breast cancer cell lines and tissue samples are different, validating the above conclusion. Therefore, in the field of tumour immune research, the selection of model cell lines or tissue samples should be made based on research interests.
Tumour cells have many strategies for avoiding immune attack, including decreased tumour antigen expression by HLA molecules on the tumour cell surface, downregulation of tumour antigen presentation by dendritic cells, abrogation of T cell responses, release of immunosuppressive factors, activation of regulatory T cells and a cytotoxic effect of tumour cells themselves, such as the induction of Fas/FasL toward lymphocytes[18]. Among them, the release of immunosuppressive factors to induce immunosuppression is an important mechanism for tumour cell evasion of immune surveillance[19]. Immunosuppression is a reduction of the activation or efficacy of the immune system, and natural or pathological immunosuppression may occur as an adverse reaction to the body[9]. For example, both tumour cells and stromal cells can be induced to synthesize and/or secret immunosuppressive factors to evade immune surveillance, contributing to tumour initiation and progression[20]. To date, more than 20 immunosuppressive factors produced by tumour and/or stromal cells have been discovered, including transforming growth factor-β1 (TGFβ1)[21], prostaglandin E2 (PGE2)[22], vascular endothelial growth factor (VEGF)[23], interleukin-10 (IL-10)[24], interleukin-4 (IL-4)[25], cyclooxygenase-2 (COX-2)[26], programmed cell death 1 (PDCD1)[27] and cytotoxic T-lymphocyte associated antigen 4 (CTLA4)[28]. Although therapeutic agents that target immunosuppressive factors, such as BMS-936559, Pidilizumab and Ipilimumab, have achieved breakthrough responses in cancer immunotherapy and represent one of the most promising strategies for tumour treatment[9], other immunosuppressive targets are still under investigation, as their roles in tumour malignancy are not completely understood.
survival time and higher expression levels of CXCL12, CXCL5, IDO2 and PTGS2 revealed by KM analysis indicates that the general roles of immunosuppressive factors are not completely understood and warrant further investigation.
4. Materials and Methods
4.1.. Gene Expression Microarray Analysis
The expression monitoring arrays raw data were downloaded from Gene Expression Omnibus (GEO) database[34]with accession number: GSE40057[35] and GSE1561[36]. Principal components analysis (PCA), K-means clustering and differentially expressed genes screening were identified in R using Bioconductor and associated packages[37]. Enrichment analyses were performed for different expression genes using the DAVID functional annotation clustering tool (http://david.abcc.ncifcrf.gov)[38] and identified term enrichment for molecular function (GOTERM_MF_FAT) and KEGG_PATHWAY.
4.2. Cell culture and total RNA isolation
Breast cancer cell lines T47D and MDA-MB-231 were cultured in DMEM media supplemented with 10% fetal bovine serum (FBS), MCF7 was cultured in RPMI-1640 Medium with 10%FBS, BT549 was cultured in RPMI-1640 Medium with 0.023 IU/ml insulin and 10%FBS. Total RNA was extracted using the TRIzol® reagent (Invitrogen, Carlsbad, CA, USA).
4.3. qRT-PCR analysis of mRNA expression of CD274 and IL8
2 μg of the total RNA was reverse-transcribed using RevertAid™ First Strand cDNA Synthesis Kit (Thermo, Boston, USA). Quantitative RT-PCR was carried out using a SYBR® Premix Ex Taq™II (TaKaRa, Shiga, Japan). The primer sequences used for RT-PCR are as follows: CD274-Forward: CGTTGTGCTTGAACCCTTGA, CD274-Reverse: ACACAAGGAGCTCTGTTGGA; IL8-Forward: GAGACAGCAGAGCACACAAG, IL8-Reverse: TTGGGGTGGAAAGGTTTGGA; β -actin-Forward: GAACGGTGAAGGTGACAG, β-actin-Reverse: TAGAGAGAAGTGGGGTGG. Each sample was run in triplicate. Applied Biosystems® 7500 Real-Time PCR Systems (Thermo, Boston, USA) were used in the real time PCR reaction according to the manufacturer’s suggested protocols. Fold change in gene expression was calculated using ΔΔCt method.
4.4 Western blot analysis of protein expression of CD274 and IL8
Total proteins were extracted from cells in RIPA Lysis Buffer (Vazyme, Piscataway, NJ, USA) containing protease inhibitors. 40 μg of protein from each sample was denatured, fractionated by 10% SDS-PAGE, and transferred to PVDF membranes (Immobilon®-P Transfer Membrane, Millipore, Milan, Italy). After blocking of non-specific antigens with 5% skim milk solution, blots were incubated overnight at 4℃ with primary rabbit monoclonal antibodies against IL8 (1:1000 working dilution, DF6998, Affinity Biosciences, Cincinnati, USA) or CD274 (1:1000 working dilution, DF6526, Affinity Biosciences, Cincinnati, USA) or β-actin (1:1000 working dilution, Santa Cruz Biotechnology, Inc., Santa Cruz, CA, USA) in 5% skim milk 0.05% TBS-Tween 20 buffer. Antibody binding to the membrane was detected with a secondary antibody (goat anti-rabbit IgG 1:5000, ZSGB Biosciences, Beijing, China) conjugated to horseradish peroxidase and visualized by enzyme-linked chemiluminescence (EasySee® Western Blot Kit, TransGen Biotechnology, Beijing, China) with the Scientific MYECL Imager (Thermo, Boston, USA). To normalize the signal of IL8 and CD274, densitometric analysis was performed with ImageJ software, and the intensity of the two bands was normalized against the signal of b-actin.
4.5. Immunohistochemistry
commercial tissue arrays (Shanghai Outdo Biotech Co., Shanghai). The array contained 5 normal breast tissues and 211 breast tumor specimens. Staining intensity of each sample was given a modified histochemical score (MH-score) that considers both the intensity and the percentage of cells stained at each intensity. The intensity of each grade is the average of MH-score of all samples in that grade.
4.6. Statistical analysis
Each experiment was repeated at least in triplicate. Differentially expressed genes were identified by Bioconductor ‘limma’ package using a moderated t-tests (P<0.05) and comparisons of multiples of change (basal vs. luminal, GSE40057>2-fold, GSE1561>1.5-fold). One-way ANOVA was performed in SPSS 17.0 (SPSS Inc. Chicago, IL) to analyze the association of MIF and VEGFA expression and clinico-pathological data.
5. Conclusions
Through the use of online databases, model reconstruction and comparisons of the mRNA expression profiles of LL and BL cell lines and primary breast cancer tissues, 4 immunosuppressive factors associated with a malignant phenotype in breast cancer were identified and validated. However, because the majority of immune-related factors have diverse roles in disease pathology and we still lack a complete understanding of the relationship between immunosuppressive factors and breast cancer malignancy, therefore, the feasibility of their clinical application as drug targets warrants further investigation.
Supplementary Materials:
Figure S1 Unsupervised analysis. (a) Principal components of all genes. The first two PCA are plotted. The three major groups were colored in blue, red and green. (b) Hierarchical clustering of all samples. 8 cell lines from GSE40057 and 32 tissue samples from GSE1561, representing basal-like (blue) and luminal-like (red) groups were chosen for subsequent analysis
Figure S2 CSF2, IL8 and TGFβ1 expression in human breast cancer cell lines with GOBO analysis. (a) Box plots of CSF2, IL8 and TGFβ1 expression across 51 breast cancer cell lines grouped into basal A (red), basal B (grey) and luminal (blue) subgroups. (b) Box plots of CSF2, IL8 and TGFβ1 expression across 51 breast cancer cell lines grouped into triple negative (TN), HER2 positive and hormone receptor positive (HR). (c) CSF2, IL8 and TGFβ1 mRNA levels across 51 breast cancer cell lines
Figure S3 Kaplan-Meier Plotter determined the relationship between survival rate and mRNA expression levels of 6 immunosuppressive factors using microarray data of 4142 patients
Acknowledgments: The authors would like to thank Ping Zhang, Qingmei Zhong, Xianhe Yang, Wu Wang and
Di Yao at Department of Pathology, Affiliated Infectious Diseases Hospital, Nanchang University, for their technical assistance.
Funding: This work was partially supported by National Natural Science Foundation of China (No. 81160248, 81360313, 81560464) (to Daya Luo and Zhuoqi Liu), Natural Science Foundation of Jiangxi Province (No. 20142BAB215051, 20151BAB205058) (to Xiaohong Yang and Daya Luo), Innovation Foundation for Graduate Students of Nanchang University (No. CX2015181) (to Yunlei Song). The funders had no role in study design, data collection and analysis, decision to publish, or preparation of the manuscript.
Author Contributions: DY.L. and FS.W. designed the experiments and reviewed paper; ZQ.L. performed the datasets analysis and wrote the manuscript; XH.Y. and YL.S. administered the cells models, qRT-PCR and Western Blot; B.H. and YQ.X. executed the Immunohistochemistry; WF.Z, LH.Y and X.L. executed the other experiments. All authors reviewed and approved the final version.
References
1. Cancer facts $figures 2016. 2016.
2. Liu, X.; Wang, Q. Screening of feature genes in distinguishing different types of breast cancer using support vector machine. OncoTargets and Therapy 2015, 2311.
3. Prat, A.; Pineda, E.; Adamo, B.; Galvan, P.; Fernandez, A.; Gaba, L.; Diez, M.; Viladot, M.; Arance, A.; Munoz, M. Clinical implications of the intrinsic molecular subtypes of breast cancer. Breast 2015, 24 Suppl 2, S26-35.
4. Bahnassy, A.; Mohanad, M.; Ismail, M.F.; Shaarawy, S.; El-Bastawisy, A.; Zekri, A.-R.N. Molecular biomarkers for prediction of response to treatment and survival in triple negative breast cancer patients from egypt. Experimental and Molecular Pathology 2015, 99, 303-311.
5. Jezequel, P.; Campone, M.; Gouraud, W.; Guerin-Charbonnel, C.; Leux, C.; Ricolleau, G.; Campion, L. Bc-genexminer: An easy-to-use online platform for gene prognostic analyses in breast cancer. Breast cancer research and treatment 2012, 131, 765-775.
6. Tomao, S.; Tomao, F.; Rossi, L.; Zaccarelli, E.; Caruso, D.; Minozzi, M.; Frati, L.; Papa, A.; Vici. Triple-negative breast cancer: New perspectives for targeted therapies. OncoTargets and Therapy 2015, 177.
7. Gandellini, P.; Andriani, F.; Merlino, G.; D'Aiuto, F.; Roz, L.; Callari, M. Complexity in the tumour microenvironment: Cancer associated fibroblast gene expression patterns identify both common and unique features of tumour-stroma crosstalk across cancer types. Seminars in cancer biology 2015, 35, 96-106.
8. Xu, M.; Du, X.; Liu, M.; Li, S.; Li, X.; Fu, Y.-X.; Wang, S. The tumor immunosuppressive microenvironment impairs the therapy of anti-her2/neu antibody. Protein & cell 2012, 3, 441-449.
9. Schlößer, H.A.; Theurich, S.; Shimabukuro-Vornhagen, A.; Holtick, U.; Stippel, D.L.; Bergwelt-Baildon, M.v. Overcoming tumor-mediated immunosuppression. Immunotherapy 2014, 6, 973-988.
10. Ringner, M.; Fredlund, E.; Hakkinen, J.; Borg, A.; Staaf, J. Gobo: Gene expression-based outcome for breast cancer online. PloS one 2011, 6, e17911.
11. Gyorffy, B.; Surowiak, P.; Budczies, J.; Lanczky, A. Online survival analysis software to assess the prognostic value of biomarkers using transcriptomic data in non-small-cell lung cancer. PloS one 2013, 8, e82241. 12. Neve, R.M.; Chin, K.; Fridlyand, J.; Yeh, J.; Baehner, F.L.; Fevr, T.; Clark, L.; Bayani, N.; Coppe, J.P.; Tong, F., et al. A collection of breast cancer cell lines for the study of functionally distinct cancer subtypes. Cancer cell 2006, 10, 515-527.
13. Dittmer, J.; Leyh, B. The impact of tumor stroma on drug response in breast cancer. Seminars in cancer biology 2015, 31, 3-15.
14. Criscitiello, C.; Esposito, A.; Curigliano, G. Tumor–stroma crosstalk. Current Opinion in Oncology 2014, 26, 551-555.
15. Quail, D.F.; Joyce, J.A. Microenvironmental regulation of tumor progression and metastasis. Nature Medicine 2013, 19, 1423-1437.
16. Granot, Z.; Fridlender, Z.G. Plasticity beyond cancer cells and the "immunosuppressive switch". Cancer Research 2015, 75, 4441-4445.
17. Morandi, A.; Chiarugi, P. Metabolic implication of tumor:Stroma crosstalk in breast cancer. Journal of Molecular Medicine 2014, 92, 117-126.
18. Raposo, T.P.; Beirão, B.C.B.; Pang, L.Y.; Queiroga, F.L.; Argyle, D.J. Inflammation and cancer: Till death tears them apart. The Veterinary Journal 2015, 205, 161-174.
19. Jiang, X.; Shapiro, D.J. The immune system and inflammation in breast cancer. Molecular and Cellular Endocrinology 2014, 382, 673-682.
20. Grivennikov, S.I.; Greten, F.R.; Karin, M. Immunity, inflammation, and cancer. Cell 2010, 140, 883-899. 21. Wang, Y.; Wang, X.; Wang, X.; Zhang, D.; Jiang, S. Effect of transforming growth factor-beta1 869c/t polymorphism and radiation pneumonitis. Int J Clin Exp Pathol 2015, 8, 2835-2839.
22. Kalinski, P. Regulation of immune responses by prostaglandin e2. The Journal of Immunology 2012, 188, 21-28.
23. Shibuya, M. Vascular endothelial growth factor and its receptor system: Physiological functions in angiogenesis and pathological roles in various diseases. Journal of biochemistry 2013, 153, 13-19.
25. Egawa, M.; Mukai, K.; Yoshikawa, S.; Iki, M.; Mukaida, N.; Kawano, Y.; Minegishi, Y.; Karasuyama, H. Inflammatory monocytes recruited to allergic skin acquire an anti-inflammatory m2 phenotype via basophil-derived interleukin-4. Immunity 2013, 38, 570-580.
26. Li, H.; Edin, M.L.; Bradbury, J.A.; Graves, J.P.; DeGraff, L.M.; Gruzdev, A.; Cheng, J.; Dackor, R.T.; Wang, P.M.; Bortner, C.D. Cyclooxygenase-2 inhibits t helper cell type 9 differentiation during allergic lung inflammation via down-regulation of il-17rb. American journal of respiratory and critical care medicine 2013, 187, 812-822.
27. Gatalica, Z.; Snyder, C.; Maney, T.; Ghazalpour, A.; Holterman, D.A.; Xiao, N.; Overberg, P.; Rose, I.; Basu, G.D.; Vranic, S. Programmed cell death 1 (pd-1) and its ligand (pd-l1) in common cancers and their correlation with molecular cancer type. Cancer Epidemiology Biomarkers & Prevention 2014, 23, 2965-2970.
28. Lan, K.-H.; Liu, Y.-C.; Shih, Y.-S.; Tsaid, C.-L.; Yen, S.-H.; Lan, K.-L. A DNA vaccine against cytotoxic t-lymphocyte associated antigen-4 (ctla-4) prevents tumor growth. Biochemical and biophysical research communications 2013, 440, 222-228.
29. Soliman, H.; Khalil, F.; Antonia, S. Pd-l1 expression is increased in a subset of basal type breast cancer cells. PloS one 2014, 9, e88557.
30. Topalian, S.L.; Hodi, F.S.; Brahmer, J.R.; Gettinger, S.N.; Smith, D.C.; McDermott, D.F.; Powderly, J.D.; Carvajal, R.D.; Sosman, J.A.; Atkins, M.B., et al. Safety, activity, and immune correlates of anti-pd-1 antibody in cancer. N Engl J Med 2012, 366, 2443-2454.
31. Singh, J.K.; Simoes, B.M.; Howell, S.J.; Farnie, G.; Clarke, R.B. Recent advances reveal il-8 signaling as a potential key to targeting breast cancer stem cells. Breast cancer research : BCR 2013, 15, 210.
32. Richard, V.; Kindt, N.; Saussez, S. Macrophage migration inhibitory factor involvement in breast cancer (review). Int J Oncol 2015, 47, 1627-1633.
33. Kurebayashi, J.; Otsuki, T.; Kunisue, H.; Mikami, Y.; Tanaka, K.; Yamamoto, S.; Sonoo, H. Expression of vascular endothelial growth factor (vegf) family members in breast cancer. Japanese journal of cancer research 1999, 90, 977-981.
34. Barrett, T.; Wilhite, S.E.; Ledoux, P.; Evangelista, C.; Kim, I.F.; Tomashevsky, M.; Marshall, K.A.; Phillippy, K.H.; Sherman, P.M.; Holko, M., et al. Ncbi geo: Archive for functional genomics data sets--update. Nucleic acids research 2012, 41, D991-D995.
35. Luo, D.; Wilson, J.M.; Harvel, N.; Liu, J.; Pei, L.; Huang, S.; Hawthorn, L.; Shi, H. A systematic evaluation of mirna:Mrna interactions involved in the migration and invasion of breast cancer cells. Journal of translational medicine 2013, 11, 57.
36. Farmer, P.; Bonnefoi, H.; Becette, V.; Tubiana-Hulin, M.; Fumoleau, P.; Larsimont, D.; MacGrogan, G.; Bergh, J.; Cameron, D.; Goldstein, D., et al. Identification of molecular apocrine breast tumours by microarray analysis. Oncogene 2005, 24, 4660-4671.
37. Gentleman, R.C.; Carey, V.J.; Bates, D.M.; Bolstad, B.; Dettling, M.; Dudoit, S.; Ellis, B.; Gautier, L.; Ge, Y.; Gentry, J., et al. Bioconductor: Open software development for computational biology and bioinformatics. Genome Biology 2004, 5, R80.
38. Huang, D.W.; Sherman, B.T.; Lempicki, R.A. Systematic and integrative analysis of large gene lists using david bioinformatics resources. Nature Protocols 2008, 4, 44-57.