Type of the Paper (Article)
1
Interconnecting Haptic Interfaces Through The
2
Internet
3
George Kokkonis1,*, Kostas E. Psannis2, Sotirios Kontogiannis3, Petros Nicopolitidis4, Manos
4
Roumeliotis2, Yutaka Ishibashi5
5
1 Dept. of Business Administration, Western Macedonia University of Applied Sciences, Grevena, Greece,
6
7
2 Dept. of Applied Informatics, University of Macedonia, Thessaloniki, Greece (c.stergiou, a.plageras,
8
kpsannis)@uom.edu.gr
9
3 Dept. of Mathematics, University of Ioannina, Greece. Email: [email protected]
10
4 Dept of Informatics, Aristotle University of Thessaloniki, Greece. Email: [email protected]
11
5 Dept of Computer Science, Nagoya Institute of Technology, Nagoya 466-8555, Japan. E-mail:
12
13
* Correspondence: [email protected]; Tel.: +306973735581
14
15
Abstract: Supermedia streams transfer video, audio, haptic and other sensory data. Real -time
16
transfering of supermedia streams over the Internet is quite challenging. This paper outlines the
17
proposed protocols for transferring supermedia streams over the Internet. Moreover, it describes
18
the Quality of Service (QoS) requirements for supermedia applications that a network has to fulfill.
19
Extensive simulations and experiments for the performance evaluation of transport protocols for
20
real time transferring HEVC streams with supermedia data are carried out. Complements,
21
differences and relevancies between simulation and real world experiments are discussed. The
22
metrics that are measured for the performance evaluation are delay, jitter, throughput, efficiency,
23
packet loss and one proposed by the authors, packet arrival deviation. The simulation tests reveal
24
which protocols could be used for the transfer of real-time supermedia data with a HEVC video
25
stream.
26
Keywords: Supermedia, Haptics, HEVC, Tactile feedback, Transport protocols, Teleoperation,
27
Interactive applications, Real-time Protocol, Internet Status.
28
29
1. Introduction
30
This paper outlines the existing transport protocols of multimedia streams. Simulation and
31
emulation tests for transferring supermedia streams over the Internet are undertaken. A thorough
32
analysis of these results is presented.
33
Real-time supermedia streams transfer audio, video, graphics, haptics, smells and other sensory
34
data. Supermedia data obtain massive variety and volume. This increase of data deteriorates the
35
network status of the Internet. A promising solution to this is the new video encoding standard
36
HEVC. It offers 50 % improvement in video compression over the existing H.264 Advanced Video
37
Coding standard, keeping comparable image quality, at the expense of increased computational
38
complexity [1].
39
A lot of research [2, 3, 4, 5] has been made on the QoS that a network should support, in order to
40
have the maximum Quality of Experience (QoE) [6] in a supermedia application through the
41
Internet. The network conditions in the Internet are not yet stable. They are changing from one area
42
to another and from one hour to another. Internet network conditions mainly depend on the QoS
43
that the Internet Service Provider enforces and the general state of the network. The recent network
44
conditions of the Internet might permit supermedia applications to flourish.
45
In order to transfer supermedia data through the Internet, specific transport protocols should be
46
enforced. Several protocols have been developed for this reason. The most important are the
47
ALPHAN Protocol [7], the SMOOTHED-SCTP [8], the ETP [9, 10], the IRTP [11], the RTP/I [12] and
48
the RTNP [13]. Other protocols that are being widely used to transfer real-time multimedia data
49
such as UDP, RTP [14], Datagram Congestion Control Protocol (DCCP) [15] and Stream Control
50
Transmission Protocol (SCTP) [16] should be tested for supermedia transferring as well.
51
The rest of this paper is organized as follows. Section II outlines the most recent supermedia
52
applications. Section III depicts the network conditions that are met in the Internet today. Section IV
53
presents the simulation scenario that is used for the evaluation of transport protocols. Section V
54
analyses the results of the simulation testing. Section VI discusses the complements, differences and
55
relevancies between simulation and real world experiments. Finally, section VII concludes the
56
paper.
57
2. Internet-Based Supermedia Applications
58
The expansion of Internet has led to the emergence of supermedia applications. Several
59
interesting studies [17] have shown that the transfer of real-time supermedia applications through
60
the Internet is possible. Several obstacles, such as delay and jitter, may still impede the flourishing of
61
supermedia applications [18]. Apart from delay, the scaling factor in macro-micro teleoperations [19,
62
20] and the difference in inertia between the master and the slave system [21] can also deteriorate
63
systems transparency [22]. Time-Delay compensation techniques [23, 24, 25] can overcome these
64
barriers while Fuzzy Controller techniques [26, 27] can protect the haptic systems from failure when
65
data transmission is insufficient. The high-computational-cost in Tele-Haptic applications can be
66
moderated with a high-performance computing environment such as a computational grid [28].
67
Apart from teleoperations, where the kinesthetic part of haptics plays the major role,
68
supermedia applications through the Internet can be applied to many other fields. Recent studies
69
have shown that supermedia applications could be applied to military operations [29], education
70
[30], telesurgery [31], video games [32], and video enhancement [33]. Furthermore, a
71
motion-copying system (MCS) [34] can be useful for the digital preservation of motions by skilled
72
experts as a haptic database. Supermedia can also enhance communication between people [35] and
73
upgrade the virtual reality to a promising augmented reality [36].
74
Since supermedia refer to the many human senses, it follows that supermedia can benefit
75
people with impairments. Haptic devices can help visually impaired people with route navigation
76
and neighboring information [37, 38]. With the help of tactile sensors [39], impaired people can now
77
visit a Haptic-museum from their home and explore all its exhibitions with the sense of touch.
78
Haptic devices can help people with kinesthetic disabilities [40], but they can also improve the
79
movement of humanoid robots like the haptic sensing foot system [41].
80
A new and promising opportunity for supermedia applications to flourish in the Web is
81
HTML5. The HTML5 formal supports the java script based Web Graphic Library WebGL. The
82
display of 3D graphics using a Web browser is now easier. A HTML5 Haptics (H5H) Plugin [42]
83
runs on most popular web browsers, uses HAPI as a haptic rendering machine and supports most of
84
the commercially available kinesthetic haptic interfaces. The window for easier creation of web
85
haptic applications is now opening.
86
87
3. The Network Conditions of the Internet
88
89
A lot of research [43, 44, 45] has been conducted for the network conditions of the Internet.
90
Network conditions refer to the amount of traffic that is being transferred through the Internet, the
91
End to End delay as well as the jitter between source and destination, and the available bandwidth
92
The results from research [2, 3, 4, 5] have concluded that in order to maximize the Quality of
94
Experience (QoE) of the user for supermedia streams, the network conditions should satisfy the
95
Quality of Service (QoS) requirements of Table I.
96
97
TABLE I. QOS REQUIREMENTS FOR SUPERMEDIA STREAMS [2,3,4,5,6]
98
QOS HAPTICS
VIDE
O
AUDIO
GRAPHIC
S
JITTER (ms) ≤ 2 ≤ 30 ≤ 30 ≤ 30
DELAY (ms) ≤ 50 ≤ 400 ≤ 150 ≤ 100-300
PACKET LOSS
(%)
≤ 10 ≤ 1 ≤ 1 ≤ 10
UPDATE RATE
(Hz)
≥ 1000 ≥ 30 ≥ 50 ≥ 30
PACKET SIZE
(bytes)
64-128 ≤ MTU 160-320 192-5000
THROUGHPU
T
(kbps)
512-1024
25000 -
40000
64-128 45-1200
99
All the above metrics vary in time and space. They depend on the number of the online users,
100
the amount of data that is being transferred at the specific moment of the measurement, and the
101
available equipment of lines and routers. It has been recorded that the amount of data transferred
102
through the web is constantly increasing [46]. Apart from that, the number of online users is
103
increasing as well. The growth of data transfer is compensated by continuing infrastructure
104
upgrades of computer networks.
105
There are two types of approaches for monitoring the network status. The two disciplines of
106
network monitoring are the active and the passive measurements [43]. In the active measurement,
107
specific generated probe packets, ICMP messages, are sent to specific destinations; measurements
108
for delay, round trip time, jitter and packet loss are made. Some common diagnostic tools for active
109
measurements are the ping, traceroute, capprobe, pathchar, netem and dummynet [44]. On the other
110
hand, passive approach is based on the observation of the traffic that flows on the links. Some
111
passive monitoring tools, commonly called sniffers, are the Tcpdump, Wireshark, Ethereal, Netflow
112
and JFlow [43].
113
In order to monitor the network status, the authors actively measured the average and the
114
standard deviation of the delay, the packet loss rate, and the number of hops of networks between
115
countries and continents. Measurements for the above metrics were made by the authors between
116
Japan and Korea, between Japan and Greece [47]. A recent measurement has also been made
117
between two cities of Greece, Grevena and Thessaloniki. The distance between those two cities is 175
118
Km. Two different networks were used for this measurement, the private optical network, GRNET
119
[48], part of the pan-European GEANT network with speeds up to 4x10Gbps, on the one hand and
120
one simple 8 Mbps Adsl connection on the other. The results of these measurements are shown in
121
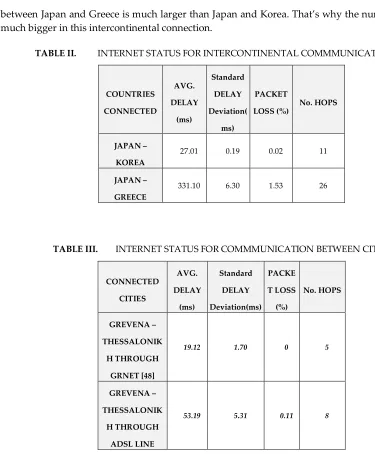
Table II and III. For the above experiments, 3,000 ICMP packets for each of 0, 6, 11, 15 and 19 o’ clock
122
standard time were sent from one destination to the other.
123
It is understood that the Internet connection between Japan and Korea satisfy all the restrictions
124
of Table I for transferring supermedia data through the Internet. For the Internet connection between
125
Japan and Greece, the values of Table II are relatively high because they refer to intercontinental
126
between Japan and Greece is much larger than Japan and Korea. That’s why the number of hops is
128
much bigger in this intercontinental connection.
129
TABLE II. INTERNET STATUS FOR INTERCONTINENTAL COMMMUNICATION[47]
130
COUNTRIES
CONNECTED
AVG.
DELAY
(ms)
Standard
DELAY
Deviation(
ms)
PACKET
LOSS (%)
No. HOPS
JAPAN –
KOREA
27.01 0.19 0.02 11
JAPAN –
GREECE
331.10 6.30 1.53 26
131
132
TABLE III. INTERNET STATUS FOR COMMMUNICATION BETWEEN CITIES
133
CONNECTED
CITIES
AVG.
DELAY
(ms)
Standard
DELAY
Deviation(ms) PACKE
T LOSS
(%)
No. HOPS
GREVENA –
THESSALONIK
H THROUGH
GRNET [48]
19.12 1.70 0 5
GREVENA –
THESSALONIK
H THROUGH
ADSL LINE
53.19 5.31 0.11 8
134
For the Internet connection between the two cities of Greece the results are shown in table III. In
135
the case of the simple 8 Mbps Adsl connection the results are slightly worse than the limits in Table I
136
for the average delay and jitter. The packet loss is within the limits of table I. On the other hand in
137
the case of the private optical network, GRNET, the results are encouraging. The average delay is
138
only 19.12 ms , the jitter is only 1.70 ms and packet loss is 0.00 %. All the above results are much
139
lower than the limits in Table I, which means that the transport of supermedia data through the
140
Internet is feasible under some circumstances
141
Another important factor that describes the network conditions of the Internet is the connection
142
speed of the end user. The recent spread of ADSL and VDSL connections provide consumers with
143
connections up to 50 Mbps bandwidth. This bandwidth is by very sufficient for the requirement of 1
144
Mbps throughput that is being produced from haptic applications, based on Table I.
145
We can conclude that the Internet network conditions are now suitable for supermedia
146
applications, especially when these applications take place in near regions.
147
148
4. Simulation Scenario of Existing Protocols
149
In order to monitor the metrics of section IV and evaluate the transport protocols of section III,
151
simulation tests were carried out. The network simulator that has been chosen for these tests is the
152
Network Simulator 2 (NS2) [49]. It is an open source, discrete event simulator with substantial
153
support for protocol evaluation over wired and wireless networks. A lot of common protocols have
154
already been implemented and tested in the NS2. Unfortunately, not many supermedia protocols
155
have been applied in NS2 so far.
156
One supermedia protocol that has been implemented in NS2 is the ETP. Apart from that, a lot of
157
real-time protocols that could be used for supermedia applications have been applied in the NS2.
158
Some of them are the RTP, the SCTP, the DCCP and the UDP.
159
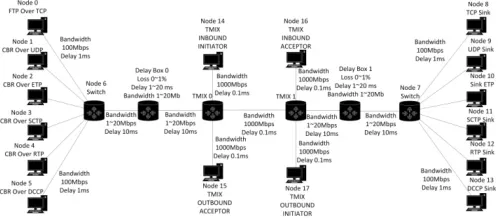
All the above protocols were attached to different nodes in the NS2 as shown in Figure 1. The
160
protocol TCP was mainly applied to the simulation scenario as a traffic generator. All the other
161
protocols try to send a stream of packets with a packet rate of 1000 packets per sec. Most of them
162
have a congestion control algorithm and minimize their sending rate in case of congestion. The
163
haptic packet size that every protocol sends is 64 bytes of data payload [11] plus the overhead of the
164
protocol.
165
The sample video for the HEVC encoding was the mobile_cif YUV series [50] with 352×288
166
resolution at 24 Hz. The data rate of this video sample after the HEVC encoding with Quantization
167
Parameter QP= 27 and Low-Delay inter-prediction is 642 kbps [51]. This data stream sent over the
168
RTP protocol with packet size of 1500 bytes.
169
The audio stream was sent over the RTP protocol with 128 kbps bit rate, packet size 320 bytes
170
and sending rate 50 packets per sec.
171
172
A. Static Network Bandwidth, Delay and Internet Traffic
173
174
The square nodes in Figure 1 are routers that are connected with each other through the
175
Internet.
176
The connection speed between those routers is set to 1, 5, 10, 15 and 20 Mbps for each
177
simulation and is stable for the whole simulation period. The Internet bandwidth of 1 Mbps has been
178
chosen so that a fully congested network can be represented. The Internet bandwidth of 20 Mbps
179
corresponds to a network with no congestion. The Internet bandwidth of 5 Mbps corresponds to a
180
network with low congestion. The connection between the server nodes 6 and 7 is regarded to be the
181
Internet bottleneck of the simulation.
182
The end to end delay in connection between nodes 6 and 7 was set to 5, 10, 20, 30, 40, 50 and 60
183
ms for each simulation and was stable for the whole simulation period. The 5 ms delay is a very
184
small delay that rarely occurs in Internet connections. On the other hand, 50 ms is regarded to be the
185
upper tolerable limit of delay, based on Table I, that’s why the 60 ms is set as the maximum delay of
186
the simulations. Of course, the end to end delay is changing dynamically in the real world
187
connections. The authors deliberately kept the end to end delay constant throughout each
188
simulation so as to study the behavior of each protocol at the specific delays. This would help the
189
researchers decide which protocols are preferable when the characteristics of the network delay are
190
known. Most of the diagrams depicted in this paper are for an Internet delay of 40 ms which is an
191
acceptable delay, based on Table I, and commonly encountered in the network. The simulations tests
192
undertaken were 5 (scales for the Internet speed) X 7 (scales for the delay) = for a total of 35 tests.
193
195
Figure 1. Simulation Environment of NS2.
196
197
The connection speed between the nodes 0-5 and server 6 as well as nodes 8-13 and server 7 is
198
100 Mbps as they are considered to be in the same local area network. The delay in those connections
199
was 1 ms.
200
The simulation time for each simulation was 20 sec. At time 0.5 sec the FTP application which
201
was attached at node 0 started to send data. At time 2 sec all the other CBR applications which were
202
attached to nodes 1-5 will started to send packets with a rate of 1000 packets per sec. The packet size
203
varied from node to node depending on the header of the transport protocol.
204
205
B. Dynamic Network Bandwidth, Delay and Internet Traffic
206
207
An interesting case of study is to examine the behavior of all the above protocols in a dynamic
208
environment such as the Internet. In such an environment, the delay of the network, the available
209
bandwidth and the packet loss are constantly changing. In order to simulate such an environment,
210
the DelayBox [52] and the TMIX [53] modules have been added to the ns2 simulator. With the help of
211
these modules, realistic Internet traffic is being fed to the network through the inbound (node 14)
212
and outbound (node 17) initiators of figure 2. The delaybox nodes on the other hand, enforce a
213
variable bottleneck of 1-20 Mbps, a variable packet delay of 1-20 ms and a packet loss of 0-1% on all
214
the TCP packets that pass through them. As the TCP packets dynamically change their behavior, all
215
the UDP packets are affected as well.
216
217
218
Figure 2. Topology of NS2 with DelayBoxes and TMIX traffic.
219
220
5. Results and Analysis
221
222
A. Protocol Efficiency
223
Protocol Efficiency was one of the metrics to be analyzed. Protocol efficiency is uninfluenced by
225
the network status and is determined by the payload of each application and the header of each
226
protocol Eq. (1). As supermedia applications demand very high update rate, the efficiency of the
227
transport protocol is crucial. The small payload should not be overshadowed by big overheads of the
228
transport protocols.
229
Table IV shows the efficiency of the five protocols under test. The protocol with the highest
230
efficiency was, as expected, the UDP protocol. This result derives from the fact that the UDP is a
231
“best effort”, unreliable protocol with no congestion control and no packet sorting. Therefore, UDP
232
has the smallest header of only 8 bytes.
233
234
TABLE IV. EFFICIENCY OF TRANSPORT PROTOCOLS
235
ETP UDP RTP SCTP DCCP
HEADER (bytes) 12+8(UDP) 8 12+8(UDP)
12+4
(CHUNK
INF.)
12
HAPTIC
PAYLOAD
(bytes)
64 64 64 64 64
EFFICIENCY 76.19% 88.88% 76.19% 80% 84.21%
236
237
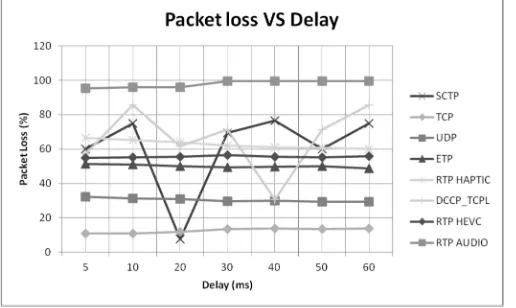
B. Packet Loss
238
Figures 3 and 4 depict the percentage of packet loss with relation to the delay of the network.
239
This diagram is important as it reveals the correlation between the network delay and the packet loss
240
for each protocol. If the characteristics of the End-to-End delay of the network are known, it can be
241
decided which protocol should be used for the transport of supermedia data so as to avoid high
242
values of packet loss.
243
In figure 3 the Internet bottleneck is 20 Mbps for all simulations. The delay was set to 5, 10, 20,
244
30, 40, 50 and 60 ms for each simulation and was stable for the whole simulation period. All the
245
protocols present quite a low packet loss, lower from the limit of 10 % of Table I. The worst
246
performance is presented by protocol the SCTP and the DCCP but still they have a packet loss lower
247
than 0.76 %.
248
On the other hand, Figure 4 presents much higher values of packet loss. In this scenario, the
249
Internet bottleneck has only 1 Mbps bandwidth for all simulations. It is obvious that the network is
250
congested. Six protocols are trying to send a throughput of at least 3 Mbps over the network with
251
bandwidth of 1 Mbps. The protocol with the smallest percentage of packet loss is the UDP protocol.
252
The protocol with the higher packet loss is again the SCTP and the DCCP protocol.
253
255
Figure 3. Packet Loss for Internet Bandwidth 20 Mbps.
256
257
258
Figure 4. Packet Loss for Internet Bandwidth 1 Mbps.
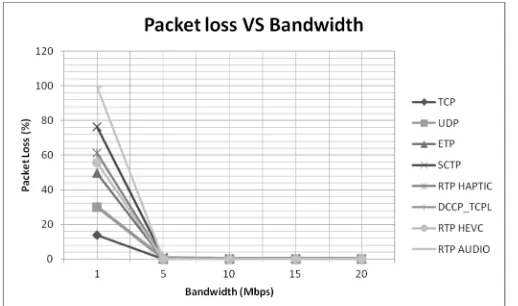
259
260
Figures 5 and 6 depict the correlation between the packet loss and the available bandwidth of
261
the Internet. Figure 5 depicts a network with static network conditions while Figure 6 depicts a
262
network with dynamic delay and Internet bandwidth for the TCP packets. Both charts have similar
263
behavior for Internet bandwidth higher than 5 Mbps, where no significant congestion is occurred.
264
From these charts it can be derived which protocols behave better in a congested network. It is quite
265
obvious that as the Internet bandwidth increases, the packet loss decreases. For Internet bandwidth
266
higher than 5 Mbps the packet loss is lower than 1 %. This means that there is no congestion on the
267
network for available bandwidth higher than 5 Mbps. When the available Internet bandwidth is only
268
1 Mbps, the network is heavily congested and the packet losses are unacceptable high. The worst
269
performance regarding packet loss, based on figures 3, 4, 5 is being presented by the DCCP and the
270
SCTP protocol. This performance is being deteriorated especially in heavy congested networks. The
271
congestion control algorithm of the SCTP and the DCCP protocol is a TCP-like Congestion Control,
272
which is similar to that of TCP. The sender maintains a congestion window and sends packets until
273
that window is full. The response to congestion is to halve the congestion window. This means that
274
the DCCP and the SCTP protocol sends its packet in bursts. This cause the buffers of intermediate
275
routers to overflow and some packets to be dropped.
276
278
Figure 5. Packet Loss for Internet Delay 40 ms.
279
280
281
Figure 6. Packet Loss Vs Bandwidth for Dynamic Network Conditions.
282
283
C. Throughput
284
285
One more metric that has to be monitored is the throughput that every protocol loads to the
286
network. The higher the throughput is, the higher the possibilities are for network congestion. In
287
connections where the available bandwidth is low, protocols with small throughput should be
288
preferred.
289
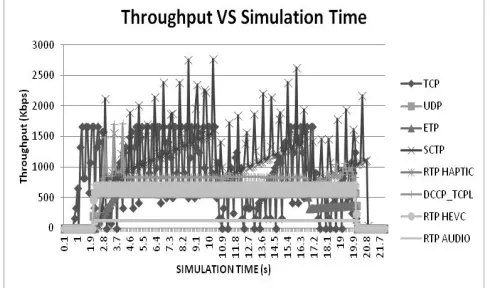
Figure 7 depicts the throughput of the protocols for an Internet bandwidth of 20 Mbps, so that
290
no congestion should occur in the network. The delay of the Internet is set to 40 ms, as 50 ms is the
291
maximum accepted delay, based on Table I. TCP throughput varies between 1660 Kbps and 3300
292
Kbps because of the congestion window of the TCP’s congestion control. UDP and RTP protocols
293
pose a steady throughput of 576 and 672 Kbps for haptic data respectively. This means that their
294
sending rate is constant. The higher throughput of RTP is due to the higher header of the protocol.
295
Protocol ETP tries to reach its highest sending rate, but its growth is very slow due to its congestion
296
control. After 20 sec of simulation time it had not yet reached the sending rate of 1000 packets per
297
sec. The SCTP protocol presents the highest throughput, after TCP, among the other protocols. Apart
298
from that, it also presents the highest deviation of the throughput. DCCP for the first 6 sec presents
299
quite a big deviation of the throughput and it is not stabilized before the 8th second.
300
302
Figure 7. Throughput for Internet Bandwidth 20 Mbps and Delay 40 ms.
303
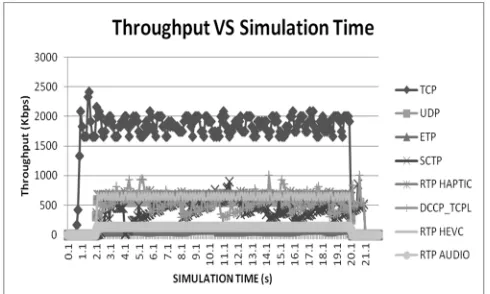
304
305
Figure 8. Throughput Vs Bandwidth for Dynamic Network Conditions.
306
307
Figure 8 depicts the behavior of the protocols for a dynamic network. The big different between
308
figure 7 and 8 is the behavior of the TCP, the SCTP, the ETP and the DCCP protocol. All the above
309
protocols have a tcp friendly congestion control protocol. As the available bandwidth dynamical
310
changes, the above protocol change their transmission rate in order congestion to be avoided. On the
311
other hand the UDP and the RTP protocol exhibit the same performance because they don’t have a
312
tcp friendly congestion control.
313
Figure 9 displays the throughput of the protocols for Internet bandwidth 5 Mbps and delay 40
314
ms. The bandwidth of 5 Mbps is chosen so that the network is under low congestion. TCP has
315
lowered its throughput that now varies from 1660 Kbps to 2160 Kbps. UDP and RTP protocols
316
display almost the same steady throughput with very small deviations as they do not have a
317
TCP-Friendly rate control. ETP protocol adapts the smallest throughput. It cannot increase its
318
sending rate because there is some congestion on the network. It can be seen that the congestion
319
control of TCP binds more bandwidth than that of ETP. DCCP shows almost the same performance
320
with the previous simulation. It adapts almost the same steady throughput, with very small
321
deviations, 2 seconds later than in the previous simulation. SCTP still presents the biggest deviation
322
and does not manage to obtain a steady throughput.
323
325
Figure 9. Throughput for Internet Bandwidth 5 Mbps and Delay 40ms.
326
327
D. Jitter
328
329
One crucial metric that has to be monitored is the packet delay deviation. A high value of jitter
330
is a crucial factor that often leads to system instability and failure. Based on Table I haptic
331
applications have the lower tolerant limit of jitter of all multimedia applications. The jitter effect
332
occurs when there is congestion on the network.
333
334
335
Figure 10. Jitter for Internet Bandwidth 20 Mbps.
336
337
Figure 10 illustrates the jitter of the protocols for an Internet bandwidth of 20 Mbps and for
338
delays from 5 ms to 60 ms. At this high bandwidth no congestion occurs. Almost all of the protocols
339
show very small jitter, lower than 0.6 ms.
340
Figure 11 depicts the jitter of the protocols for an Internet bandwidth of 1 Mbps. It is a fully
341
congested network with a lot of packets lost. The jitter is now much higher than in figure 10. The
342
protocols with the highest jitter are the DCCP, the TCP and the SCTP. RTP, UDP and ETP protocol
343
have smaller jitter than 6.7 ms, with the ETP exhibiting the best performance with a jitter smaller
344
than 2.6 ms. According to Table I, the jitter should be lower than 2 ms, a goal that most of the
345
protocols could not achieve due to the congestion of the network. An interesting observation is that
346
the protocols TCP, SCTP, and DCCP lower their jitter as the delay of the Internet bandwidth
347
increases. All these protocols have the almost the same tcp-like congestion control algorithm.
348
351
Figure 11. Jitter for Internet Bandwidth 1 Mbps.
352
353
Figures 12 and 13 depict the jitter of the protocols when the Internet bottleneck bandwidth
354
varies from 1 Mbps to 20 Mbps. The average Internet delay is near 40 ms. All the protocols show a
355
different behavior when the Internet bandwidth is 1 Mbps and the Network is heavily congested.
356
For higher bandwidth values all protocols present almost the same behavior. As the Internet
357
bandwidth increases, the congestion and as a consequence the jitter effect, are decreasing.
358
359
360
Figure 12. Jitter for Internet Delay 40 ms.
361
362
363
364
Figure 13. Jitter Vs Bandwidth for Dynamic Network Conditions.
365
366
E. Packet Arrival Deviation
367
368
Packet Arrival Deviation (PAD) is the proposed metric for the performance evaluation of
369
supermedia protocols. It shows similar behavior with jitter but it can offer more precise picture of
370
the real-time network delay conditions than jitter, since it can take into account both the receiver end
371
ACK packets reception time variation at the sender (packet reception jitter at the sender end).
373
Moreover, it takes also into account the changes of the sending rate of the source focusing on the
374
fluctuations of the Internet bandwidth. Table I does not include the PAD, as it is only presently
375
proposed by the authors. The upper tolerant limit for PAD should be equal with jitter’s, meaning 2
376
ms, as they should show almost identical behavior when there is no packet loss and no changes in
377
the sending rate and the Internet bandwidth.
378
379
380
381
382
383
Figure 14. Packet Arrival Deviation for Internet Bandwidth 20 Mbps.
384
385
Figure 14 displays the standard deviation of the packet arrival for different delays. The Internet
386
bandwidth is 20 Mbps. The protocols with the higher standard deviation are the TCP, SCTP and the
387
DCCP protocols. UDP and RTP and ETP protocols present very small standard deviation of packet
388
arrival, lower than 2,5 ms. This difference between TCP,SCTP, DCCP and the UDP, ETP,RTP is the
389
way they send their packets. The first group sends its packets in burst inside a congestion window
390
(CWND), while the second group sends its packets with an almost steady inter packet gap.
391
392
393
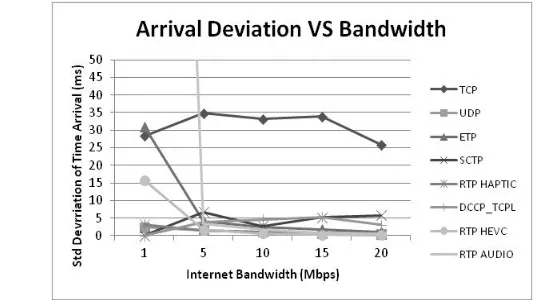
Figure 15. Arrival Deviation for Internet Delay 40 ms.
394
395
Figure 15 and 16 shows the Packet Arrival Deviation as the bandwidth of the Internet varies
396
from 1 Mbps to 20 Mbps. Protocols SCTP and DCCP and TCP are not included in the graph for 1
397
Mbps because they could not perform at such a congested network. The conclusions of this graph
398
are similar to those of Figure 14. The protocol with the highest standard deviation is the TCP,
399
because it sends its packets in bursts. UDP and RTP have almost none arrival deviation as they send
400
their packets with constant bit rate with no congestion control. When the Internet bandwidth gets
401
values higher than 10 Mbps, the performance of all the protocols, except TCP, resembles as no
402
congestion occurs.
403
405
406
Figure 16. Arrival Deviation Vs Bandwidth for Dynamic Network Conditions.
407
408
409
Analyzing the above results, it is understood that not all multimedia protocols are suitable for
410
transferring supermedia data. Protocols such as TCP, SCTP and DCCP do not perform very well in
411
heavily congested networks, as they are not designed for timely delivery of information. The most
412
stable protocols for real-time data are UDP, ETP and RTP. Both ETP and RTP protocols are based on
413
UDP. The UDP protocol is the lightest, fastest and most efficient protocol from all. Table IV shows
414
that UDP has 88.88% efficiency for a payload of 64 bytes. As far as packet loss is concerned, all
415
protocols show similar behavior, as shown in figure 5. The only case that they behave differently is
416
when the Internet bandwidth is only 1 Mbps (Figure 4), which means that the network is under
417
unacceptable heavy congestion. As far as throughput is concerned, Figures 7 and 9 which
418
correspond to 20 and 5 Mbps Internet bandwidth with 40 ms delay, UDP and RTP show a steady
419
and similar behavior with UDP consuming little less bandwidth due to its better efficiency. ETP
420
protocol performs rather well in good network conditions but it can’t reach the optimum sending
421
rate of 1000 packets/sec when a little congestion occurs. Regarding jitter and Arrival Deviation UDP
422
and RTP show almost the same behavior in all network conditions. Their behavior is better than all
423
the other protocols. The only case where ETP is showing a little better behavior than UDP and RTP is
424
when the Internet bandwidth is only 1 Mbps (Figures 11, 12), which means that the network is
425
unacceptable heavily congested. To avoid congestion, ETP is lowering its sending rate, and that’s
426
why it presents lower jitter and arrival deviation. Summarizing, it could be said that RTP and UDP
427
present the best performance with similar behavior in most network conditions. The ETP protocol
428
could be used in cases with network congestion, due to its congestion control.
429
430
6. Complements, Differences and Relevancies Between Simulation and Real World Experiments
431
432
In section VI, our previous real world experiment is described, while in section VII and VIII a
433
simulation experiment has taken place. Anyone would have thought that a real world experiment
434
would give more accurate results than a simulation test and a simulation test is unnecessary. The
435
truth is somewhere in the middle. The simulation tests do not contradict real word experiments but
436
they complement them.
437
The real world scenario helped us understand the status of the Internet and define the values of
438
the variables for the simulation experiment. The only variable that is difficult to define is the
439
available bandwidth of the Internet for the whole path. It is a metric that is being changing
440
dynamically and rapidly as it is based on the number of the online users and the data that are
441
exchanged.
442
The real world scenario revealed that a real teleoperation task through the Internet is feasible,
443
while the simulation experiment helped us conclude which protocols suits better for these
444
In the real world experiment, it is understood that the experiment results are depending on the
446
physically distance between the source and the destination and the ambiguous network conditions
447
of the Internet. In the simulation tests network conditions are fully controlled, so more accurate
448
results can be produced.
449
The real world experiment helped the authors define the mean end to end delay, the standard
450
delay deviation (jitter) the packet loss and the number of hops between source and destination. For
451
this experiment the UDP transport protocol was chosen. It is the simplest transport protocol and it is
452
being used for most cases of real-time multimedia applications. Two completely different pairs of
453
source and destination were chosen, in order to examine the dependency between the results on the
454
distance between source and destination.
455
Despite the ambiguous network condition of the Internet the simulation results of the UDP
456
protocol matches the results of the real world scenario for the connection between Korea and Japan,
457
Table V. At the specific simulation, the Internet end to end delay was set 32 ms. The Internet
458
bandwidth was set to 20 Mbps. These settings depict a network with no congestion. Both simulation
459
and experiment transport data over the UDP protocol. For the connection between Japan and Greece
460
there were no corresponding simulation tests as the results from the real world experiment were
461
outside the acceptable limits of Table I.
462
TABLE V. Similarities Between Simulation And Real World Experiments
463
DELAY
(ms)
JITTER
(ms)
PACKET
LOSS (%)
CONNECTION BETWEEN
JAPAN – KOREA
27.01 0.19 0.02
SIMULATION OF UDP
PROTOCOL WITH 20 MBPS
INTERNET BANDWIDTH
32.10 0.19 0.02
464
7. Conclusions
465
466
It is obvious that the transfer of real-time supermedia data through the Internet is now possible.
467
The network conditions of the Internet are continuously improving. The transport protocols that are
468
being used for the transfer of the multimedia real-time data are not specialized in transferring
469
supermedia streams with haptic data. Specific protocols for supermedia transferring should be
470
standardized. The Internet Service Providers should integrate the network conditions that are
471
required for the transfer of haptic data in their QoS.
472
The new HEVC video encoding is offering great improvements in the supermedia transferring
473
through Internet. The reduced by half bit rate of the video stream provides congestion avoidance
474
and reduced jitter, delay and packet loss.
475
The experiments that have been carried out in this paper revealed which protocols could be
476
used for the transfer of real-time supermedia data.
477
478
References
479
1. Garcia, R., Kalva, H., “Subjective evaluation of HEVC and avc/h.264 in mobile environments”. IEEE Tran.
480
Consum. Electron. Vol. 60, pp. 116–123, Feb. 2014.
481
2. M. Eid, Cha Jongeun and A. El Saddik, “Admux: An Adaptive Multiplexer for Haptic–Audio–Visual Data
482
Communication,” IEEE Trans. Instrum. Meas., vol. 60, no. 1, pp. 21-31, Jan. 2011.
483
3. K. Iwata, Y. Ishibashi, N. Fukushima and S. Sugawara, “Qoe assessment in haptic media, sound, and video
484
4. N. Suzuki, S. Katsura, “Evaluation of QoS in haptic communication based on bilateral control,” IEEE Int.
486
Conf. on Mechatronics, ICM 2013, pp.886-891.
487
5. E. Isomura, S. Tasaka, T. Nunome, “A multidimensional QoE monitoring system for audiovisual and
488
haptic interactive IP communications,” IEEE Consumer Communications and Networking Conference,
489
CCNC 2013, pp.196-202.
490
6. A. Hamam, A. El Saddik, “Toward a Mathematical Model for Quality of Experience Evaluation of Haptic
491
Applications,” IEEE Trans. Instrum. Meas., vol. 62, no. 12, pp.3315-3322, Dec. 2013
492
7. H. Al Osman, M. Eid, R. Iglesias and A. El Saddik, “ALPHAN: Application Layer Protocol for HAptic
493
Networking,” IEEE Int. Workshop on Haptic, Audio and Visual Environments and Games, HAVE 2007,
494
pp.96-101.
495
8. S. Dodeller and N. D. Georganas, “Transport layer protocols for telehaptics update message,” Proc. 22nd
496
Biennial Symp. on Communications, Queen’s Univeristy, Canada, May 31-June3 2004.
497
9. R. Wirz, M. Ferre, R. Marin, J. Barrio, J. Claver and J. Ortego, “Efficient transport protocol for networked
498
haptics applications,” in Haptics: Perception, Devices and Scenarios, ser. Lecture Notes in Computer
499
Science, M. Ferre, Ed. Springer, Berlin 2008, vol. 5024, pp. 3-12.
500
10. R. Wirz, R. Marin, M. Ferre, J. Barrio, J. M. Claver and J. Ortego, “Bidirectional Transport Protocol for
501
Teleoperated Robots,” IEEE Trans. Ind. Electron., vol. 56, no. 9, pp.3772-3781, Sept. 2009.
502
11. L. Ping, L. Wenjuan and S. Zengqi, “Transport layer protocol reconfiguration for network-based robot
503
control system,” IEEE Proc . in Networking, Sensing and Control, 2005, pp. 1049-1053.
504
12. M. Mauve, V. Hilt, C. Kuhmunch and W. Effelsberg, “Rtp/i-toward a common application level protocol
505
for distributed interactive media,” IEEE Trans. Multimedia, vol. 3, no. 1, pp. 152-161, Mar. 2001.
506
13. Y. Uchimura and T. Yakoh, “Bilateral robot system on the real-time network structure,” IEEE Trans. Ind.
507
Electron., vol. 51, no. 5, pp.940-946, Oct. 2004.
508
14. H. Schulzrimie, S. Casner, R. Frederick and V. Jacobson, “RTP: a transport protocol for real-time
509
applications,” Request for Comments (Proposed Standard) 1889, Internet Engineering Task Force, Jan.
510
1996
511
15. E. Kohler, M. Handley and S. Floyd, “Datagram Congestion Control Protocol (DCCP).” RFC 4340,
512
tools.ietf.org/html/rfc4340, Mar. 2006.
513
16. R. Stewart et al. Stream control transmission protocol. RFC 2960, tools.ietf.org/html/rfc4960, Oct. 2000.
514
17. R. Marin, P. J. Sanz, P. Nebot and R. Wirz, “A multimodal interface to control a robot arm via the web: a
515
case study on remote programming,” IEEE Trans. Ind. Electron., vol 52, no.6, pp.1506-1520, 2005.
516
18. H. Pingguo, Qi Zeng, Y. Ishibashi, “QoE assessment of will transmission using haptics: Influence of
517
network delay,” IEEE 2nd Global Conf. on Consumer Electronics, GCCE 2013, pp.456-460
518
19. T. Mizoguchi, T. Nozaki, K. Ohnishi, “Stiffness Transmission of Scaling Bilateral Control System by
519
Gyrator Element Integration,” IEEE Trans. Ind. Electron., vol.61, no.2, pp. 1033-1043, Feb. 2014
520
20. S. Sakaino, T. Sato,K. Ohnishi, “Multi-DOF Micro-Macro Bilateral Controller Using Oblique Coordinate
521
Control,” IEEE Trans. Ind. Informat., vol.7, no.3, pp.446-454, Aug. 2011
522
21. T. Nozaki, T. Mizoguchi, K. Ohnishi, “Decoupling Strategy for Position and Force Control Based on Modal
523
Space Disturbance Observer,” IEEE Trans. Ind. Electron., vol.61, no.2, pp. 1022-1032, Feb. 2014
524
22. S. Hirche, M. Buss, “Human-Oriented Control for Haptic Teleoperation,” Proc. of the IEEE , vol.100, no.3,
525
pp. 623-647, March 2012
526
23. B. Yalcin, K. Ohnishi, “Stable and Transparent Time-Delayed Teleoperation by Direct Acceleration
527
Waves,” IEEE Trans. Ind. Electron., vol.57, no.9, pp.3228-3238, Sept. 2010.
528
24. H. Morimitsu, S. Katsura, M. Tomizuka, “Design of force compensator with variable gain for bilateral
529
control system under time delay,” IEEE Int. Symp. on Ind. Electron., ISIE 2013, pp. 1-6..
530
25. K. Natori and K. Ohnishi, “A Design Method of Communication Disturbance Observer for Time-Delay
531
Compensation, Taking the Dynamic Property of Network Disturbance Into Account,” IEEE Trans. Ind.
532
Electron., vol.55, no.5, pp.2152-2168, May 2008.
533
26. O. Linda and M. Manic, “Self-Organizing Fuzzy Haptic Teleoperation of Mobile Robot Using Sparse Sonar
534
Data,” IEEE Trans. Ind. Electron., vol.58, no.8, pp.3187-3195, Aug. 2011.
535
27. K. Sim, K. Byun and F. Harashima, “Internet-based teleoperation on an intelligent robot with optimal
536
two-layer fuzzy controller,” IEEE Trans. Ind. Electron., vol. 53, no. 4, pp. 1362-1372, June 2006.
537
28. I. Peterlik and J. Filipovic, “Distributed Construction of Configuration Spaces for Real-Time Haptic
538
29. L. Elliott, E. Schmeisser and E. Redden, “Development of tactile and haptic systems for u.s. infantry
540
navigation and communication,” Human Interface and the Management of Information. Interacting with
541
Information, ser. Lecture Notes in Computer Science, vol. 6771, pp. 399-407, July 2011.
542
30. N. Mohammadi, I. Murray, “Developing methodologies for the presentation of graphical educational
543
material in a non-visual form for use by people with vision impairment,” IEEE Int. Conf. Teaching,
544
Assessment and Learning for Engineering, TALE 2013, pp.373-377.
545
31. Y. Nakajima, T. Nozaki, K. Ohnishi, “Heartbeat Synchronization With Haptic Feedback for Telesurgical
546
Robot,” IEEE Trans. Ind. Electron, vol. 61, no. 7, pp.3753-3764, July 2014
547
32. A.L. Guinan, N.A. Caswell, F.A. Drews, W.R. Provancher, “A video game controller with skin stretch
548
haptic feedback,” IEEE Int. Conf. on Consumer Electronics, ICCE 2013, pp.456-457.
549
33. F. Danieau, J. Fleureau, P. Guillotel, N. Mollet, M. Christie, A. Lecuyer, “Toward Haptic Cinematography:
550
Enhancing Movie Experience with Haptic Effects based on Cinematographic Camera Motions,” IEEE
551
MultiMedia, accepted for publication in a future issue of this journal
552
34. S. Yajima, S. Katsura, “Multi-DOF Motion Reproduction Using Motion-Copying System With Velocity
553
Constraint,” IEEE Trans. Ind. Electron., vol. 61, no. 7, pp.3765-3775, July 2014
554
35. S. Hossain, A. Rahman and A. El Saddik, “Measurements of multimodal approach to haptic interaction in
555
second life interpersonal communication system,” IEEE Trans. Instrum. Meas., , vol. 60, no. 11, pp.
556
3547-3558, nov. 2011.
557
36. C. Sutherland, K. Hashtrudi-Zaad, R. Sellens, P. Abolmaesumi, P. Mousavi, “An Augmented Reality
558
Haptic Training Simulator for Spinal Needle Procedures,” IEEE Trans. Biomed. Eng., vol. 60, no. 11, pp.
559
3009-3018, Nov. 2013
560
37. T. Ando, R. Tsukahara, M. Seki and M. G. Fujie, “A Haptic Interface “Force Blinker 2” for Navigation of
561
the Visually Impaired,” IEEE Trans. Ind. Electron., vol. 59, no. 11, pp. 4112-4119, Nov. 2012.
562
38. D. I. Ahlmark, H. Fredriksson, K. Hyyppa, “Obstacle avoidance using haptics and a laser rangefinder,”
563
IEEE Workshop on Advanced Robotics and its Social Impacts, ARSO 2013, pp.76-81.
564
39. K. Suwanratchatamanee, M. Matsumoto and S. Hashimoto, “Robotic Tactile Sensor System and
565
Applications,” IEEE Trans. Ind. Electron., vol. 57, no. 3, pp. 1074-1087, March 2010.
566
40. Y. Oonishi, S. Oh and Y. Hori, “A new control method for power-assisted wheelchair based on the surface
567
myoelectric signal,” IEEE Trans. Ind. Electron., vol. 57, no. 9, pp. 3191-3196, Sep. 2010.
568
41. K. Suwanratchatamanee, M. Matsumoto and S. Hashimoto, “Haptic Sensing Foot System for Humanoid
569
Robot and Ground Recognition With One-Leg Balance,” IEEE Trans. Ind. Electron., vol. 58, no. 8, pp.
570
3174-3186, Aug. 2011.
571
42. H. Al Osman, Cha Jongeun and A. El Saddik, “The HTML5 Haptics Plugin,” IEEE Int. Workshop on
572
Haptic Audio Visual Environments and Games ,HAVE 2012, pp.130-133.
573
43. A. Callado, C. Kamienski, G. Szabo, B. Gero, J. Kelner, S. Fernandes and D. Sadok, “A Survey on Internet
574
Traffic Identification” IEEE Communications Surveys & Tutorial, vol. 11, no. 3, pp. 37-52, 3rd Quarter
575
2009.
576
44. A. Finamore, M. Mellia, M. Meo, M. M. Munafo and D. Rossi, “Experiences of Internet traffic monitoring
577
with tstat,” IEEE Network, vol. 25, no. 3, pp. 8-14, May-June 2011.
578
45. M. Hasegawa and T. Ikeguchi, “An analysis of the Internet traffic by the method of surrogate data,” IEEE
579
Inter. Symp. on Circuits and Systems, ISCAS 2002., vol.3, pp. III-599- III-602.
580
46. C. Labovitz, S. Iekel-Johnson, D. McPherson, J. Oberheide and F. Jahanian, “Internet Inter-domain Traffic,”
581
in ACM SIGCOMM, New Delhi, India, Aug. 2010.
582
47. N. Ishii, S. Lee, Y. Ishibashi, K. E. Psannis and J. Kim, “Experiment on international connection for haptic
583
media communications,” in Record of 2009 Tokai-Section Joint Conf. of the Eight Institutes of Electrical
584
and Related Engineers, O-434, Sep. 2009.
585
48. The Greek Research and Technology Network - GRNET S.A. https://www.grnet.gr/en. Accessed 20 Nov.
586
2017
587
49. S. McCanne and S. Floyd. Network simulator ns-2. http://nsnam.isi.edu/nsnam/index.php.
588
50. Fitzek, F., Reisslein, M.: Video traces for network performance evaluation: Yuv 4:2:0 video sequences,
589
http://trace.eas.asu.edu/yuv/index.html. Accessed 20 Nov. 2017
590
51. G. Kokkonis, K.E. Psannis, M. Roumeliotis, Y. Ishibashi, “Efficient algorithm for transferring a real-time
591
HEVC stream with haptic data through the internet”, Journal of Real-Time Image Processing, pp. 1-13,
592
52. J. Cao, W.S. Cleveland, Y. Gao, K. Jeffay, F.D. Smith, and M.C. Weigle. “Stochastic Models for Generating
594
Synthetic HTTP Source Traffic” Proceedings of IEEE INFOCOM Hong Kong, March 2004.
595
53. M.C. Weigle, P. Adurthi, F. Hernandez-Campos, K. Jeffay, and F.D. Smith, “Tmix: A Tool for Generating
596
Realistic Application Workloads in ns-2”, ACM SIGCOMM Computer Communication Review, July 2006,
597
Vol 36, No 3, pp. 67-76.
![TABLE I. QOS REQUIREMENTS FOR SUPERMEDIA STREAMS [2,3,4,5,6]](https://thumb-us.123doks.com/thumbv2/123dok_us/8018033.1333346/3.595.155.424.146.386/table-i-qos-requirements-supermedia-streams.webp)