Ordinal-Measure Based Shape Correspondence
Faouzi Alaya Cheikh
Signal Processing Laboratory, Tampere University of Technology, P.O. Box 553, FIN-33101 Tampere, Finland Email: [email protected]
Bogdan Cramariuc
Signal Processing Laboratory, Tampere University of Technology, P.O. Box 553, FIN-33101 Tampere, Finland Email: [email protected]
Mari Partio
Signal Processing Laboratory, Tampere University of Technology, P.O. Box 553, FIN-33101 Tampere, Finland Email: [email protected]
Pasi Reijonen
Signal Processing Laboratory, Tampere University of Technology, P.O. Box 553, FIN-33101 Tampere, Finland Email: [email protected]
Moncef Gabbouj
Signal Processing Laboratory, Tampere University of Technology, P.O. Box 553, FIN-33101 Tampere, Finland Email: [email protected]
Received 31 July 2001 and in revised form 10 February 2002
We present a novel approach to shape similarity estimation based on distance transformation and ordinal correlation. The pro-posed method operates in three steps: object alignment, contour to multilevel image transformation, and similarity evaluation. This approach is suitable for use in shape classification, content-based image retrieval, and performance evaluation of segmen-tation algorithms. The two latter applications are addressed in this paper. Simulation results show that in both applications our proposed measure performs quite well in quantifying shape similarity. The scores obtained using this technique reflect well the correspondence between object contours as humans perceive it.
Keywords and phrases:shape, ordinal, correlation, content, retrieval, indexing, segmentation, performance.
1. INTRODUCTION
Shape representation techniques are generally characterized as being boundary-based or region-based. The former (also known as contour-based) represents the shape by its outline, while the latter considers the shape as being formed of a set of two-dimensional regions. The human visual system itself focuses on edges and ignores uniform regions [1, 2]. This ca-pability is hardwired into the retina. Connected directly to the rods and cones of the retina are two layers of the neu-rons that perform an operation similar to the Laplacian. This operation is called lateral inhibition and helps us to extract boundaries and edges. Therefore, in this paper we focus on this aspect of the shapes and not on the regions they may contain. Object contours however, will have intrinsic intra-class variations. Moreover, object boundary deformation is expected in most imaging applications due to the varying
imaging conditions, sensor noise, occlusion, and imperfect segmentation.
Estimating the similarity between objects shapes can be described in a simplistic way in two steps: shape features extraction and feature comparison. Each of these two steps however represents a difficult problem by itself. Selecting a set of features to characterize a shape for a certain application is not easy, since one must take into consideration the vari-ability of the shapes and the application domain specificity. Feature comparison can be understood as a way of quantify-ing the similarity/dissimilarity between their correspondquantify-ing objects. This is a very difficult problem since it tries to mimic the human perception [2].
(a) (b)
Figure1: (a) The original bird contour before the alignment step, (b) the contour after alignment using three universal axes.
obvious counterpart in the human vision. Therefore, tech-niques based on simple and visually meaningful shape fea-tures have been used in several content-based indexing and retrieval (CBIR) systems, for example, QBIC [4], MUVIS [5, 6] such as high curvature points [7, 8, 9], polygonal ap-proximation [10], morphological and topological features and others [3, 11].
In this paper, we introduce a novel boundary-based ap-proach to shape similarity estimation. This technique is applied to two problems: shape-based image retrieval and performance evaluation of segmentation algorithms. The rest of the paper is organized as follows: Section 2 presents an overview of the proposed method, followed by a de-tailed description of each step. Experimental results for both applications are presented in Section 3, using a subset of the MPEG-7 shape test data and the segmentation masks obtained by the COST Analysis Model (COST AM) [12, 13] segmentation algorithm. In Section 4, conclusions are drawn.
2. THE PROPOSED METHOD
Images in the target applications are representing either: a single object outline or a segmentation mask. Therefore, we will not discuss how to obtain the contour or the segmenta-tion masks. Our goal is to compute a similarity score between any two shapes or two segmentation masks. The proposed method operates in three steps: alignment, boundary to mul-tilevel image transformation, and similarity evaluation. The alignment step is not needed in the case of the segmentation performance evaluation, since we are comparing segmenta-tions masks corresponding to the same image.
Once the boundaries are aligned, the binary images con-taining the boundaries are transformed into multilevel ages through distance transformation [3]. The obtained im-ages are then compared using the ordinal correlation mea-sure introduced in [14, 15]. This ordinal meamea-sure estimates the similarity between the two shapes based on the correla-tion of their corresponding transform images. In the rest of this section we give detailed description of each one of the steps mentioned above.
2.1. Object alignment based on universal axes
The alignment is performed by first detecting three universal axes [16] (those with the largest magnitude) for each shape, then orienting the shape in such a way that these axes are aligned in a standard way for all the objects to be compared. We use the same notation as in [16].
In this implementation of the universal axes determina-tion algorithm we use the version numberµ=2l. The steps of the alignment algorithm are detailed below.
Step1. Translate the coordinate system so that the origin be-comes the center of gravity of the shapeS.
Step2. Compute
and using normalized counterpart (called Universal Axes (UA)) of axes needed to align an object.
Step 4. Compute the directional angles of thel1 universal axes of the shapeSas follows:
θj=
In our implementation we usedl1=3, see Figure 1, since forl1 =2 the two universal axes orientation will verifyθ2 =
θ1+π. Therefore, they cannot be used alone to determine if an object is flipped around the direction they define or not.
Step5. Once the three universal axes are determined, rotate the contour so that the most dominant UA (UA with the largest magnitude) will be aligned with the positivex-axis, see Figure 1.
Step6. Then, if they-component of the second most domi-nant UA is positive, flip the contour around thex-axis.
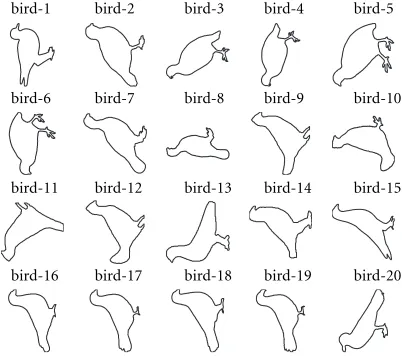
bird-1 bird-2 bird-3 bird-4 bird-5
bird-6 bird-7 bird-8 bird-9 bird-10
bird-11 bird-12 bird-13 bird-14 bird-15
bird-16 bird-17 bird-18 bird-19 bird-20
Figure2: Bird contours from the MPEG-7 shape test set B.
bird-1 bird-2 bird-3 bird-4 bird-5
bird-6 bird-7 bird-8 bird-9 bird-10
bird-11 bird-12 bird-13 bird-14 bird-15
bird-16 bird-17 bird-18 bird-19 bird-20
Figure3: The contours in Figure 2 after alignment.
2.2. Boundary to multilevel image transformation Let Sbe a shape represented by its contour C in a binary image. The binary image is transformed into a multilevel (grayscale) imageGusing a mapping functionφ, such that the pixel values inG,{G1, G2, . . . , Gn}, depend on their rela-tive position to the contour pixelsC1, C2, . . . , Cp:
Gi=φ
Ck:k=1,2, . . . , p
, fori=1,2, . . . , n, (5)
whereCkis the position of the contour pixelkin the image
G. It should be observed that several transformations satisfy this requirement, including any distance transform [3].
As a result of this mapping the information contained in the shape boundary will be spread throughout all the pix-els of the image. Computing the similarity in the transform domain will benefit from the boundary information redun-dancy in the new image. We expect that there is no single op-timal mapping; different mappings will emphasize different features of the contour. We distinguish however two special cases:
• the first is defined as follows:
Gi=
V0−d
Pi, C
, ifdPi, C
< Th,
0, otherwise, (6)
fori = 1,2, . . . , nand V0 > 0 is the value assigned to the pixels on the boundary. The larger the distance
d(Pi, C) from the contour points is, the smaller the new pixel value will be. This mapping function emphasizes the details on the boundary;
• the second mapping is whenV0=0 andGi=d(Pi, C), using a geodesic distance [17]. When this mapping is applied inside the contour only, the emphasis is on the shape skeleton which is a very important feature of a shape, see Figure 4. Applying the distance mapping in-side and outin-side the contour can lead to a better eval-uation of segmentation results. One can even assign different weights inside and outside of the contours.
In this work, we implemented the second mapping based on the geodesic distance. The metric is integer and its appli-cation is done through an iterative wave propagation process [18]. The contour points are considered as seeds during the construction of the distance map. The distance map can be generated inside and/or outside the contour, as stated earlier. The values can increase or decrease starting from the contour and can be limited. The pixel values in the distance map can be therefore written as follows:
Gi=V0±d
Pi, C, fori=1,2, . . . , n, (7)
where,V0is the value on the contour andd(Pi, C) is the dis-tance from any pointPiin the image to the contourC.
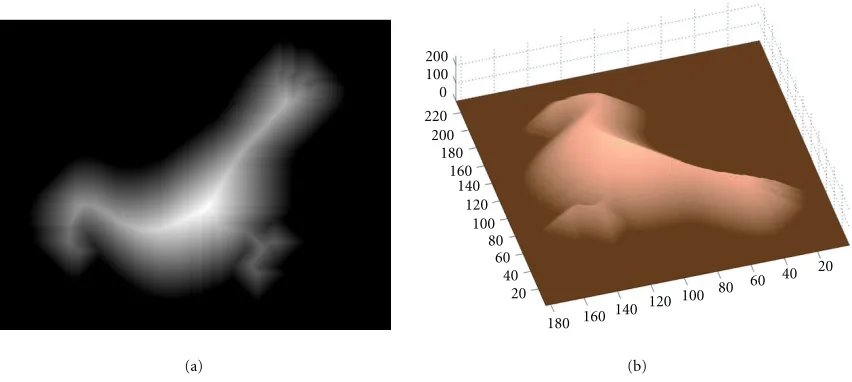
Figure 4a represents an example of a distance map gen-erated only inside the contour of a bird contour. Figure 4b shows a 3D visualization of this distance map.
2.2.1 Similarity evaluation
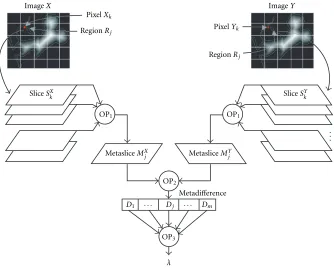
The evaluation of image similarity is based on the frame-work for ordinal-based image correspondence introduced in [14]. Figure 5 gives a general overview of this region-based approach.
Suppose we have two images,X and Y, of equal size. In a practical setting, images are resized to a common size. Let{X1, X2, . . . , Xn}and{Y1, Y2, . . . , Yn}be the pixels of im-ages X and Y, respectively. We select a number of areas {R1, R2, . . . , Rm}and extract the pixels from both images that belong to these areas. LetRX
j andRYj be the pixels from im-ages X andY, respectively, which belong to areas Rj, with
j=1,2, . . . , m.
The goal is to compare the two images using a region-based approach. To this end, we will be comparingRX
j andRYj for each j=1,2, . . . , m. Thus, each block in imageXis com-pared to the corresponding block in imageY in an ordinal fashion. The ordinal comparison of the two regions means that only the ranks of the pixels are utilized. For every pixel
(a)
20 40 60 80 100 120 140 160 180 200 220
0 100 200
180 160 140
120 100 80
60 40 20
(b)
Figure4: (a) The distance map generated for the “bird-19” contour in Figure 1, (b) a 3D view of this distance map.
where
SXk,l=
1, ifXk< Xl,
0, otherwise. (8)
As can be seen, sliceSX
k corresponds to pixelXkand is a binary image of size equal to imageX. Slices are built in a similar manner for imageYas well.
To compare regions RX
j andRYj, we first combine the slices from imageX, corresponding to all the pixels belong-ing to regionRX
j. The slices are combined using the operation OP1(·) into a metasliceMX
j.
Figure 6 shows an illustration of the slices and metaslices creation for a 4×4 image and blocks of 2×2. The four slices
S1,S2,S5, andS6shown in this figure are computed for the four pixels in blockB1. The operation used in this illustration to create the metasliceM1is OP1(·)=(·).
More formally, MX
j = OP1(SXk :Xk∈RXj) for j = 1,2, . . . , m. Similarly, we combine the slices from imageY
to formMYj for j =1,2, . . . , m. It should be noted that the metaslices are equal in size to the original images and could be multivalued, depending on the operation OP1(·). Each metaslice represents the relation between the region it cor-responds to and the entire image.
The next step is a comparison between all pairs of metaslices MX
j andMYj by using operation OP2, resulting in the metadifferenceDj.That is,Dj = OP2(MXj, MYj), j = 1,2, . . . , m. We thus construct a set of metadifferencesD = {D1, D2, . . . , Dm}. The final step is to extract a scalar
mea-sure of correspondence from setD, using operation OP3(·).
In other words,λ =OP3(D). It was shown in [14] that this structure could be used to model the well-known Kendall’sτ
and Spearman’sρmeasures [19].
The image similarity measure used in this paper is an instance of the previously mentioned framework. This mea-sure has been analyzed more extensively by Cramariuc et
al. [15]. Following is a short description of the operations OPk(·), k = 1,2,3 adopted for this measure. Operation OP1(·) is chosen to be the component-wise summation op-eration; that is, metasliceMj is the summation of all slices corresponding to the pixels in block j or in other words,
Mj=k:Xk∈RjSk.
Next, operation OP2(·) is chosen to be the squared Eu-clidean distance between corresponding metaslices. That is,
Dj =||MXj −MYj||22. Finally, operation OP3(·) sums together all metadifferences to produceλ=jDj, for j=1, 2, . . . , m. Small values ofλmean similar objects.
One advantage of this approach over classical ordinal cor-relation measures is its capability to take into account diff er-ences between images at a scale related to the chosen block size.
3. EXPERIMENTAL RESULTS
The proposed technique is applied to two important prob-lems: content-based retrieval of shape images and perfor-mance evaluation of segmentation algorithms. The experi-ments performed are presented and their results analyzed in the rest of this section.
3.1. Shape similarity estimation
λ
OP3
D1 · · · Dj · · · Dm OP2
Metadifference MetasliceMX
j MetasliceMYj OP1
. . . OP1
SliceSX
k SliceSYk
RegionRj PixelYk RegionRj
PixelXk
ImageX ImageY
Figure5: The general framework for ordinal correlation of images.
16 17 5 20
4 4 9 9
4 4 9 9
B1
I
0 1 1 1
1 1 0 1
0 0 1 1
0 0 1 1
S1
0 0 1 1
0 1 0 1
0 0 0 0
0 0 0 0
S2
0 1 1 1
0 1 0 1
0 0 0 0
0 0 0 0
S5
0 0 1 1
0 0 0 1
0 0 0 0
0 0 0 0
S6
0 2 4 4
1 3 0 4
0 0 1 1
0 0 1 1
M1
Figure6: Example of slices and metaslice for a 4×4 image using blocks of 2×2.
of shapes in the set. The similarity scores obtained are pre-sented in Tables 1 and 2. All the scores are multiplied by 103 when they are presented in the tables and the figures. The distance maps were generated inside the objects only with
V0 = 50. This setting emphasizes the shape skeleton and gives less importance to contour pixels. The distance trans-formed images are resized to 32×32 pixels and blocks of size 4 ×4 were used. Larger images can be used if more precision is needed, this would imply the creation of more slices and therefore more computational power would be needed.
Figure 8 represents a surface plot of the similarity scores in Table 1. It shows that within the same category, the scores
con-Table1: Similarity scores for the contours in Figure 3. These scores are multiplied by 103.
bird-16 bird-17 bird-18 bird-19 bird-20
cattle-5 cattle-6 cattle-7 cattle-8 cattle-9
fork-5 fork-6 fork-7 fork-8 fork-9
frog-10 frog-6 frog-7 frog-8 frog-9
Figure7: Contours of test set 2 after alignment.
tours represent the same bird contour rotated or rotated and scaled. Therefore, we can safely say that our measures have a 0.5% error, which can be explained by the small contour variation introduced by rotation and the size reduction of the distance maps. Lower error can be obtained by increasing the size of the distance map images and reducing the block size used for the metaslices creation.
Dark blue regions in Figure 8 represent very low scores (close to zero), which shows that there are quite many objects in this category which are very similar or even identical.
To find out which are the most similar contours to a given contour in Figure 7 we sort the scores on the raw correspond-ing to this contour in Table 2. Uscorrespond-ing Figure 9, one can easily
2
Figure8: The similarity scores for the bird contours in Figure 3, dark blue cells mean most similar contours.
estimate which are the most similar objects within this cat-egory, based on the clustered dark blue cells. Figure 9 shows that similarity scores between subjects from the same cate-gory are low, while those obtained for subjects from different categories are relatively high. Therefore, sorting the scores in ascending order will yield the most similar object first.
Table2: Similarity scores for the contours in Figure 7. These scores are multiplied by 103.
cattle-5 cattle-6 cattle-7 cattle-8 cattle-9 for
k
Figure9: Similarity scores obtained for the contours in test set 2 presented in Figure 7.
3.2. Segmentation quality evaluation
The objective evaluation of the performance of segmentation algorithms is an important problem [20, 21, 22]. Even when a reference mask is available, comparing two segmentation masks is still a difficult problem. Several factors make such evaluation difficult, among the most important factors is the difficulty to discriminate between many small distributed er-ror segments and few larger erer-ror segments.
Our shape correspondence technique proposed in Section 2, discriminates easily between the two cases of seg-mentation errors. The geodesic distance transformation is applied inside each segment of the mask. Therefore, small regions yield small distances inside them and therefore will generate pixels with low gray values.
0 5 10 15 20 25 30 35 40 45 50
Figure10: The segmentation performance scores for frames 4–49 of the sequence “Erik,” for COST AM versions 5.0 and 5.1.
In this experiment, the segmentation masks resulting from the COST AM versions 5.0 and 5.1 [12, 13], are com-pared against a reference mask. The plot in Figure 10, shows the segmentation performance scores obtained by our tech-nique, for the frames 4–49 of “Erik” sequence. The plots in Figures 11 and 12, show quantitative measures of the errors in number of pixels from both COST AM versions 5.0 and 5.1, respectively. Three different numbers are computed for each frame:
5 10 15 20 25 30 35 40 45 50 Frame number
0 500 1000 1500 2000 2500 3000 3500 4000
N
u
mber
of
pix
els
Total error pixels
Object to background error Background to object error
Figure11: Plot of the segmentation errors, for COST AM 5.0.
5 10 15 20 25 30 35 40 45 50
Frame number 0
500 1000 1500 2000 2500 3000 3500 4000
N
u
mber
of
pix
els
Total error pixels
Object to background error Background to object error
Figure12: Plot of the segmentation errors, for COST AM 5.1.
• number of pixels of the foreground segmented as back-ground pixels,
• sum of the two previous numbers.
For illustration we present the colored segmentation masks for frames 15 and 20 from “Erik” sequence in Figures 13, 14, 15, and 16. The frame pixels are colored as follows:
• black represents the background,
• white is the region where the reference and estimated masks overlap,
• green represents the areas of the background seg-mented as part of the object,
• purple represents the regions from the object merged with the background.
Figure13: The colored segmentation error of frame 15 from the sequence “Erik,” segmented using COST AM 5.0.
Figure14: The colored segmentation result of frame 15 from the sequence “Erik,” segmented using COST AM 5.1.
Figure15: The colored segmentation result of frame 20 from the sequence “Erik,” segmented using COST AM 5.0.
It can be easily seen that our segmentation performance scores in Figure 10, correlate very well with the variation of the total number of pixel errors. Moreover, it reflects the vari-ation in both types of segmentvari-ation errors. Our measure in-herently resolves the case of many small errors and the case of a single large error region.
4. CONCLUSIONS AND FUTURE WORK
In this paper, we proposed a contour correspondence mea-sure, based on distance transformation and ordinal correla-tion. The similarity scores obtained are in line with the vi-sual perception of the similarity between shapes. We showed that the proposed measure can be used in two applications: shape similarity estimation in the context of content-based image retrieval, and for performance evaluation of segmen-tation algorithms. Simulation results were presented for both applications using images from the MPEG-7 shape test set B for the first application, and 50 frames from “Erik” sequence for the second. The proposed technique produced encourag-ing results in both experiments. Further study is needed to optimize the proposed technique in order to select appropri-ate parameters for the application at hand. Finally, further analysis of the behavior of the proposed technique may iden-tify new applications.
REFERENCES
[1] C. Hildreth, “The detection of intensity changes by
com-puter and biological vision systems,” inProc. Computer Vision,
Graphics, and Image Processing, vol. 22, pp. 1–27, 1983. [2] T. V. Papathomas, “Special issue on visual-perception: guest
editorial,”International Journal of Imaging Systems and
Tech-nology, vol. 7, no. 2, pp. 63–64, 1996.
[3] L. da F. Costa and R. M. Cesar Jr.,Shape Analysis and
Classifi-cation: Theory and Practice, CRC Press, Boca Raton, Fla, USA, 2001.
[4] M. Flickner, H. Sawhney, W. Niblack, et al., “Query by image
and video content: The qbic system,” IEEE Computer
Maga-zine, vol. 28, no. 9, pp. 23–32, 1995.
[5] C. F. Alaya, B. Cramariuc, C. Reynaud, et al., “Muvis: a sys-tem for content-based indexing and retrieval in large image
databases,” inProc. SPIE/EI ’99 Conference on Storage and
Re-trieval for Image and Video Databases VII, vol. 3656, pp. 98– 106, San Jose, Calif, USA, January 1999.
[6] M. Trimeche, C. F. Alaya, M. Gabbouj, and B. Cramariuc, “Content-based description of images for retrieval in large
databases: Muvis,” inProc. X European Signal Processing
Con-ference, Tampere, Finland, September 2000.
[7] C. H. Teh and R. T. Chin, “On the detection of dominant
points on digital curves,”IEEE Trans. on Pattern Analysis and
Machine Intelligence, vol. 11, no. 8, pp. 859–872, 1989. [8] S. Abbasi, F. Mokhtarian, and J. Kittler, “Curvature scale space
image in shape similarity retrieval,”Springer Journal of
Multi-media Systems, vol. 7, no. 6, pp. 467–476, 1999.
[9] A. Quddus, C. F. Alaya, and M. Gabbouj, “Wavelet-based
multi-level object retrieval in contour images,” inProc.
In-ternational Workshop on Very Low Bit Rate Video Coding, pp. 1–5, Kyoto, Japan, October 1999.
[10] M. W. Koch and R. L. Kashyap, “Using polygon to recognize
and locate partially occluded objects,”IEEE Trans. on Pattern
Analysis and Machine Intelligence, vol. 9, no. 4, pp. 483–494, 1987.
[11] J. C. Russ, The Image Processing Handbook, CRC, Springer
and IEEE Press, 3rd edition, 1999.
[12] A. Alatan, L. Onural, M. Wollborn, R. Mech, E. Tuncel, and T. Sikora, “Image sequence analysis for emerging interactive multimedia services—the European COST 211 framework,” IEEE Trans. Circuits and Systems for Video Technology, vol. 8, no. 7, pp. 802–813, 1998.
[13] M. Gabbouj, G. Morrison, C. F. Alaya, and R. Mech, “Redun-dancy reducation techniques and content analysis for mul-timedia services—the European COST 211quat action,” in Proc. Workshop on Image Analysis for Multimedia Interactive Services, Berlin, Germany, 31 May–1 June 1999.
[14] I. Shmulevich, B. Cramariuc, and M. Gabbouj, “A framework
for ordinal-based image correspondence,” inProc. X
Euro-pean Signal Processing Conference, Tampere, Finland, Septem-ber 2000.
[15] B. Cramariuc, I. Shmulevich, M. Gabbouj, and A. Makela, “A new image similarity measure based on ordinal correlation,” inProc. International Conference on Image Processing, vol. 3, pp. 718–721, Vancouver, BC, Canada, September 2000.
[16] J. C. Lin, “The family of universal axes,”Pattern Recognition,
vol. 29, no. 3, pp. 477–485, 1996.
[17] P. J. Toivanen, “New geodesic distance transforms for
gray-scale images,” Pattern Recognition Letters, vol. 17, no. 5, pp.
437–450, 1996.
[18] I. Ragnelmam, “Neighborhoods for distance transformations
using ordered propagation,” Computer Vision, Graphics and
Image Processing, vol. 56, no. 3, pp. 399–409, 1992.
[19] M. Kendall and J. D. Gibbons,Rank Correlation Methods,
Ed-ward Arnold, New York, 5th edition, 1990.
[20] P. Villegas, X. Marichal, and A. Salcedo, “Objective evaluation
of segmentation masks in video sequences,” inProc. Workshop
on Image Analysis for Multimedia Services (WIAMIS ’1999), Berlin, Germany, May 1999.
[21] R. Mech, “Objective evaluation criteria for 2D-shape
estima-tion results of moving objects,” inProc. Workshop on Image
Analysis for Multimedia Services, pp. 23–28, Tampere, Finland, May 2001.
[22] R. Mech and F. Marqu s, “Objective evaluation criteria for 2D-shape estimation results of moving objects,” EURASIP Jour-nal of Applied SigJour-nal Processing, Special Issue: Image AJour-nalysis for Multimedia Interactive Services, 2002.
Faouzi Alaya Cheikh received his B.S. degree in electrical engineering in 1992 from ´Ecole Nationale d’Ing´enieurs de Tu-nis, Tunisia. He received his M.S. degree in electrical engineering (Major in Signal Pro-cessing) from Tampere University of Tech-nology, Finland, in 1996. Mr. Alaya Cheikh is currently a Ph.D. candidate and works as a Researcher at the Institute of Signal Pro-cessing, Tampere University of Technology,
Bogdan Cramariucreceived his M.S. de-gree in electrical engineering in 1993 from Polytechnica University of Bucharest, Fac-ulty of Electronics and Telecommunica-tions, Bucharest, Romania. Mr. Cramariuc is currently a Ph.D. candidate and works as Researcher for the Institute of Signal Pro-cessing at Tampere University of Technol-ogy, Tampere, Finland. From 1993 to 1994 he worked as Teaching Assistant at the
Fac-ulty of Electronics and Telecommunications at the Polytechnica University of Bucharest. During this period he has also been in-volved as Researcher with Electrostatica S.A., a national research institute in Bucharest, Romania. Since 1995 he has been with the Institute of Signal Processing at Tampere University of Technology, Tampere, Finland. His research interests include signal and image analysis, image segmentation, texture analysis, content-based in-dexing and retrieval in multimedia databases, mathematical mor-phology, computer vision, parallel processing, data mining, and ar-tificial intelligence. Mr. Cramariuc has been an active member in several Finnish and European projects, such as Nobless, Esprit and MUVI. He served as Associate Editor of the EURASIP Journal on Applied Signal Processing, Special Issue on Image Analysis for Mul-timedia Interactive Services.
Mari Partiowas born 1979 in Finland. Autumn 1998 she started her M.S. studies at Tampere University of Technology in depart-ment of Electric Engineering. She is majoring in Signal Process-ing and her minor is Software EngineerProcess-ing. Since summer 2000 she has been working as a research assistant at the Institute of Signal Processing. Her research interests include content-based image and video retrieval.
Pasi Reijonenwas born 1976 in Finland. Started at Tampere Uni-versity of Technology in Automation Degree Program 1996 and received M.S. degree 2001. Major: Electronics. Minor: Industrial Management, Automation and Control Engineering. For the aca-demic year 1999–2000, he was as an Erasmus student in England (University of Leeds). Currently he is working as a researcher at Tampere University of Technology at Institute of Signal Processing. His research interests are Shape Analysis for Content-Based Image Retrieval.
Moncef Gabbouj received his B.S. degree in electrical engineering in 1985 from Ok-lahoma State University, Stillwater, and his M.S. and Ph.D. degrees in electrical en-gineering from Purdue University, West Lafayette, Indiana, in 1986 and 1989, re-spectively. Dr. Gabbouj is currently a pro-fessor and Head of the Institute of Signal Processing of Tampere University of Tech-nology, Tampere, Finland. From 1995 to
1998 he was a professor with the Department of Information Technology of Pori School of Technology and Economics, Pori, and during 1997 and 1998 he was on sabbatical leave with the Academy of Finland. From 1994 to 1995 he was an associate pro-fessor with the Signal Processing Laboratory of Tampere Uni-versity of Technology, Tampere, Finland. From 1990 to 1993 he was a senior research scientist with the Research Institute for Information Technology, Tampere, Finland. His research inter-ests include nonlinear signal and image processing and analysis, content-based analysis and retrieval and mathematical morphol-ogy. Dr. Gabbouj is the Vice-Chairman of the IEEE-EURASIP NSIP
(Nonlinear Signal and Image Processing) Board. He is currently the Technical Committee Chairman of the EC COST 211quat. He
served as associate editor of theIEEE Transactions on Image
Process-ing, and was guest editor of the European journalSignal Processing,