aCORN: Measuring the electron-antineutrino correlation in
neutron beta decay
F.E. Wietfeldt1,a, W.A. Byron1,b, B. Collett2, G. Darius1, C.R. DeAngelis1, M.S. Dewey3, M.T. Hassan1,c, G. Jones2, A. Komives4, M.P. Mendenhall3,d, J.S. Nico3, and E.J. Stephenson5
1Tulane University, New Orleans, LA 70118, USA 2Hamilton College, Clinton, NY 13323, USA
3National Institute of Standards and Technology, Gaithersburg, MD 20899, USA 4DePauw University, Greencastle, IN 46135, USA
5Indiana University, Bloomington, IN 47408, USA
Abstract. The aCORN experiment uses a novel asymmetry method to measure the electron-antineutrino correlation (a-coefficient) in free neutron decay that does not require precision proton spectroscopy. aCORN completed two physics runs at the NIST Center for Neutron Research. The first run on the NG-6 beam line obtained the result a=0.1090+/−0.0030(stat)+/−0.0028 (sys), the most precise to date. The second run on the new NG-C high flux beam line promises an improvement in precision to<2%. In addition we show that an improved measurement of the neutrino asymmetry (B-coefficient) can be made using the aCORN apparatus on a highly polarized neutron beam.
1. Introduction
The most important experimental observables of neutron beta decay are described by the formula of Jackson, Treiman, and Wyld [1]
N ∝ 1
τn F (Ee)
1+a pe· pν EeEν +
bme Ee
+P·
Ape
Ee + B pν
Eν + D
( pe×pν) EeEν
. (1)
Here Ee, pe, me are the beta electron total energy, momentum, and mass; pν, Eν are the antineutrino momentum and energy; and F (Ee) is the beta energy spectrum. The neutron decay lifetime is τn and the parameters a, A, B, and D are correlation coefficients that are experimentally measured. It is assumed here that the neutrons are in a spin polarization stateP, while the beta electron and antineutrino spins are averaged over. In the Standard Model, the neutron a coefficient is given by [1]
a = 1−λ
2
1+3λ2, (2)
where λ is the ratio of axial vector (GA) and vector (GV) coupling constants. The best current determination of λ comes from the beta asymmetry ( A coefficient) due to its much smaller experimental uncertainty. The a and A coefficients have similar sensitivity to λ but
ae-mail:[email protected]
bCurrent address: University of Washington, Seattle, WA, USA
cCurrent address: NIST, Gaithersburg, MD, USA
dCurrent address: Lawrence Livermore National Laboratory,
Livermore, CA, USA
different sensitivities to beyond Standard Model physics. A precise comparison of the a and A coefficients can provide improved limits on scalar and tensor weak currents [2], a sensitive test of the conserved-vector-curent (CVC) hypothesis, and improved limits on second-class weak currents [3]. A significant reduction in the uncertainty of the neutron a coefficient could also give an improved value ofλand eventually an improved determination of Vud.
2. The aCORN experiment
5.0
4.5
4.0
3.5
3.0
2.5
proton-electron time of flight, TOF (
µ
s)
1000 800
600 400
200 0
beta energy (keV)
aCORN data 5.0
4.5
4.0
3.5
3.0
2.5
proton-electron time of flight, TOF (
µ
s)
1000 800
600 400
200 0
beta energy (keV)
Monte Carlo simulation
Figure 1. The aCORN “wishbone” histogram plot of proton time of flight vs. beta energy for delayed coincidence neutron decay events. Top: a Monte Carlo simulation using the aCORN geometry, with uniform axial magnetic and electric fields, a Gaussian energy resolution function, and and perfect (delta function) time resolution. Bottom: A sample of aCORN data. Blue pixels are positive and red are negative (due to the background subtraction).
A plot of proton time-of-flight (TOF) vs. beta energy for coincidence events forms a characteristic wishbone shape, shown in Fig. 1. The lower branch (group I) contains faster protons, where the electron and antineutrino momenta were correlated. The upper branch (group II) contains slower protons, where they were anticorrelated. For each vertical slice of beta energy (E), we calculate the wishbone asymmetry X (E) from the counts of group I (NI(E)) and group II (NI I(E)) events
X (E)= N
I(E)−NI I(E)
NI(E)+NI I(E). (3)
Using Eq. (1) and the calculated momentum acceptances for electrons and protons, it is straightforward to derive an expression relating X (E) to the a coefficient [11]
X (E)=a fa(E) [1+δ1(E)]+δ2(E). (4)
The geometric function fa(E) accounts for the momentum acceptances of coincidence events. It depends on the axial magnetic field and collimator geometry and can be accurately calculated by Monte Carlo. There are two very small corrections. The first, δ1(E), is a geometric
correction with a numerical value of−0.003. The second,
δ2(E), results from the effect of the proton kinetic energy
on the effective antineutrino acceptance; it has a numerical value of+0.0013. Bothδ1(E) andδ2(E) are calculated by
Monte Carlo.
neutron beam
electron collimator
beta spectrometer electrostatic mirror
proton collimator main magnet coils
proton detector
yoke liquid nitrogen, high voltage,
and vacuum manifolds
3.5 m
Figure 2. A diagram of the aCORN apparatus showing the major components and arrangement.
The aCORN experiment was installed and operated on the end position NG-6 at the National Institute of Standards and Technology (NIST) Center for Neutron Research (NCNR) [12] from February 2013 to May 2014, where it collected 1900 beam hours of physics data. A diagram of the aCORN apparatus is shown in Fig. 2. The main magnet was a set of 25 water-cooled flat coils that produced a 36.2 mT axial magnetic field. 25 axial trim coils and 45 transverse trim coils, each independently served by computer-controlled current supplies, were used to limit transverse magnetic fields in the electrostatic mirror and proton collimator.
design and operation of the beta spectrometer can be found in a previous publication [14]. The proton detector was a 600 mm2 liquid-nitrogen cooled silicon surface barrier
detector and a set of focusing electrodes, held at−29 kV and mounted slightly off axis so that electrons with upward trajectories cannot backscatter from it and subsequently reach the beta spectrometer.
3. Data analysis and results
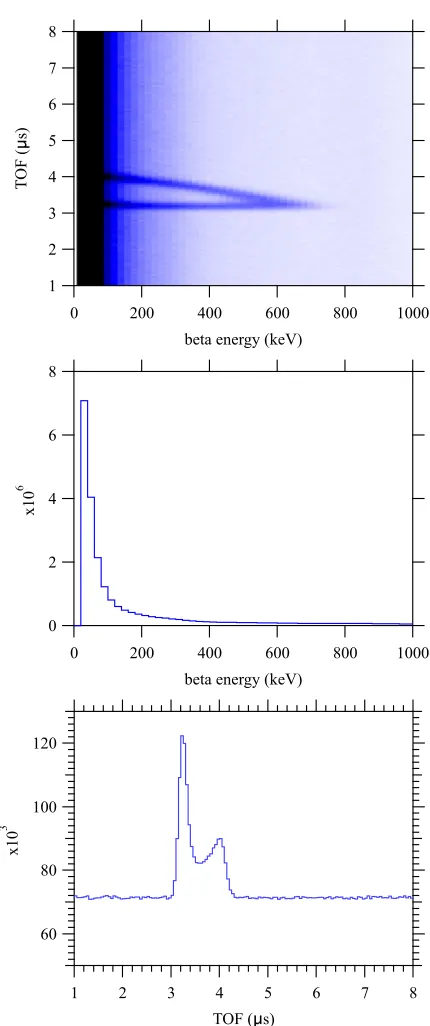
Figure3 (top) shows a raw wishbone plot from a typical data set, about 400 beam hours. Neutron beam-induced background was significant; the coincidence signal to background ratio was typically about 0.4 in the wishbone region. The data acquisition system treated every electron signal that arrived within 10µs before or 1µs after each proton signal as a separate event. Therefore random coincidences associated with background had no time structure – there was an energy dependence (Fig.3middle) but the background TOF spectrum was flat (Fig.3bottom) within statistical fluctuations, enabling a clean and precise background subtraction at each energy. Figure1(bottom) shows the resulting background-subtracted wishbone. The energy calibration of the beta spectrometer was monitored every 2–3 days using a pair of in situ conversion electron sources, typically207Bi and113Sn. These calibrations were
used to correct minor gain drifts within a data set. To obtain the final energy calibration of each data set, the wishbone energy spectrum (the wishbone histogram as in Fig.1 summed over TOF and plotted vs. energy) was fit to the theoretical spectrum, shown in Fig. 4. The theoretical spectrum was calculated from the Fermi beta decay distribution with the aCORN transverse momentum cuts applied and convoluted with a Gaussian energy resolution function with width proportional to√E. Four parameters were allowed to vary in the fit: the energy calibration linear slope and offset, a vertical scale factor, and the energy resolution width factor. This procedure provided an absolute energy scale determined to a relative precision of 0.5%.
The wishbone asymmetry X (E) was calculated in the energy range 100 keV–360 keV. Events with electron energy below 100 keV were not included because: 1) due to the expansion of the magnetic field in the beta spectrometer, not all electrons below 100 keV will strike the active scintillator, which complicates the calculation of the geometric acceptance function fa(E); 2) the maximum transverse momentum acceptance of electrons corresponds to kinetic energy about 80 keV, so accepted low energy electrons can have axial momenta close to zero; and 3) the background is much higher at low energy. For electron energies above 360 keV the wishbone branches overlap and it is difficult to measure the asymmetry precisely.
If the neutron beam were polarized, the neutrino asymmetry (B coefficient) in Eq. (1) would contribute another term that adds to the wishbone asymmetry
X (E)=a fa(E)±P B fB(E) (5)
(omitting the small corrections), where P is the neutron polarization and fB(E) is a different geometric function associated with the neutrino asymmetry. The positive (negative) sign applies when the axial magnetic field
8
7
6
5
4
3
2
1
T
OF (
s)
1000 800
600 400
200 0
beta energy (keV)
8
6
4
2
0
x10
6
1000 800
600 400
200 0
beta energy (keV)
120
100
80
60
x10
3
8 7 6 5 4 3 2 1
TOF ( s)
Figure 3. Top: A raw wishbone plot prior to background subtraction. Middle: The raw wishbone summed over time of flight, showing total counts vs. beta energy. Bottom: The raw wishbone summed over beta energy, showing total counts vs. time of flight.
direction is toward the proton (electron) detector, i.e., up or down. The B coefficient is much larger than the a coefficient, and a phase space enhancement makes fB(E) about 40% larger than fa(E), so aCORN is very sensitive to neutron polarization. The NG-6 beam is nominally unpolarized, but the 58Ni neutron guide is magnetic and superconducting magnets in its vicinity could cause a slight unwanted neutron polarization. To accomodate this possibility, we collected data with both directions of the axial magnetic field. A simple average of the a coefficients obtained with magnetic field up (aup) and down (adown)
35x103
30
25
20
15
10
5
0
Counts
800 600
400 200
0
beta energy (keV)
aCORN neutron decay data best fit to theoretical beta spectrum
2
= 34.3 / 32 = 1.07
-800 -400 0 400 800
residual (data - fit)
800 600
400 200
0
beta energy (keV)
Figure 4. Top: The wishbone energy spectrum, a histogram of total wishbone events vs. beta energy, fit to the theoretical beta spectrum modified by the aCORN momentum acceptances.
Bottom: Fit residuals. Error bars are statistical uncertainty.
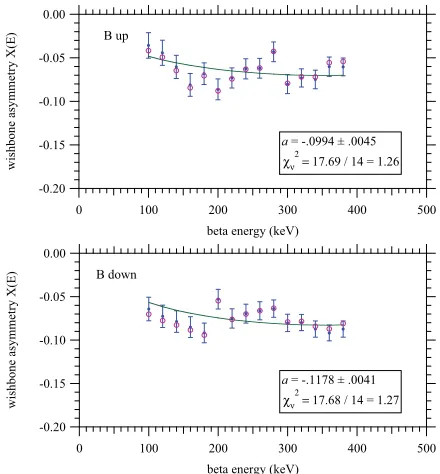
Figure 5 shows the measured wishbone asymmetry X (E) for the full data set for each magnetic field direction. Open circles are uncorrected data. Solid circles include the calculated energy-dependent corrections for δ1(E)
and δ2(E), and also the energy-dependent systematic
corrections for the electrostatic mirror, proton soft threshold, and electron energy loss in the grid wires. Error bars are statistical. Also shown is the function fa(E) multiplied by the best-fit value of the a coefficient for each field direction. A neutron beam polarization of P ≈0.006 would be sufficient to explain the observed difference, and we believe that is the cause, as the difference does not correlate with any other experimental conditions during the run. Therefore we use the simple average and obtain aave=−0.1086±0.0030 (statistical uncertainty).
4. Systematic effects
The following summarizes the most important systematic effects:
• Electrostatic mirror field: The ideal electrostatic
mirror for aCORN would have a perfectly axial electric field. Unfortunately the wire grids at the upper and lower ends needed to transport electrons and protons into their respective collimators necessarily create transverse electric fields. This is most problematic at the upper grounded grid through which the protons pass. A transverse electric field there will deflect the fast and slow proton groups differently, causing their transverse momentum acceptance in the collimator to differ. This can create a false wishbone asymmetry. A detailed 3D finite element model of the mirror, including the precise geometry of the wire grid, was built in COMSOL [13,15]. The calculated 3D electric field map was input into a Runge-Kutta
proton transport simulation of aCORN to calculate the false wishbone asymmetry. This gave an energy depended correction that produced a net (+5.5± 1.1)% correction to our a-coefficient result.
• Electron scattering: If a beta electron scatters from
any material while being transported from the decay region to the beta spectrometer, or backscatters from the plastic scintillation energy detector (about 5% probability), its full decay energy will not be measured. Such events will tend to fill in the kinematically forbidden gap between the wishbone branches (see Fig. 1) and may produce a false asymmetry. The beta spectrometer included an array of veto detectors to mitigate this effect; the overall veto efficiency was found to be approximately 90% (see [14] for details). The electrostatic mirror, collimators, proton detector, and top of the vacuum chamber were all designed to minimize the possibility of an electron scattering from any material and subsequently being transported into the beta spectrometer. A detailed Monte Carlo analysis found this to be about a 1% effect. The overall effect of electron scattering on the a-coefficient result can be estimated directly from the measured event rate in the wishbone gap between the fast and slow branches. It was found to be consistent with zero, with a statistical uncertainty due to the background subtraction. This gave a systematic correction of (−1.4±1.4)% to our result.
• Proton energy threshold: The low energy
thresh-old for proton detection was not perfectly sharp, and it was found that a small fraction of the proton energy peak (1.4%) was removed by the energy threshold. While all detected protons are accelerated to an energy (28 keV) much higher than their original decay energy (0.75 keV maximum), there remains a slight correlation between the wishbone branch (fast/slow) and the detected energy. Therefore the threshold effect causes a small systematic shift in the wishbone asymmetry. This was estimated by measuring the threshold energy function of the data acquisition system and applying it to the Monte Carlo simulation of aCORN. This procedure produced a (−3.0±0.7)% correction to the a-coefficient.
• Magnetic field shape: A transverse magnetic field
component within the proton transport region of the electrostatic mirror and collimator will tend to cause protons from the two groups to be collimated differently, creating a false asymmetry. A robotic field mapping system, along with computer controlled axial and transverse trim coils, were used to reduce the transverse magnetic field to less than 0.004 mT everywhere in this region. The full 3D shape of the magnetic field was computed using finite element model in COMSOL, including the effects of the iron flux return and nearby shield walls. It agreed well with the measured map. The 3D field map was included in the aCORN Monte Carlo simulation and resulted in a (+0.3±0.7)% correction to our result.
• Residual gas interactions: Protons that interact
in a larger time-of-flight in the wishbone plot. Neutralized protons cannot be detected and so will eliminate some events. Monte Carlo simulations have shown that these two cases tend to produce opposite effects on the measured asymmetry: scattering tends to decrease the asymmetry and neutralization to increase it (due to a slight energy dependence).We accounted for this by performing several data runs with the pressure in the apparatus deliberately raised from about 8×10⁻⁵Pa to 3×
10−3,Pa and then scaling the observed shift in
the wishbone asymmetry. The resulting systematic correction was +0.4%.
• Proton focusing: The proton focusing system
was designed to accelerate and focus both groups of neutron decay protons onto the detector with high and essentially equal efficiency, otherwise a false asymmetry may result. In the experiment we are concerned with imperfect focusing caused by 1) slight mechanical misalignment of components and 2) deviations of the electric and magnetic fields from the design fields. At several times during the experiment, a coordinate measuring machine was used to locate the three-dimensional positions and orientations of all electrodes and the detector in situ relative to the experimental coordinate system. These results were used to make a post-design model of the electric fields. To test the accuracy of the simulated fields compared to the actual fields, a set of thin copper masks with different size and shape apertures was made and individually placed in front of the detector. For each mask, the ratio of masked to unmasked neutron decay proton events was measured and compared to the equivalent ratios in the aCORN proton transport simulation. By making small adjustments of the proton detector assembly (detector, ring electrode, and fork electrode) position in the simulation, good agreement was found between the simulated mask ratios and the measured ratios. This process produced our best determination of the actual experimental focusing conditions and the uncertainty in position. Figure 6 shows the final result of the simulation. The correction to our result from this was negligible.
After systematic corrections our result from the NG-6 run is a=0.1090+/−0.0030 (stat) +/−0.0028 (sys), a net relative uncertainty of 3.8%. A full list of systematic effects considered and a detailed uncertainty budget can be found in [11,16].
5. The NG-C run
In late 2014 aCORN was moved to the new high-flux end position NG-C at the NCNR. NG-C is a curved, ballistic, m=3.9 supermirror guide. The capture flux at NG-C, after the aCORN collimation, was about a factor of five higher than on NG-6. We made a improvement to the electrostatic mirror, replacing the parallel wire grid at the top with a crossed wire grid, which is expected to significantly reduce the electrostatic mirror correction The experiment collected physics data from September 2015 to October 2016, sufficient for a statistical ucertainty of about
-0.20 -0.15 -0.10 -0.05 0.00
wishbone asymmetry X(E)
500 400
300 200
100 0
beta energy (keV) B down
a = -.1178 ± .0041 2
= 17.68 / 14 = 1.27 -0.20
-0.15 -0.10 -0.05 0.00
wishbone asymmetry X(E)
500 400
300 200
100 0
beta energy (keV) B up
a = -.0994 ± .0045 2
= 17.69 / 14 = 1.26
Figure 5. Open circles: The measured, uncorrected, wishbone asymmetry X (E) for each magnetic field direction. Solid points: The same data including the corrections δ1(E), δ2(E), and
the energy-dependent systematic corrections. Error bars are statistical uncertainty. Solid curves: the product a fa(E), where a is the best fit value of the a coefficient in each case.
Figure 6. Results from the proton focusing simulation. The black circle indicates the active region of the detector. Gray pixels are protons that struck the active region (99.97%). Red circles are protons that struck an inactive part of the detector (0.02%). Green circles are protons that struck the focusing ring (0.008%). An additional 0.002% missed the proton detection assembly and were lost.
1%. These data are currently being analyzed. We hope to obtain a net uncertainty below 2% from this run.
6. aCORN B
5.0
4.5
4.0
3.5
3.0
2.5
proton time-of-flight (µ
s)
800 600
400 200
0
beta enegy (keV)
P = +1
5.0
4.5
4.0
3.5
3.0
2.5
proton time-of-flight (µ
s)
800 600
400 200
0
beta enegy (keV)
P = -1
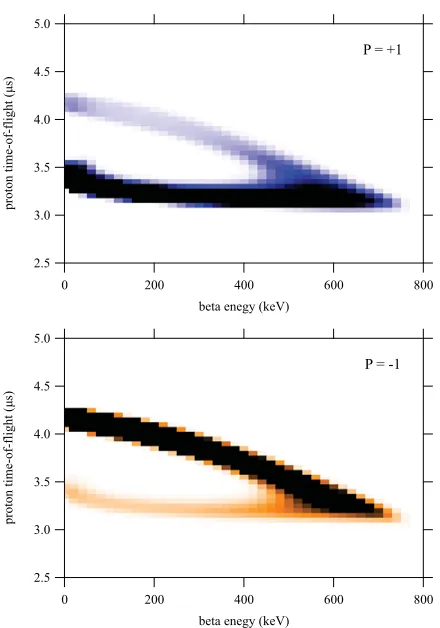
Figure 7. Monte Carlo simulation of the aCORN wishbone on a highly polarized neutron beam for two spin flip states Pup(Top)
and Pdown(Bottom).
polarizer system [17], adiabatic neutron spin flipper, and
3He spin filter polarization analyzer as employed in the
PERKEO II experiment at the ILL [18], and for planning purposes we assume that similar results can be achieved, i.e. 99.7% neutron polarization, 100% spin flip efficiency, and polarization uncertainty of 1.0×10⁻³. The existing
aCORN apparatus can be mounted for this measurement on a polarized beam without modifications. The expected wishbone asymmetry with a polarized beam is quite large, as can be seen in the Monte Carlo simulation shown in Fig. 7. In accordance with Eq. (5), the difference in wishbone asymmetries for the two flip states yields the B-coefficient: X (E)+−X (E)−=2P B fB(E) and the sum gives the a-coefficient: X (E)++X (E)−=2a fa(E). The largest systematic contributions to X (E), in fact all of the systematics presented in Sect. 3, are independent of neutron spin and they will cancel in taking the difference X (E)+−X (E)−, so we expect the final systematic uncertainty in aCORN B to be much smaller than in aCORN. We assume a factor of ten reduction in neutron flux due to the polarizer system, but the lower statistical rate is more than compensated by the increase in size of the wishbone asymmetry. We estimate that in a two year
run on the NCNR NG-C end position a final uncertainty of<0.3% can be obtained, an improvement over the best previous measurements of the B-coefficient [19,20]. We hope to begin aCORN B in the next three years.
This work was supported by the National Science Foundation, U.S. Department of Energy Office of Science, and NIST (US Department of Commerce). We thank the NCNR for providing the neutron facilities used in this work, and for technical support, especially Eli Baltic, George Baltic, and the NCNR Research Facilities Operations Group.
References
[1] J.D. Jackson, S.B. Treiman, H.W. Wyld, Nucl. Phys.
4, 206 (1957)
[2] N. Severijns, M. Beck, O. Navillat-Cuncic, Rev. Mod. Phys. 78, 991 (2006)
[3] S. Gardner, C. Zhang, Phys. Rev. Lett. 86, 5666 (2001)
[4] V.K. Grigor’ev, A.P. Grishen, V.V. Vladimirskii, E.S. Nikolaevskii, D.P. Zharkov, Sov. J. Nucl. Phys. 6, 239 (1968)
[5] C. Stratowa, R. Dobrozemsky, P. Weinzierl, Phys. Rev. D 18, 3970 (1978)
[6] J. Byrne et al., J. Phys. G 28, 1325 (2002)
[7] S. Balashov, Yu. Mostovoy, Russian Research Center Kurchatov Institute Preprint IAE-5718 /2, Moscow (1994)
[8] B.G. Yerozolimsky et al., arXiv: nucl-ex/0401014 (2004)
[9] F.E. Wietfeldt et al., Nucl. Instr. Meth. A545, 181 (2005)
[10] F.E. Wietfeldt et al., Nucl. Instr. Meth. A611, 207 (2009)
[11] B. Collett et al., Rev. Sci. Instr. 88, 083503 (2017) [12] www.ncnr.nist.gov.
[13] Certain trade names and company products are mentioned in the text or identified in illustrations in order to adequately specify the experimental procedure and equipment used. In no case does such identification imply recommendation or endorsement by the National Institute of Standards and Tech-nology, nor does it imply that the products are necessarily the best available for the purpose [14] T. Hassan et al., Nucl. Instr. Meth. A 867, 51 (2017) [15] COMSOL, Inc., Burlington, MA 01803, USA,
//www.comsol.com
[16] G. Darius et al., Phys. Rev. Lett. 119, 042502 (2017) [17] M. Kreuz, V. Nesvizhevsky, A. Petoukhov, T.
Soldner, Nucl. Instr. Meth. A547, 583 (2005) [18] D. Mund et al., Phys. Rev. Lett. 110, 172502 (2013) [19] A. Serebrov et al., JETP 86, 1074 (1998)