Copyright to IJIRSET www.ijirset.com 2011
Application of Two-Level Half Factorial Design
Technique for Developing Mathematical Models
of Bead Penetration and Bead Reinforcement in
SAW Process
.Vijay Kumar Panwar1, Deepak Kumar Choudhary2
M.Tech Student, Dept. of Mechanical Engg., Y.I.E.T / Kurukshetra, Yamunanagar, Haryana, India1
Assistant Professor, Dept. of Mechanical Engg., Y.I.E.T / Kurukshetra, Yamunanagar, Haryana, India2
ABSTRACT:In the present work two level half factorial design techniques is used to develop the mathematical models for bead geometry parameters like weld bead penetration and reinforcement height. The practical were performed on automatic SAW machine by making bead-on plate of 12mm thick carbon steel plates. The process variables were taken as welding current, arc voltage, welding speed and nozzle to plate distance. Main and interaction effects of process variables on the responses were analyzed with the help of 2D and 3D graphs. The models developed have been checked for their adequacy and significance by using F-test and t-test, respectively with the help of Design Expert software. Result represents that bead penetration and reinforcement increases with the increase in welding current while decreases with the increase in arc voltage and nozzle to plate distance. Nozzle to plate distance has no significant effect on both bead penetration and reinforcement.
Keywords: Bead geometry, Mathematicalmodel, Response, Two-level half factorial design technique, Design Expert Software.
I. INTRODUCTION
In today’s manufacturing world the quality of the product play a vital role in the market value of the product and every manufacturing industry wants to produce their product at minimum cost without sacrificing the quality of the product. Welding is the widely used joining process in fabrication industries. It is more economical and is a much faster process compared to both casting and riveting. The submerged arc welding process is mostly used for making circumferential joints in heavy pressure vessels, boilers and pipes due to their deep penetration, high depositionrate, high speed and good surface quality [1]. The quality of weld depends on the bead geometry. The weld bead penetration, bead width and reinforcement height are the important parameters of bead geometry. So to automate the SAW process, it is must to develop the mathematical models for the bead geometry. Bead geometry depends on the process control variables such as welding current, arc voltage, welding speed and nozzle to plate distance. Many researchers have been worked for developing the relation between the bead geometry and process parameters in SAW process. V.K. Gupata&.Parmar et al [1986] used fractional factorial design technique to predict bead geometry parameters in SAW. S. Kumanan,J.EdwinDhas&K.Gowthaman et al [2006] Apply Taguchi technique and regression analysis to determine the optimal process parameters for submerged arc welding (SAW). Vinod Kumar et al [2011] developed mathematical models have to relate the process variable to weld bead parameters, Deepak Kumar Choudhary, Sandeep Jindal and N.P.Mehta et al [ 2011] conducted experiment on submerged arc welding by making bead on steel plate (SS-304) to investigate the effect of welding parameters on bead geometry. ShahanwazAlam, DR. M.I.Khan et al [2011]in their study use 2 – level full factorial technique to conduct experiment and to develop relationship mathematical models for predicting the weld bead penetration. RatiSaluja and K. M. Moeed et al [2012] conduct the experiment on SAW to get the effect of process variable on bead geometry.
Copyright to IJIRSET www.ijirset.com 2012
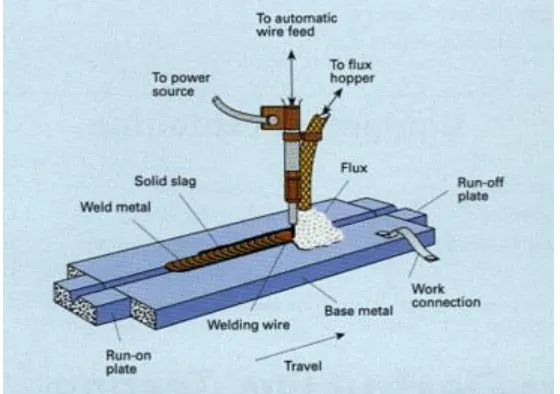
Figure 1:Process diagram-Submerged Arc Welding
III.EXPERIMENTATION The research work was planned to be carried out in the following steps.
3.1Identification of the Process Variable and finding their Working Range
The process variables were selected on the basis of their effect on bead geometry and ease of control. Four independently controllable process variables were selected namely the welding current (I), open circuit voltage (v), travel speed(s) and nozzle to plate distance (N). The working range was fixed by conducting trail and run by varying one of the process variables at a time while keeping the rest of them at constant value. The upper and lower limits were called as+1and -1, respectively. The selected process parameters and their upper and lower limits together with notations and units are given in table 1.
Table 1: Welding Parameters with levels:
S.No. Parameters Unit Symbol Levels
Low (-1) High (+1)
1 Welding current Amp I 250 450
2 Arc Voltage Volt V 30 32
3 Welding Speed m/hr S 27.4 36.6
4 Nozzle-to-Plate distance mm N 20 25
3.2Development of Design Matrix
The design matrix as shown in table 2 was developed according to the half factorial design approach to which the number of experiment combination becomes 2k-1 (24-1=8). The first three column were generated by standard 23 two level full factorial and the fourth column was generated by the relation N=I×V×S.
Table 2: Design Matrix show in coded values
S.No. I V S N = I×V×´S
1 1 1 1 1
2 -1 1 1 -1
3 1 -1 1 -1
4 -1 -1 1 1
Copyright to IJIRSET www.ijirset.com 2013
6 -1 1 -1 1
7 1 -1 -1 1
8 -1 -1 -1 -1
3.3Conducting Experiment as per Design Matrix
The experiments were conducted on automatic submerged arc welding machine at MMEC Mullana. A constant potential transformer rectifier type power source with a current capacity of 800 amperes at 60% duty cycle and an open circuit voltage of 20-50 volt was used. The experiments were performed on carbon steel plate of size 150mm×75mm×12mm by 3.2mm diameter copper coated wire in spool form with agglomerated flux. The experiment is performed in a random manner to avoid any systematic error. The complete sets of eight trials were repeated for the sake of determining the variance of parameters and variance of adequacy for the model with help of design expert software. The weld samples of 20mm length were removed from the middle of the weld plate and polished by series of finer grades of emery paper (grades 80, 100, 200, 300, 400, 600, 800, 1000). The properly polished specimens have been etched with 2% Nital solution, which has been followed by investigation and analysis. The chemical composition of base plate is shown in table-3.
Table3: Chemical Composition of Base Plate
Composition C Si Mn P S Al Cr Cu Ni Mo Nb Ti V
Percentage 0.2 0.4 1 0.03 0.03 0.02 0.3 0.3 0.3 0.8 0.01 0.03 0.02
Figure 2: Bead Geometry
3.4 Recording of Responses
One transverse specimen of 20mm width is cut from mid position of the each plate. Thesespecimens were polished and etched with 2% Nital. The dimensions of weld bead geometry like penetration and reinforcement were measured with metallurgical microscope. The responses recorded are shown in table 4.
Table 4:Observed values of Bead Penetration and Reinforcement
S.NO. I V S N Penetration Reinforcement
1 2 1 2
1 450 32 36.6 25 3 3.2 2.05 2.1
2 250 32 36.6 20 1.41 1.5 1.4 1.2
3 450 30 36.6 20 3.32 3.39 2.5 2.9
Copyright to IJIRSET www.ijirset.com 2014
5 450 32 27.4 20 3.77 3.55 2.7 2.52
6 250 32 27.4 25 1.46 1.58 1.72 1.74
7 450 30 27.4 25 3.61 3.88 3.2 2.9
8 250 30 27.4 20 1.52 1.72 1.54 1.62
3.5 Selection of Mathematical Model
The response function representing any of the weld bead dimensions could be expressed as:
Y=f (I, V, S, N) where Y is the response function like bead penetration and reinforcement. I, V, S and N are welding current, arc voltage, travel speed and nozzle to plate distance respectively. Assuming a linear relationship in the first instant and taking into account possible two factors interactions only, the above expression could be written as:
Y=b0+b1I+b2V+b3S+b4N+b5IV+b6IS+b7IN……….. (1)
3.6Checking the Significance of the Model
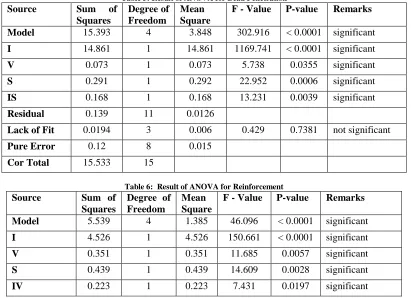
ANOVA is a statistical technique, which can infer some important conclusions based on analysis based on analysis of the experimental data. The method is very useful to investigate the level of significance of influence of factors or interactions of factors on a particular response. The analysis of variance (ANOVA) test was performed to evaluate the statistical significance of the fitted linear models and factors involved in the response factors bead penetration and reinforcement. The goodness of fit of the fitted linear model was evaluated through lack of fit test. The results obtained are shown in tables 5-7. Both the fitted models are found to be significant. since for both the responses, the probability of F (PROB. ˃F) are observed to be less than 0.0001 i.e. there is only a 0.01% chance that "Model F-Value" larger could occurs due to noise. Values of "Prob > F" less than 0.0500 indicate model terms are significant. Values greater than 0.1000 indicate the model terms are not significant.In penetration model I, V, S and IS are significant model terms and in case of reinforcement I, V, S, IV are significant model terms.For both the models lack of fit is not significant relative to the pure error.There are 73.81% and 14.85% chance respectively for penetration and reinforcement that a “ LACK OF FIT F-VALUE” larger could occur due to noise. Non significant lack of fit is good.
Table 5: Result of ANOVA for Bead Penetration
Source Sum of
Squares
Degree of Freedom
Mean Square
F - Value P-value Remarks
Model 15.393 4 3.848 302.916 < 0.0001 significant
I 14.861 1 14.861 1169.741 < 0.0001 significant
V 0.073 1 0.073 5.738 0.0355 significant
S 0.291 1 0.292 22.952 0.0006 significant
IS 0.168 1 0.168 13.231 0.0039 significant
Residual 0.139 11 0.0126
Lack of Fit 0.0194 3 0.006 0.429 0.7381 not significant
Pure Error 0.12 8 0.015
Cor Total 15.533 15
Table 6: Result of ANOVA for Reinforcement Source Sum of
Squares
Degree of Freedom
Mean Square
F - Value P-value Remarks
Model 5.539 4 1.385 46.096 < 0.0001 significant
I 4.526 1 4.526 150.661 < 0.0001 significant
V 0.351 1 0.351 11.685 0.0057 significant
S 0.439 1 0.439 14.609 0.0028 significant
Copyright to IJIRSET www.ijirset.com 2015
Residual 0.33 11 0.03
Lack of Fit 0.155 3 0.051 2.35 0.1485 not significant
Pure Error 0.176 8 0.022
Cor Total 5.869 15
Table7: Model summary statistics for responses Parameters Std.
Dev.
Mean C.V. % Press R-Squared
Adj R-Squared
Pred. R-Square
Adeq. Precision
Penetration 0.113 2.501 4.506 0.296 0.991 0.988 0.981 37.018
Reinforcement 0.173 2.077 8.346 0.699 0.944 0.923 0.881 17.455
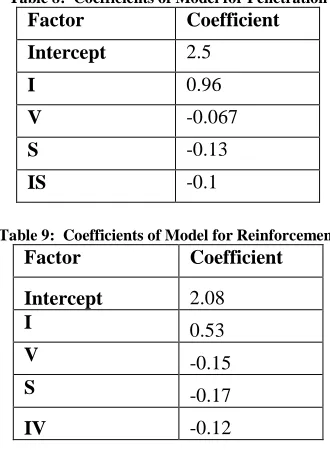
3.7Evaluation of the Coefficients of the Models
The values of the coefficients of the models were calculated by design expert software package.All the coefficients were tested for their significance at 95% confidance level applying student’s t- test.Coefficients are shown in table 8-9.
Table 8: Coefficients of Model for Penetration Factor Coefficient
Intercept 2.5
I 0.96
V -0.067
S -0.13
IS -0.1
Table 9: Coefficients of Model for Reinforcement Factor Coefficient
Intercept 2.08
I 0.53
V -0.15
S -0.17
IV -0.12
3.8 Development of Mathematical Model
The final mathematical models for the responses are presented in table 10. Table 10:Developed Mathematical Models S.NO. Response Developed model
Copyright to IJIRSET www.ijirset.com 2016 IV.ANALYSIS OF RESULT AND DISCUSSIONS
The pridicted effects of the welding parameters on the weld bead width and hardness within the range of the parameters are repersented in fig.4-17.
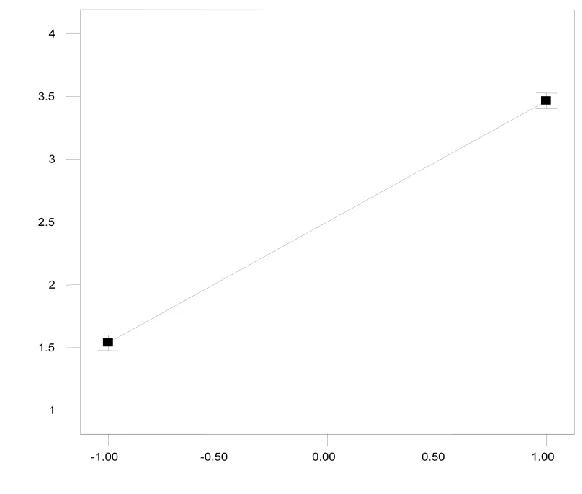
4.1 Main Effect of Process Parameters on Bead Penetration
Main effect of parameters on penetration are repersented in fig.3-5. Penetration increaseswith the incease in welding current while decreases with the welding speed and arc voltage.Nozzle to plate distance has no significant effect on penetration.
Copyright to IJIRSET www.ijirset.com 2017
Figure 4: Effect of Arc voltage on Penetration
Copyright to IJIRSET www.ijirset.com 2018
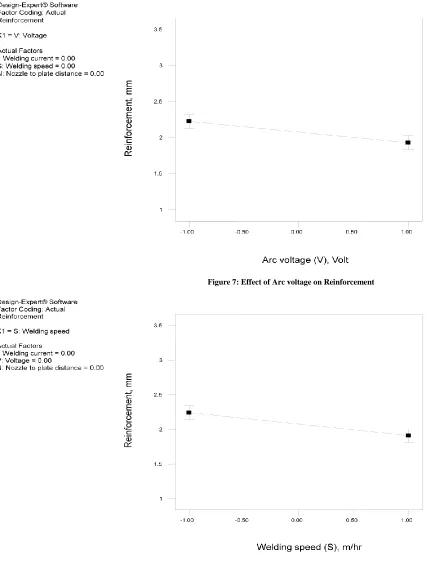
4.2Main Effect of Process Parameters on Reinforcement
Main effect of process parameters on reinforcement are repersented in fig.6-8. Reinforcement increases with the incease in welding current while decreases with the increase in arc voltage and welding speed. Nozzle to plate distance has no significant effect on reinforcement.
Copyright to IJIRSET www.ijirset.com 2019
Figure 7: Effect of Arc voltage on Reinforcement
Figure 8: Effect of Welding Speed on Reinforcement
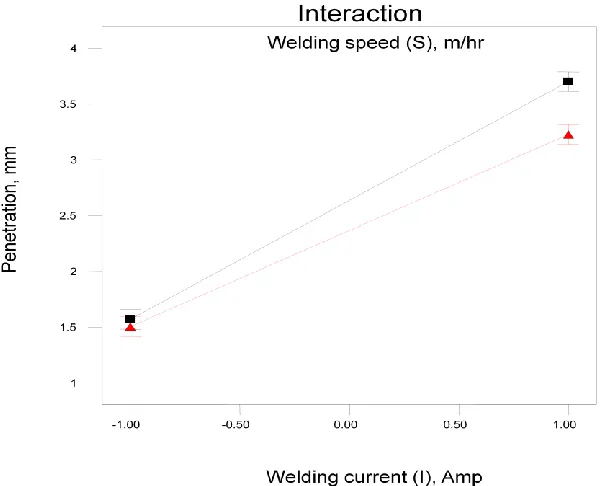
4.3Interaction Effect of Welding Current and Welding Speed onPenetration
Copyright to IJIRSET www.ijirset.com 2020
higher at low value of welding speed. So welding current has positive effect and welding speed has negative effect on penetration. Response surface due to interaction effect of welding current and welding speed on penetration is shown in figure -10.
Figure 9: Interaction effect of Welding Current and Welding speed on Penetration
Figure 10: Interaction effect of Welding Current and Welding speed on Penetration (Response sur
Copyright to IJIRSET www.ijirset.com 2021
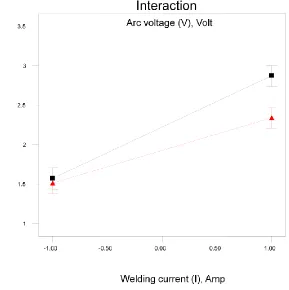
Interactive effect of welding current and arc voltage on reinforcement are shown in fig- 11. It is observed from the figure that reinforcement increases with the increase of current for all values of arc voltage within the range but the rate of increase of reinforcement with the increase of current is higher at low value of voltage. So voltage has negative effect on reinforcement and welding current has positive effect. Response surface due to interactive effect is shown in fig.-12.
Copyright to IJIRSET www.ijirset.com 2022
Figure 12: Interaction effect of Welding Current and Arc voltage on Reinforcement (Response Surface)
V. CONCLUSIONS The following conclusions were drawn from the above investigation:
1. The two level half factorial techniques with design expert software can be employed easily for developing mathematical models for predicting weld bead penetration and reinforcement within the workable range of process parameters for SAW of carbon steel.
2. Design expert software is found to be effective tool for quantifying the main and interaction effect of variable on weld bead penetration and reinforcement.
3. Welding current has positive effect, but arc voltage and welding speed have negative effect on bead penetration and reinforcement.
4. Nozzle to plate distance has no significant effect on bead penetration and reinforcement.
REFERENCES
1. S.V.Nandkarni, Modern Arc Welding Technology,(Oxford & IBH Publishing Co. Pvt. Ltd, New Delhi), 1998. 2. http://www.google.co.in
3. Gupta and parmar,“Fractional factorial technique to predict dimension of the weld bead in automatic submerged arc welding.” J InstEngr (india), 70 (1986) 67-71.
4. Gupta, S.R. and Arora, N., “Influence of flux basicity on weld bead geometry and heat affected zone in submerged arc welding.”Indian Welding Journal. 24(7), 1991, pp. 127-133.
5. S. Kumanan, J.E. Dhas Raja & K. Gowthaman, “Determination of submerged arc welding process parameters using Taguchi method and regression analysis.”Indian Journal of Engineering & Materials Sciences, Vol. 14, 2007, pp. 177-183.
6. S.P. Tewari, Ankur Gupta, JyotiPrakash, “Effect of welding parameters on the weldability of material.”International Journal of Engineering Science and Technology, Vol. 2(4), 2010, 512-516.
7. VinodKumar, “Modeling of weld bead geometry and shape relationship in submerged arc welding using developed fluxes.”Jordan Journal of Mechanical and Industrial Engineering, Vol. 5, No. 5, 2011, 1995-6665.
8. Deepak Kumar Choudhary, “To study the effect of welding parameters on weld bead geometry in SAW welding process.” Elixir Mech. Engg. 40 (2011) 5519 – 5524
9. S. Alam, M.I. Khan, “Prediction of weld bead penetration for steel using submerged arc welding process parameters.”International Journal of Engineering Science and Technology (IJEST), ISSN: 0975-5462, Vol. 3 No. 1, pp 7408-7416, 2011.
10. RatiSaluja and K.M.Moeed, “Modeling and parametric optimization using Fractional design approach of submerged arc bead geometry for butt
Copyright to IJIRSET www.ijirset.com 2023 BIOGRAPHY
Vijay Kumar Panwar1is a pursuing M.tech.from Yamuna Institute of Engineering and Technology affiliated to Kurukshetra University, Haryana. Author has six years industrial experience in Manufacturing and one year teaching experience.
Deepak Kumar Choudhary2is an Assistant Professor in Yamuna Institute of Engineering and Technology affiliated to Kurukshetra University, Haryana .Author has six year teaching experience. He has been published various research papers on Welding and Metallurgy.
PHOTOGRAPH