Clinical Interventions in Aging
Dovepress
O r I g I n A l r e s e A r C h
open access to scientific and medical research
Open Access Full Text Article
Jennifer M stevenson1,2
Josceline l Williams1,2
Thomas g Burnham2
A Toby Prevost3
rebekah schiff4
s David erskine2
J graham Davies1
1Institute of Pharmaceutical sciences, King’s College london, london, UK; 2Pharmacy Department, st Thomas’ hospital, guy’s and st Thomas’ nhs Foundation Trust, london, UK; 3Department of Primary Care and Public health sciences, King’s College london, london, UK; 4Department of Ageing and health, guy’s and st Thomas’ nhs Foundation Trust, london, UK
Correspondence: J graham Davies Institute of Pharmaceutical sciences, King’s College london, 150 stamford street, london, se1 9nh, UK Tel +44 020 7484 4049 Fax +44 020 7484 4781 email [email protected] Jennifer M stevenson
Institute of Pharmaceutical sciences, King’s College london, 150 stamford street, london, se1 9nh, UK Tel +44 020 7484 4834 Fax +44 020 7484 4781
email [email protected]
Predicting adverse drug reactions in older adults;
a systematic review of the risk prediction models
Journal name: Clinical Interventions in Aging Journal Designation: Original Research Year: 2014
Volume: 9
Running head verso: Stevenson et al
Running head recto: ADR risk prediction in older adults DOI: http://dx.doi.org/10.2147/CIA.S65475
Abstract: Adverse drug reaction (ADR) risk-prediction models for use in older adults have been developed, but it is not clear if they are suitable for use in clinical practice. This systematic review aimed to identify and investigate the quality of validated ADR risk-prediction models for use in older adults. Standard computerized databases, the gray literature, bibliographies, and citations were searched (2012) to identify relevant peer-reviewed studies. Studies that developed and validated an ADR prediction model for use in patients over 65 years old, using a multivari-able approach in the design and analysis, were included. Data were extracted and their quality assessed by independent reviewers using a standard approach. Of the 13,423 titles identified, only 549 were associated with adverse outcomes of medicines use. Four met the inclusion cri-teria. All were conducted in inpatient cohorts in Western Europe. None of the models satisfied the four key stages in the creation of a quality risk prediction model; development and valida-tion were completed, but impact and implementavalida-tion were not assessed. Model performance was modest; area under the receiver operator curve ranged from 0.623 to 0.73. Study quality was difficult to assess due to poor reporting, but inappropriate methods were apparent. Further work needs to be conducted concerning the existing models to enable the development of a robust ADR risk-prediction model that is externally validated, with practical design and good performance. Only then can implementation and impact be assessed with the aim of generating a model of high enough quality to be considered for use in clinical care to prioritize older people at high risk of suffering an ADR.
Keyword: aged, stratified care, prognosis, medication-related harm
Introduction
Adverse drug reactions (ADRs) have long been recognized as a potential outcome of taking medicines, and while the severity of such reactions may vary, a significant
proportion of ADRs are responsible for hospital admissions.1 Investigators have strived
to identify the key factors that increase a person’s risk of suffering an ADR, especially in older adults, a group nearly seven-times more likely to be hospitalized due to an
ADR when compared to younger people.2
We know that the changes in drug pharmacokinetic and pharmacodynamic proper-ties that occur as a result of the aging process often lead to an increased susceptibility to
ADRs.3 Polypharmacy, a frequently reported risk factor for ADRs,4 is on the increase
as people live longer with multiple chronic conditions, so stratifying an older patient’s risk of suffering an ADR might be attractive.
Risk prediction is a routine component of everyday medicine in both specific areas (for example, approaches used to determine stroke risk in patients with atrial
fibrillation)5 as well as more generally, to identify patients at risk of hospital admission.6
ADR risk stratification in older adults could assist in case prioritization, supporting
Clinical Interventions in Aging downloaded from https://www.dovepress.com/ by 118.70.13.36 on 20-Aug-2020
For personal use only.
This article was published in the following Dove Press journal: Clinical Interventions in Aging
19 September 2014
Dovepress
stevenson et al
clinicians and patients to make informed decisions about treatments and for the delivery of a more efficient health care service.
Accurate risk prediction models are the result of four key stages: development, validation, impact, and
implementa-tion.7 It is recognized that often only the first two stages (ie,
development and validation) are completed, the methods and
outcomes of which are often poorly reported. 7 Furthermore,
to be of practical use, these models should use clearly defined easily obtainable data, have good predictive power, be tested in a large sample representative of the target population, and
have high reliability and face validity.7 A recent systematic
review emphasized that failure to consider risk prediction in
a clinical setting can result in poor care.8 With regard to the
prediction of medication risk in older adults, as no systematic review of this area has been undertaken, we aim to identify and assess the quality of validated ADR risk-prediction mod-els for use in adults over 65 years of age in order to determine their potential benefit to clinical practice.
Method
Information sources and search
A systematic search for published material was performed, up to November 30, 2012, using standard databases (Embase, Medline, Cochrane Library, BNI, CINAHL, NeLM, IPA) to identify relevant studies as well as those associated with policy documents and unpublished work (Department of Health, King’s Fund, Worldcat, Open Grey, Google Scholar). For the key studies, the bibliographies and citations were reviewed, and an author search was performed, to identify any additional studies.
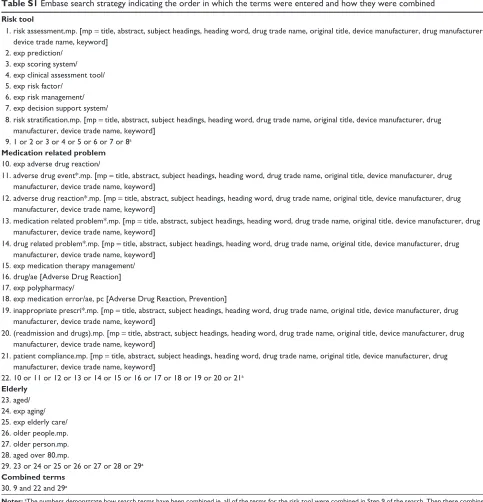
Our search strategies for each database included no restrictions and used standard terms based around three key concepts: older people; medication-related problems; and clinical prediction models. The full Embase search strategy is provided in Table S1.
Inclusion criteria and selection
Two researchers (JMS and SDE) independently screened titles, abstracts, and, where necessary, full texts in order to identify studies that potentially satisfied the following inclusion criteria:
• Majority of patients 65 years old
• Included patients who experienced an adverse drug event
(ADE) or ADR but excluded prescription errors
• A multivariable approach in design and analysis was
followed
• The model had been validated.
Data extraction
Data were extracted (by JMS) to provide details of the population characteristics, study design, process of model development and validation, and performance of the model, as presented in Tables 1 and 2. This was confirmed by sec-ondary reviewers (SDE and ATP) and, where disagreement occurred, this was resolved through discussion.
Quality assessment
All papers were initially reviewed (SDE and JMS) using a standard approach for developing and testing clinical predic-tion models to satisfy a range of criteria representing four stages: development (identification of candidate predictor variables and model design); validation (testing the perfor-mance of the model); impact (measurement of usefulness in the clinical setting); and implementation (widespread
acceptance and adoption in clinical practice).7
As no standardized quality assessment for risk-prediction models is available, each study was analyzed using criteria
derived from the published literature.8–11 Candidate
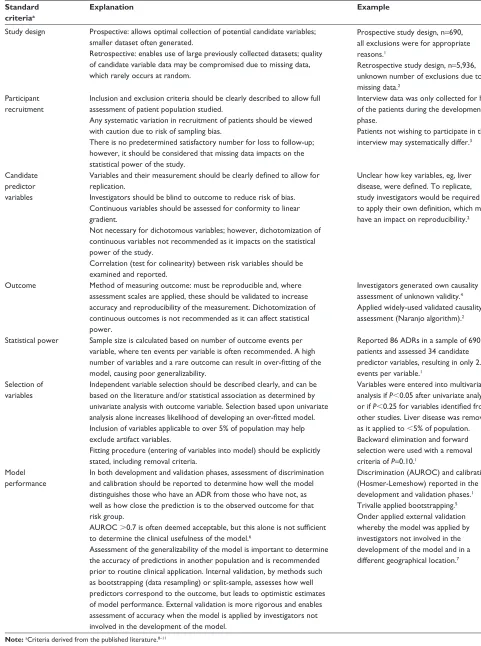
predic-tor variables were grouped into three categories to allow for comparison between studies: demographic factors; medical factors (eg, comorbidities); and medication factors (eg, class of medicine). Event rate was calculated as percentage ADR/ADE rate where it was not reported by the authors in this form. Qual-ity of design and reporting of the studies was compared based on ability to comply with the standard criteria (Table S2). The overall performance of the models was determined by review of their accuracy, discrimination, and calibration through internal or external validation, as described in detail in Table S2.
Results
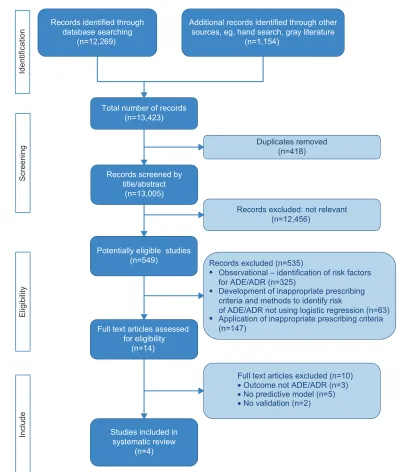
A total of 13,423 potentially relevant titles were identified from the literature, of which only 549 were associated with adverse outcomes of medicines use. The majority of these (535) were excluded on review of their abstract as they were not associated with the design of a risk prediction model; many of these were observational (see Figure 1). Full papers were requested for the remaining 14 articles for further scrutiny, and four met the
inclusion criteria and were subjected to a full evaluation.12–15
excluded papers
The 535 articles excluded could be categorized into obser-vational studies (325), those in which indicators to support quality prescribing were developed (63 studies; for example
Beers’ criteria16), and those applying the prescribing
indi-cators (147 studies) to determine any association between inappropriate medicines and adverse outcomes.
Clinical Interventions in Aging downloaded from https://www.dovepress.com/ by 118.70.13.36 on 20-Aug-2020
Dovepress ADr risk prediction in older adults
Table 1
s
ummary table of population characteristics of included studies
Author
Development
Validation
Population and setting
Number of patients (n ) an d co m m on comorbidities (%)
Number of drugs Primary outcome measure and rate Drugs most frequently associated with primary outcome (%) Most frequent body systems affected by ADRs (%)
Population and setting
Mc
elnay et al
12
Age: 65–98 years location: acute hospital (UK) Year:
nr
sex: F 49.5% ethnicity:
nr
n
=
929
Comorbidities not reported Mean: 4.3 (range: 1–15) (sD:
nr ) AD e – AD r and adherence 16% Digoxin AC e inhibitors Antidepressants Insulin nr n =
204 (number AD
r
s unknown)
Cohort similar to development cohort
Tangiisuran
13
Age: 85
±
7.9 years
location: acute hospital (UK) Year: 2007 and 2008 sex: F 61% ethnicity: white
n = 690 h T n (73)
Infection (44) Anemia (41) MsK (41) Mean: 7 (range: 5–10) (sD:
nr
)
AD
r
12.5%
Cardiovascular (34%) Analgesics (16%) Antidiabetics (13%) Antibiotics (13%)
g
I (21.1%)
CV (20%) neuropsychiatric (14.7%) endocrine (13.7%) Metabolic/renal (11.6%)
n
=
483 (56 suffered AD
r
)
n
umber of drugs 11.0
±
7.0
Cohort similar – drawn from four
european countries
(UK, Belgium, Italy, and the netherlands)
Onder et al
14
Age: 78
±
7.2 years
location: acute and community hospitals (Italy) Year: 1993–1997 sex:
nr ethnicity: nr n = 5936 h T n (24) 31 C h D (21) 31 Diabetes (16) 31 COPD (14) 31 CVD (13) 31
Mean: 6.3 (range:
nr ) (s D: 3.6) AD r 6.5% Antineoplastics (19.5%) 31 ns AIDs (5.2%) 31 Antipsychotics (4.4%) 31 Antibiotics (3.9%) 31 Corticosteroids (3.3%) 31 g I (18%)
CV (25.3%) neuropsychiatric (17.8%) Dermatologic (11.7%)
n
=
483 (56 suffered AD
r
)
n
umber of drugs 11.0
±
7.0
Cohort similar – drawn from four
european countries
(UK, Belgium, Italy, and the netherlands) Secondary study
21
n
=
513 (135 AD
r
s)
n
umber of drugs 7
(IQ
r
7–10)
Cohort similar to development cohort – drawn from
r
epublic
of Ireland
Trivalle et al
15
Age: 83.6
±
7.9 years
location: 16 rehabilitation hospitals (France) Year:
nr
sex: F 72% ethnicity:
nr
n
=
576
CV (72) MsK (48) gI (36) gU (29) neuro (26) Mean: 9.4 (range:
nr ) (s D: 4.24) AD e
39% (not all were included in the study) Psychotropics (23%) Antihypertensives (17%) Anticoagulants (14%) Analgesics (13%)
g
I (25%)
Biological abnormalities (22%) Other (20%) neuropsychiatric (12%) Bootstrapping n=nr Validation cohort similar to developmental cohort
Abbreviations: AC e, angiotensin converting enzyme; AD e, adverse drug event; AD r , ad verse drug reaction; C h D, coronary heart disease; COPD, chronic obstructive pulmonary disease; CV, cardiovascular; CVD, cerebrovascular disease; F, female; GI, gastrointestinal; GU, genitourinary; HTN, hypertension; IQR, interquartile range; MSK, musculoskeletal; Neuro, neurological comorbidity; NR, not recorde d; NSAIDs, non-steroidal anti-inflammatory drug; SD, standard deviation.
Clinical Interventions in Aging downloaded from https://www.dovepress.com/ by 118.70.13.36 on 20-Aug-2020
Dovepress
stevenson et al
Table 2
s
ummary of quality assessment of included studies
Standard criteria
McElnay et al
12
Tangiisuran
13
Onder et al
14
Trivalle et al
15
study design
Prospective cohort (development and validation) Prospective cohort (development and validation)
r
etrospective cohort (development) Prospective (validation) Prospective cohort (development) retrospective cohort (validation)
Participant recruitment
Clear inclusion criteria
Yes Development – n
onelective admissions
– Medical, surgical, cardiac and geriatric, wards in a single hospital –
65 years old
– Taking medicines Validation as above Yes Development – Admitted to one of four care of the elderly wards in a teaching hospital –
80 years old
Validation – Admitted to one of four european hospitals –
65 years old
– Taking medicines
Yes Development – selected community- and university-based hospital admissions –
65 years old
– Taking medicines Validation as above except admitted to one of four european hospitals Yes Development – Consecutive admissions to 16 geriatric rehabilitation centers Validation as above
evidence that patient selection was not biased Unsure Data only collected from 50% of development-phase and 42% of validation-phase patients recruited who underwent interview Yes All patient exclusions were for appropriately assessed reasons Unsure An unknown number of patients were excluded due to incomplete data 61 cancer patients excluded Unsure Data from 71 patients were excluded (these patients were either part of an intervention arm or not present for the whole 4 weeks of the study)
Acceptably low rates of loss to follow-up Yes Data from all patients who underwent interview were used in development and validation of model Yes no patients lost to follow-up Yes no patients lost to follow-up Yes no patients lost to follow-up
Candidate predictor variables
a
Clear methods used to measure predictors Partly 2/7 identified variables were not easily quantifiable (ie, “
g
I problems” and “patient
thinks drugs are responsible for hospital admission”) Mostly Data on 17 potential variables assessed not clear how comorbidity, liver disease, previous history of AD
r
,
or known allergy to medication were defined Partly A trained physician completed a questionnaire for each patient, but unclear how key variables (comorbid conditions, liver disease, previous ADR) were defined or consistently applied between assessors Partly Where
candidate
predictors
were
reported, they could be clearly described Potential candidate predictors that were not included in the model are unknown
Blinding to outcome
Yes Data collected prospectively Yes Data collected prospectively Partly Blinding is not reported for the development phase Physicians collecting data for the validation phase were blinded Yes Data collected prospectively
Conformity with linear gradient
n
ot reported
n
ot reported
n
ot reported
Yes linearity was checked where possible
Clinical Interventions in Aging downloaded from https://www.dovepress.com/ by 118.70.13.36 on 20-Aug-2020
Dovepress ADr risk prediction in older adults
Test for colinearity
Partly Outlined in method but not mentioned in results Partly Outlined in method but not mentioned in results
n
ot reported
Yes high-correlation risk factors were identified and examined in separate models
Outcome
b
Appropriate methods used to measure outcomes
Partly Data sourced from patient records and interviews ADE as defined by: – ADR (measured using modified naranjo scale) – Adherence (self-reported) Partly Medical information and health care staff reviewed daily using standardized checklist suspected AD
r
s assessed for
causality, preventability, and severity using
n
aranjo algorithm,
Hallas criteria, and a confidence in causality
likert scale
Partly Wards visited daily, and nursing and medical records examined daily Causality was assessed based on
n
aranjo algorithm
Partly A combination of approaches used to id
en tif y A D es : a s el f-g en er at ed
standardized 32-item checklist was
c om pl et ed b y nu rs in g st af f. In ci de nt r ep or tin g an d w ee kl y
chart review were also conducted. Four
c rit er ia w er e us ed to a ss ig n
likelihood of causality
statistical power Sufficient events per variable (ie,
10)
n
o
Unable to determine exact number, but
10 n o 86 AD r
s/34 candidate predictor
variables
=
2.5
Yes Unable to determine exact number but
10
n
ot possible to determine
selection of predictor variables Method of selection reported for independent variables Partly screened in univariate analysis and entered into model if
P
0.25
Applicable to
5% of population
Yes screened in univariate analysis and entered into model if
P
0.05
Variables identified from other studies entered into model if P
0.25
Applicable to
5% of population
Yes screened in univariate analysis and entered into model if
P
0.10
Yes screened in univariate analysis and entered into model if
P
0.05
Applicable to
5% of population
Fitting procedure reported
Yes stepwise backward-elimination procedures (using maximum likelihood method) Preliminary removal of variables at P
=
0.15 then
P
=
0.05
Yes Multivariate logistic regression using backward-elimination procedure and forward selection removal criteria
P
=
0.10
Partly stepwise logistic regression Added and retained variables if
P
0.1
Methods of variable elimination and retention were unclear Partly stepwise logistic regression retained variables if
P
0.05
Methods of variable elimination and retention were unclear
Model performance Development phase reported
n o Yes Discrimination as AU r OC reported
with CI Calibration as
h osmer-lemeshow and n agelkerke R 2
Sensitivity and specificity reported
Partly Discrimination as AU
r
OC
reported with CI Sensitivity and specificity reported
n
o
Validation phase reported Partly Only overall accuracy, sensitivity, and specificity reported Yes Discrimination as AU r OC reported
with CI Sensitivity and specificity reported Partly Discrimination as AU
r
OC
reported with CI
Partly Discrimination as AU
r
OC
reported with CI
Notes:
aInteractions and coding were not dealt with in any of the studies. bAll studies collapsed continuous categorical data into binary outcomes.
Abbreviations:
ADE, adverse drug event; ADR, adverse drug reaction; AUROC, area under the receiver operator curve; CI, confidence interval; GI, gastrointestinal.
Clinical Interventions in Aging downloaded from https://www.dovepress.com/ by 118.70.13.36 on 20-Aug-2020
Dovepress
stevenson et al
Identification
Total number of records (n=13,423)
Records screened by title/abstract
(n=13,005)
Full text articles assessed for eligibility
(n=14)
Studies included in systematic review
(n=4)
Records excluded: not relevant (n=12,456)
Full text articles excluded (n=10)
• No validation (n=2)
Screening
Eligibilit
y
Includ
e
Potentially eligible studies (n=549)
•
•
•
Records excluded (n=535)
Observational – identification of risk factors for ADE/ADR (n=325)
Development of inappropriate prescribing criteria and methods to identify risk
of ADE/ADR not using logistic regression (n=63) Application of inappropriate prescribing criteria (n=147)
Duplicates removed (n=418) Records identified through
database searching (n=12,269)
Additional records identified through other sources, eg, hand search, gray literature
(n=1,154)
• No predictive model (n=5)
• Outcome not ADE/ADR (n=3)
Figure 1 PrIsMA32 flow diagram.
Abbreviations: ADe, adverse drug event; ADr, adverse drug reaction.
Included papers
Population characteristicsAll included studies were conducted in Western Europe, and only in the hospital setting (acute, community, and
rehabilita-tion hospitals) (Table 1).12–15 Two studies represented the very
elderly (aged over 80 years).13,15 Patient functionality was
reported by Onder et al14 Tangiisuran,13 and McElnay et al12
and was measured using patient-perceived health status, Katz Index, and Barthel Index.
The primary outcome in all of the studies was ADR,17
with one study using ADE synonymously15 and another12
including ineffective treatment in an extended definition. The proportion of patients who experienced an ADR/ADE ranged from 6.5% to 39%, with gastrointestinal, cardiovascular, and nervous systems being those most frequently affected. Medications most frequently associated with ADRs/ADEs included psychotropics, anticoagulants, and analgesics.
Quality assessment – overview
Whilst all models included the development and validation phases, none addressed the impact and implementation phases.
Clinical Interventions in Aging downloaded from https://www.dovepress.com/ by 118.70.13.36 on 20-Aug-2020
Dovepress ADr risk prediction in older adults
Model development
study design
During the development phase, all except Onder et al14 used a
prospective case-cohort design method, where events accrued over the study period. Onder et al extracted 3 years of data from a historical database, whereas data were extracted over 1–6 months in the other studies. Patient medical notes, in-patient charts, and electronic records were reviewed in
the prospective studies.12,13,15 In addition, McElnay12 asked
a sample of the patients about aspects of their medicines,
while Trivalle et al15 used patient self-reporting as a trigger
for further analysis. The validation phase was conducted prospectively for all studies except for that of Trivalle et al where bootstrapping was used.
Participant recruitment
The criteria for inclusion and exclusion as well as any loss to follow-up were clearly described in all studies, although reporting of patient selection was poor (Table 2). An unknown number of patients were excluded by Onder et al
due to incomplete data.14
Candidate predictors
The handling of candidate predictor variables was gener-ally poor. In all studies, the description of the variables was
inadequate; where Trivalle et al15 did not report the potential
candidate variables, McElnay et al12 Tangiisuran13 and Onder
et al14 used variables with unclear definitions, eg, “previous
ADR”. Despite being labeled as a “bad idea”,18
dichoto-mization of continuous candidate predictor variables (eg, four or more comorbidities, more than eight medications, previous ADR) was common practice, and may explain the failure to consider conformity to the linear gradient in all12–14 but the Trivalle et al study.15 Interactions were poorly
addressed, as was the coding of variables. Insufficient detail in the results made it difficult to establish whether tests that were mentioned in the methods had been implemented;
eg, McElnay et al12 reported testing for interactions and
colinearity, but this was not followed through to the results. Predictor-variable measurement was blinded for outcome in
the development phase in three of the four studies.12,13,15
Outcome
The occurrence of an ADE/ADR was the primary outcome measure for all studies. A validated assessment of causality,
in the form of the Naranjo algorithm19 or Hallas criteria,20
was adopted by all but Trivalle et al who used their own
checklist.15 The outcome was recorded in the form of
continuous categorical data (ie, unlikely, possible, prob-able, definite) then collapsed to produce a binary outcome. Possible, probable, and definite were combined as a positive
outcome.Blinding to the outcome occurred in all four studies
during the validation phase.
statistical power
The poor description of potential candidate predictor vari-ables made it impossible to determine if the studies were adequately powered (Table 2).
selection of predictor variables
The method of selection of predictor variables for inclusion within the multivariable analysis was described in all of the
studies (Table 2). Tangiisuran13 provided the most detailed
description, whilst Trivalle et al15 provided the least detailed
description. Mixed methods (using the literature, expert
opinion, and univariate analysis) were used by Tangiisuran.13
Onder et al appeared to have used univariate analysis alone.14
There was variation in the significance levels used to retain
a predictor variable.12–15
Model performance and validation
The area under the receiver operator curve was used to assess discrimination in three of the four studies, and was 0.70–0.74
for the development phase.13–15 Sensitivity and specificity were
reported by Tangiisuran,13 Onder et al14 and McElnay et al.12
Calibration was only reported by Tangiisuran,13 for which
Hos-mer-Lemeshow was satisfactory but Nagelkerke21 was low.
All models underwent the subsequent stage of validation using a second dataset. Internal validation was reported by
McElnay et al12 and Trivalle15 in the form of split sample
and bootstrapping, retrospectively. External validation was
performed by Onder et al14 and Tangiisuran13 in the same
European cohort. Another research group (O’Connor et al22)
subsequently applied the model developed by Onder et al14
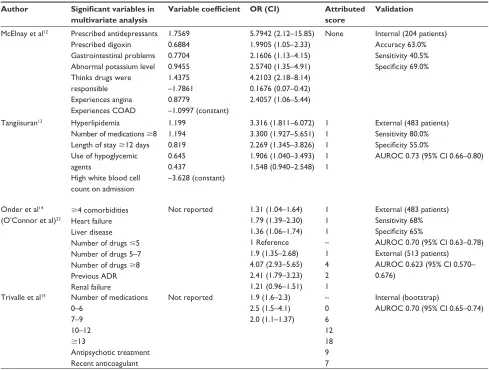
providing additional external validation (Table 1). Area under the receiver operator curve in the validation phase ranged from 0.623 to 0.73 (Table 3). The number of patients involved
in the external validation ranged from 204 to 483.12–15,22 Only
the study by O’Connor et al22 met the recommended
mini-mum number of events (100 events and nonevents).
score development
Predictor variables within the final models (Table 3) were attributed a points-based score, which was simplified for
practical application.13–15 McElnay et al did not proceed
to this stage due to the poor performance of their model.12
Clinical Interventions in Aging downloaded from https://www.dovepress.com/ by 118.70.13.36 on 20-Aug-2020
Dovepress
stevenson et al
Table 3 Summary of final ADR risk-prediction models
Author Significant variables in
multivariate analysis
Variable coefficient OR (CI) Attributed
score
Validation
Mcelnay et al12 Prescribed antidepressants Prescribed digoxin gastrointestinal problems Abnormal potassium level Thinks drugs were responsible experiences angina experiences COAD
1.7569 0.6884 0.7704 0.9455 1.4375 –1.7861 0.8779
–1.0997 (constant)
5.7942 (2.12–15.85) 1.9905 (1.05–2.33) 2.1606 (1.13–4.15) 2.5740 (1.35–4.91) 4.2103 (2.18–8.14) 0.1676 (0.07–0.42) 2.4057 (1.06–5.44)
none Internal (204 patients) Accuracy 63.0% sensitivity 40.5% Specificity 69.0%
Tangiisuran13 hyperlipidemia
number of medications 8 length of stay 12 days Use of hypoglycemic agents
high white blood cell count on admission
1.199 1.194 0.819 0.645 0.437
–3.628 (constant)
3.316 (1.811–6.072) 3.300 (1.927–5.651) 2.269 (1.345–3.826) 1.906 (1.040–3.493) 1.548 (0.940–2.548)
1 1 1 1 1
external (483 patients) sensitivity 80.0% Specificity 55.0%
AUrOC 0.73 (95% CI 0.66–0.80)
Onder et al14 (O’Connor et al)22
4 comorbidities heart failure liver disease number of drugs 5 number of drugs 5–7 number of drugs 8 Previous ADr renal failure
not reported 1.31 (1.04–1.64) 1.79 (1.39–2.30) 1.36 (1.06–1.74) 1 reference 1.9 (1.35–2.68) 4.07 (2.93–5.65) 2.41 (1.79–3.23) 1.21 (0.96–1.51)
1 1 1 – 1 4 2 1
external (483 patients) sensitivity 68% Specificity 65%
AUrOC 0.70 (95% CI 0.63–0.78) external (513 patients)
AUrOC 0.623 (95% CI 0.570– 0.676)
Trivalle et al15 number of medications 0–6
7–9 10–12
13
Antipsychotic treatment recent anticoagulant
not reported 1.9 (1.6–2.3) 2.5 (1.5–4.1) 2.0 (1.1–1.37)
– 0 6 12 18 9 7
Internal (bootstrap)
AUrOC 0.70 (95% CI 0.65–0.74)
Abbreviations: ADR, adverse drug reaction; AUROC, area under the receiver operator curve; CI, confidence interval; COAD, chronic obstructive airways disease; OR, odds ratio.
The score developed by Onder et al14 was on a points-based
system derived from the odds ratio. There was no assess-ment to determine if any of the predictive ability was lost in
this simplification. Tangiisuran13 assigned one point to each
predictor variable based on the “variable coefficient being
of the same magnitude”. It is unclear how Trivalle et al15
assigned the values to each predictor variable.
Impact and implementation
The impact and implementation of these models have not been published, perhaps reflecting their poor to modest per-formance. McElnay et al recognized the limitation of their
level of performance,12 and both Tangiisuran and Onder
et al called for further external validation of their models.13,14
However, Trivalle et al15 concluded that their model could
be applied in clinical practice alongside other tools, eg, Mini Mental State Exam. It is also worth considering some of the
difficulties highlighted by O’Connor et al22 in the application
of Onder et al’s14 model that are due to unclear definition
of predictor variables.14,22 Similar challenges are likely to
arise when applying results from Tangiisuran, Trivalle et al and McElnay et al given the poorly defined predictor
variables.12,13,15 The use of variables such as length of stay
would also make prospective risk stratification impossible.
Discussion
Our review suggests that the four models identified, which were designed to predict the risk of older patients suffering an ADR, are not yet suitable for use in clinical practice. While only two (Tangiisuran and Onder et al) were exter-nally validated, their ability to discriminate between those who had experienced an ADR and those who had not was
only modest.13,14 This could result in a failure to identify
patients at high risk of experiencing an ADR. Furthermore, none were subjected to the investigational rigor required when producing a risk-prediction model; in particular, none reported the findings of impact and implementation stages, thus widening the gap between research potential and clinical
Clinical Interventions in Aging downloaded from https://www.dovepress.com/ by 118.70.13.36 on 20-Aug-2020
Dovepress ADr risk prediction in older adults
application. Pressures within health care systems are driving a need for robust clinical risk-prediction models to inform care provision, but, to be useful, these models must be of high statistical quality and be clinically relevant.
All four studies had limitations commonly reported in the
prognostic research literature.7 Three failed to provide
suf-ficient information relating to events-per-variable ratio12,14,15
and one was insufficiently powered (Tangiisuran),13 so the
risk of a type II error (false negative finding) was more
likely.23 All studies dichotomized their predictor variables
(eg, when categorizing the number of medicines) and out-comes (eg, collapsing a continuous ADR causality scale),
despite this practice being suboptimal.18,23 The use of
unrep-resentative samples and the management of missing data were also problematic, regardless of whether a retrospective or prospective design was used. In addition, there was often a lack of reporting of candidate predictor variables, which
could hinder replication by others.24
So, if the current risk prediction models have shortcom-ings, what can we do to limit older adults experiencing ADEs? Although research investigating medication risk in older adults is widespread, the 535 titles identified in our initial search were often associated with other, mainly system-based, approaches to managing risk, and a substan-tial proportion were observational in nature. This body of evidence documents the complexity of medication risk in older adults and highlights the multidimensional nature of this field, which includes: clinical aspects, such as the changes in drug handling demonstrated in older age; social risk factors, especially during the transfer of care between different settings; and high-risk medicines, where the risk of medicines are considered but not always balanced against the potential benefits. Furthermore, the difficulty in determining whether a patient has experienced an ADR is challenging given the progressive nature of aging, where functional decline and loss of independence are common. Unfortunately, as older adults are often excluded from clinical trials, this limits our understanding of medicine risk in this population, and can result in inappropriate extrapolation of clinical guidelines, often based on research in younger patients.
So, is there a place for risk models in this care setting? A more common strategy is to adopt a systems approach to medicines use where pharmacological appropriate-ness is monitored, usually by applying a list of prescribing
indicators: for example, Beer’s criteria.16 The recognized
limitations of such an approach are that it is time-consuming if used in routine care and can be viewed as one-dimensional. This focus on specific medicines often restricts, due to
formulary and licensing issues, value in an international context. Perhaps the way forward is a hybrid whereby risk models bring a multidimensional perspective to guide clinical intervention, delivered as part of an integrated system built around the principles of medication safety. If models can map this complex interplay between clinical, social, and medication-related variables to stratify an individual’s risk of a future ADE, they may become a useful decision support tool for clinicians and patients to be used alongside systems-based approaches. This approach could help prioritize interventions for those patients at highest risk. Ultimately, the variables associated with medication risk, eg, polypharmacy and renal impairment, are inherent in clinical decisions and form part of a clinician’s intuitive risk assessment when prescribing medi-cines. Furthermore, clinicians often modify decisions based on individual variability, whereas a statistical model may not be able to accommodate the clinical nuances and overcome
the gerontological phenomenon of age heterogeneity.25 While
risk prediction models are not intended to replace clinicians’ decisions, they should not stratify patients less accurately than clinicians. It would be helpful if future work could compare a clinician’s risk stratification against that of an ADR risk-prediction model. This work would help inform the clinical relevance of the model and contribute to the impact and imple-mentation research that is thus far lacking. In the meantime, useful strategies that clinicians may adopt to prevent ADRs occurring are: ensuring that reliable medicines reconciliation is undertaken; avoiding the prescribing cascade (where a drug is prescribed to manage the problem caused by another); and the routine optimization of drug use in line with renal and liver function.
While conducting this systematic review, we could not assess for publication bias using conventional methods such
as funnel plots due to the small number of studies available.26
Publication bias in favor of positive results has been raised as a significant problem in the area of cancer risk-prediction research, and it is likely to be present in this area in which
negative results remain unpublished.27 The proposal to
develop reporting guidelines that stipulate registration of all risk-prediction research should go some way in reducing
future reporting bias.28 These guidelines could also be applied
to protocols and manuscripts when designing or publishing risk-prediction research, and may be a more suitable tool
for quality assessment in the future.29 In the absence of a
consensus guideline, we used an amalgamation of standards for reporting risk-prediction research to carry out this review. This approach should reduce the likelihood of any important quality measures being excluded. In the future, recommenda-tions developed by the Cochrane Prognosis Methods Group
Clinical Interventions in Aging downloaded from https://www.dovepress.com/ by 118.70.13.36 on 20-Aug-2020
Dovepress
stevenson et al
and the Prognosis Research Strategy Partnership should assist investigators in combating the challenges present when
conducting risk-prediction research.23,28,29
Conclusion
Risk stratification is attractive, especially in older patients where the population is growing and placing an increased demand on the health care service, a service that is woefully underprepared for the projected global growth to over
2 billion people over the age of 60 years by 2050.30 We
identi-fied four ADR risk-prediction models with poor to modest performance and raised questions about their overall quality, a finding not uncommon in the area of risk-prediction research. If these models are to be embraced as part of routine clinical care, further work needs to be conducted so that exter-nal validity can be assured and a practical approach upheld. Only then can implementation and impact be assessed with the view to adoption as part of a systems approach within routine clinical care.
Disclosure
The authors report no conflicts of interest in this work.
References
1. Pirmohammed M, James S, Meakin S, et al. Adverse drug reactions as a cause of admission to hospital: prospective analysis of 18,820 patients.
BMJ. 2004;329:15–19.
2. Budnitz DS, Pollock DA, Weidenbach KN, et al. National surveillance of emergency department visits for outpatient adverse drug events.
JAMA. 2006;296:1858–1866.
3. Mangoni AA, Jackson SH. Age-related changes in pharmacokinetics and pharmacodynamics: basic principles and practical applications. Br J Clin Pharmacol. 2004;57:6–14.
4. Davies EC, Green CF, Taylor S, Williamson PR, Mottram DR, Pirmohamed M. Adverse drug reactions in hospital in-patients: a pro-spective analysis of 3695 patient episodes. PLoS One. 2009;4:e4439. 5. Camm AJ, Lip GY, De Caterina R, et al. 2012 focused update of the
ESC Guidelines for the management of atrial fibrillation. Developed with the special contribution of the European Heart Rhythm Associa-tion. Eur Heart J.2012;33:2719–2747.
6. The John Hopkins ACG® System: International Experience [webpage
on the Internet]. Baltimore: Johns Hopkins University; 2013. Available from: http://acg.jhsph.org/index.php?option=com_content&view=artic le&id=73&Itemid=138. Accessed April 15, 2013.
7. Toll DB, Janssen KJM, Vergouwe Y, Moons KG. Validation, updat-ing and impact of clinical prediction rules: a review. J Clin Epidemiol. 2008;61:1085–1094.
8. Yourman LC, Lee SJ, Schonberg MA, Widera EW, Smith AK. Prognostic indicies for older adults. A systematic review. JAMA. 2012;307:182–192.
9. Bagley SC, White H, Golomb BA. Logistic regression in the medical literature: standards for use and reporting, with particular attention to one medical domain. J Clin Epidemiol. 2001;54:979–985.
10. Critical Appraisal Skills Programme for Clinical Prediction Rules [homepage on the Internet]. Available from: http://www.casp-uk.net. Accessed November 9, 2011.
11. Steyerberg EW. Clinical Prediction Models: a practical approach to development, validation and updating.New York: Springer; 2010. 12. McElnay JC, McCallion CR, Al-Deagi F, Scott MG. Development of
a risk model for adverse drug events in the elderly. Clin Drug Invest. 1997;13:47–55.
13. Tangiisuran B. Predicting adverse drug reactions in the hospitalised elderly [PhD Thesis]. Brighton: University of Sussex; 2009. 14. Onder G, Petrovic M, Tangiisuran B, et al. Development and validation
of a score to assess risk of adverse drug reactions among in-hospital patients 65 years or older: The GerontoNet ADR Risk Score. Arch Intern Med.2010;170:1142–1148.
15. Trivalle C, Burlaud A, Ducimetière P; The IMEPAG Group 1. Risk fac-tors for adverse drug events in hospitalised elderly patients: a geriatric score. Eur Geriatr Med.2011;2:284–289.
16. American Geriatrics Society 2012 Beers Criteria Update Expert Panel. American Geriatrics Society updated Beers Criteria for potentially inappropriate medication use in older adults. J Am Geriatr Soc. 2012;60:616–631.
17. World Health Organization. International Drug Monitoring: The Role of National Centres (World Health Organization Technical Report Series No. 498). Geneva: World Health Organization; 1972.
18. Royston P, Altman DG, Sauerbrei W. Dichotomizing continuous predictors in multiple regression: a bad idea. Stat Med. 2006;25: 127–141.
19. Naranjo CA, Busto U, Sellers EM, et al. A method for estimating the probability of adverse drug reactions. Clin Pharmacol Ther. 1981;30(2):239–245.
20. Hallas J, Harvald B, Gram LF, et al. Drug related hospital admissions: the role of definitions and intensity of data collection and the possibility of prevention. J Intern Med. 1990;228:83–90.
21. Field A. Discovering Statistics Using IBM SPSS Statistics. 4th edition. London: Sage; 2013.
22. O’Connor MN, Gallgher P, Byrne S, O’Mahony D. Adverse drug reac-tions in older patients during hospitalisation: are they predictable? Age Ageing. 2012;41:771–776.
23. Hingorani AD, Windt DA, Riley RD, et al. Prognosis research strategy (PROGRESS) 4: stratified medicine research. BMJ. 2013;346:e5793. 24. Siontis GC, Tzoulaki I, Siontis KC, Ioannidis JP. Comparisons of
established risk prediction models for cardiovascular disease: systematic review. BMJ.2012;344:e3318.
25. Nelson EA, Dannefer D. Age heterogeneity: fact or fiction? The fate of diversity in gerontological research. Gerontologist. 1992;32:17–23. 26. Macaskill P, Walter SD, Irwig L. A comparison of methods to detect
publication bias in meta-analysis. Stat Med.2001;20:641–654. 27. Hemingway H, Riley RD, Altman DG. Ten steps towards improving
prognosis research. BMJ. 2009;339:b4184.
28. Steyerberg EW, Moons KG, van der Windt DA, et al. Prognosis research strategy (PROGRESS) 3: prognostic model research. PLoS Med.2013;10:e1001381.
29. Geersing G-J, Bouwmeester W, Zuithoff P, Spijker R, Leeflang M, Moons KG. Search filters for finding prognostic and diagnostic pre-diction studies in medline to enhance systematic reviews. PLoS One. 2012;7:e32844.
30. World Health Organization. World Health Day 2012 Toolkit for Orga-nizers (webpage on the Internet). Geneva: World Health Organization; 2012. Available from: http://www.who.int/world-health-day/2012/ toolkit/background/en/index.html. Accessed August 30, 2012. 31. Onder G, Pedone C, Landi F, et al. Adverse drug reactions as cause
of hospital admissions: results from the Italian Group of Pharma-coepidemiology in the Elderly (GIFA). J Am Geriatr Soc. 2002;50(12): 1962–1968.
32. Moher D, Liberati A, Tetzlaff J, Altman DG; The PRISMA Group. Preferred reporting items for systematic reviews and meta-analyses: the PRISMA statement. BMJ. 2009;151(4):264–269.
Clinical Interventions in Aging downloaded from https://www.dovepress.com/ by 118.70.13.36 on 20-Aug-2020
Dovepress ADr risk prediction in older adults
Supplementary materials
Table S1 embase search strategy indicating the order in which the terms were entered and how they were combined
Risk tool
1. risk assessment.mp. [mp = title, abstract, subject headings, heading word, drug trade name, original title, device manufacturer, drug manufacturer, device trade name, keyword]
2. exp prediction/ 3. exp scoring system/ 4. exp clinical assessment tool/ 5. exp risk factor/
6. exp risk management/ 7. exp decision support system/
8. risk stratification.mp. [mp = title, abstract, subject headings, heading word, drug trade name, original title, device manufacturer, drug manufacturer, device trade name, keyword]
9. 1 or 2 or 3 or 4 or 5 or 6 or 7 or 8a
Medication related problem
10. exp adverse drug reaction/
11. adverse drug event*.mp. [mp = title, abstract, subject headings, heading word, drug trade name, original title, device manufacturer, drug manufacturer, device trade name, keyword]
12. adverse drug reaction*.mp. [mp = title, abstract, subject headings, heading word, drug trade name, original title, device manufacturer, drug manufacturer, device trade name, keyword]
13. medication related problem*.mp. [mp = title, abstract, subject headings, heading word, drug trade name, original title, device manufacturer, drug manufacturer, device trade name, keyword]
14. drug related problem*.mp. [mp = title, abstract, subject headings, heading word, drug trade name, original title, device manufacturer, drug manufacturer, device trade name, keyword]
15. exp medication therapy management/ 16. drug/ae [Adverse Drug reaction] 17. exp polypharmacy/
18. exp medication error/ae, pc [Adverse Drug reaction, Prevention]
19. inappropriate prescri*.mp. [mp = title, abstract, subject headings, heading word, drug trade name, original title, device manufacturer, drug manufacturer, device trade name, keyword]
20. (readmission and drugs).mp. [mp = title, abstract, subject headings, heading word, drug trade name, original title, device manufacturer, drug manufacturer, device trade name, keyword]
21. patient compliance.mp. [mp = title, abstract, subject headings, heading word, drug trade name, original title, device manufacturer, drug manufacturer, device trade name, keyword]
22. 10 or 11 or 12 or 13 or 14 or 15 or 16 or 17 or 18 or 19 or 20 or 21a
Elderly
23. aged/ 24. exp aging/ 25. exp elderly care/ 26. older people.mp. 27. older person.mp. 28. aged over 80.mp.
29. 23 or 24 or 25 or 26 or 27 or 28 or 29a
Combined terms
30. 9 and 22 and 29a
Notes:aThe numbers demonstrate how search terms have been combined ie, all of the terms for the risk tool were combined in step 9 of the search. Then these combined
terms were combined with those from all those relating to medication related problems ie, step 22 and with terms relating to elderly ie, step 29. This resulted in a combined search of the terms listed in steps 9 and 22 and 29.
Abbreviations: exp, explode all trees; mp, multiple posting.
Clinical Interventions in Aging downloaded from https://www.dovepress.com/ by 118.70.13.36 on 20-Aug-2020
Dovepress
stevenson et al
Table S2 Criteria to consider when evaluating the quality of risk prediction models
Standard criteriaa
Explanation Example
study design Prospective: allows optimal collection of potential candidate variables; smaller dataset often generated.
retrospective: enables use of large previously collected datasets; quality of candidate variable data may be compromised due to missing data, which rarely occurs at random.
Prospective study design, n=690, all exclusions were for appropriate reasons.1
retrospective study design, n=5,936, unknown number of exclusions due to missing data.2
Participant recruitment
Inclusion and exclusion criteria should be clearly described to allow full assessment of patient population studied.
Any systematic variation in recruitment of patients should be viewed with caution due to risk of sampling bias.
There is no predetermined satisfactory number for loss to follow-up; however, it should be considered that missing data impacts on the statistical power of the study.
Interview data was only collected for half of the patients during the development phase.
Patients not wishing to participate in the interview may systematically differ.3
Candidate predictor variables
Variables and their measurement should be clearly defined to allow for replication.
Investigators should be blind to outcome to reduce risk of bias. Continuous variables should be assessed for conformity to linear gradient.
not necessary for dichotomous variables; however, dichotomization of continuous variables not recommended as it impacts on the statistical power of the study.
Correlation (test for colinearity) between risk variables should be examined and reported.
Unclear how key variables, eg, liver disease, were defined. To replicate, study investigators would be required to apply their own definition, which may have an impact on reproducibility.2
Outcome Method of measuring outcome: must be reproducible and, where assessment scales are applied, these should be validated to increase accuracy and reproducibility of the measurement. Dichotomization of continuous outcomes is not recommended as it can affect statistical power.
Investigators generated own causality assessment of unknown validity.4 Applied widely-used validated causality assessment (naranjo algorithm).2 statistical power sample size is calculated based on number of outcome events per
variable, where ten events per variable is often recommended. A high number of variables and a rare outcome can result in over-fitting of the model, causing poor generalizability.
reported 86 ADrs in a sample of 690 patients and assessed 34 candidate predictor variables, resulting in only 2.5 events per variable.1
selection of variables
Independent variable selection should be described clearly, and can be based on the literature and/or statistical association as determined by univariate analysis with outcome variable. selection based upon univariate analysis alone increases likelihood of developing an over-fitted model. Inclusion of variables applicable to over 5% of population may help exclude artifact variables.
Fitting procedure (entering of variables into model) should be explicitly stated, including removal criteria.
Variables were entered into multivariate analysis if P0.05 after univariate analysis, or if P0.25 for variables identified from other studies. liver disease was removed as it applied to 5% of population. Backward elimination and forward selection were used with a removal criteria of P=0.10.1
Model performance
In both development and validation phases, assessment of discrimination and calibration should be reported to determine how well the model distinguishes those who have an ADr from those who have not, as well as how close the prediction is to the observed outcome for that risk group.
AUrOC 0.7 is often deemed acceptable, but this alone is not sufficient to determine the clinical usefulness of the model.6
Assessment of the generalizability of the model is important to determine the accuracy of predictions in another population and is recommended prior to routine clinical application. Internal validation, by methods such as bootstrapping (data resampling) or split-sample, assesses how well predictors correspond to the outcome, but leads to optimistic estimates of model performance. external validation is more rigorous and enables assessment of accuracy when the model is applied by investigators not involved in the development of the model.
Discrimination (AUrOC) and calibration (hosmer-lemeshow) reported in the development and validation phases.1 Trivalle applied bootstrapping.5 Onder applied external validation whereby the model was applied by investigators not involved in the development of the model and in a different geographical location.7
Note:aCriteria derived from the published literature.8–11
Abbreviations: ADr, adverse drug reaction; AUrOC, area under the receiver operator curve.
Clinical Interventions in Aging downloaded from https://www.dovepress.com/ by 118.70.13.36 on 20-Aug-2020
Clinical Interventions in Aging
Publish your work in this journal
Submit your manuscript here: http://www.dovepress.com/clinical-interventions-in-aging-journal
Dovepress
Clinical Interventions in Aging is an international, peer-reviewed journal focusing on evidence-based reports on the value or lack thereof of treatments intended to prevent or delay the onset of maladaptive correlates of aging in human beings. This journal is indexed on PubMed Central, MedLine,
CAS, Scopus and the Elsevier Bibliographic databases. The manuscript management system is completely online and includes a very quick and fair peer-review system, which is all easy to use. Visit http://www.dovepress. com/testimonials.php to read real quotes from published authors.
Dovepress ADr risk prediction in older adults
References
1. Siontis GC, Tzoulaki I, Siontis KC, Ioannidis JP. Comparisons of established risk prediction models for cardiovascular disease: systematic review. BMJ. 2012;344:e3318.
2. Nelson EA, Dannefer D. Age heterogeneity: fact or fiction? The fate of diversity in gerontological research. Gerontologist. 1992;32:17–23. 3. Hingorani AD, Windt DA, Riley RD, et al. Prognosis research strategy
(PROGRESS) 4: stratified medicine research. BMJ. 2013;346:e5793. 4. Macaskill P, Walter SD, Irwig L. A comparison of methods to detect
publication bias in meta-analysis. Stat Med. 2001;20:641–654. 5. Trivalle C, Burlaud A, Ducimetière P; The IMEPAG Group 1. Risk
fac-tors for adverse drug events in hospitalised elderly patients: a geriatric score. Eur Geriatr Med. 2011;2:284–289.
6. Field A. Discovering Statistics Using IBM SPSS Statistics. 4th edition. London: Sage; 2013.
7. Onder G, Petrovic M, Tangiisuran B, et al. Development and validation of a score to assess risk of adverse drug reactions among in-hospital patients 65 years or older: The GerontoNet ADR Risk Score. Arch Intern Med. 2010;170:1142–1148.
8. Yourman LC, Lee SJ, Schonberg MA, Widera EW, Smith AK. Prog-nostic indicies for older adults. A systematic review. JAMA. 2012; 307:182–192.
9. Bagley SC, White H, Golomb BA. Logistic regression in the medical literature: standards for use and reporting, with particular attention to one medical domain. J Clin Epidemiol. 2001;54:979–985.
10. Critical Appraisal Skills Programme for Clinical Prediction Rules [homepage on the Internet]. Available from: http://www.casp-uk.net. Accessed November 9, 2011.
11. Steyerberg EW. Clinical Prediction Models: a practical approach to development, validation and updating. New York: Springer; 2010.
Clinical Interventions in Aging downloaded from https://www.dovepress.com/ by 118.70.13.36 on 20-Aug-2020