IMPLEMENTATION,VALIDATION AND APPLICATION OF AN AUTOMATED MOTION CORRECTION ALGORITHM IN HEPATIC PERFUSION CT FOR
IMAGE-GUIDED RADIOTHERAPY
(Thesis format: Integrated Article)
by
Nikolaj KG Jensen
Graduate Program in Physics
A thesis submitted in partial fulfillment of the requirements for the degree of
Doctor of Philosophy
The School of Graduate and Postdoctoral Studies The University of Western Ontario
London, Ontario, Canada
Abstract
Functional imaging holds promise in guiding, evaluating and predicting efficacy of cancer treatment. Perfusion imaging provides high resolution functional information generated by applying a model to a dynamic series of contrast enhanced anatomical images.
The objectives of this thesis are: 1) to develop and validate a registration algorithm to reduce breathing motion artifacts in hepatic perfusion CT, and 2) to evaluate the potential of perfusion CT to improve radiotherapy of liver cancer.
An automated one-dimensional correlation-based registration algorithm was developed and validated in phantom and pig studies and against manual registration of patient scans. This algorithm was used to register dynamic contrast enhanced CT (DCE-CT) image series, which consisted of 40 CT volumes acquired sequentially over 2 minutes. Perfusion maps were generated from unregistered and registered DCE-CT scans and compared to determine impact of motion correction on tumour-normal tissue contrast.
The motion corrected perfusion maps were used in a radiotherapy target volume
delineation study. Three observers delineated tumours on perfusion images and standard contrast enhanced 4D-CT scans. Interobserver concordance was used as surrogate for accuracy. Knowledge of contrast kinetics from DCE-CT scans was also applied to model contrast enhancement in radiotherapy alignment beam CT. Contrast enhanced cone-beam CT scans were acquired of two rabbits to determine improvements in target
alignment.
Target delineation interobserver variability was significantly reduced with perfusion maps compared to standard clinical 4D-CT. Tumour alignment was improved by increased tumour-normal tissue contrast in contrast-enhanced cone-beam CT.
In conclusion, it is possible to obtain useful hepatic perfusion maps from DCE-CT scans of free breathing patients provided motion correction is applied. DCE-CT also improves targeting and patient alignment for radiotherapy and could be a valuable addition to current clinical imaging.
Keywords
Co-Authorship Statement
Chapter 2 was coauthored by: Mr Nikolaj Jensen, developed registration algorithm, performed phantom and animal CT scans and performed all data analysis. Mr Anthony Lausch MSc, performed 3D registration for motion correction of pig scans. Dr Michael Lock MD, recruited patients for study, provided clinical information and edited paper. Dr Barbara Fisher MD, principle investigator responsible for ethics approval, provided edits for paper. Dr Roman Kozak MD, radiologist in charge of referring and scheduling patients. Dr Jeff Chen PhD, helped with experiment design, data analysis and provided edits. Dr Ting-Yim Lee PhD, helped with experiment design, provided access to CT scanner and supervision. Dr Eugene Wong PhD, helped with experiment design, data analysis, provided the phantom used for validation and provided edits and supervision of experiment.
Chapter 3 was coauthored by: Mr Nikolaj Jensen, performed all data analysis and collated patient demographics with scans. Dr Michael Lock MD, recruited patients for study, provided clinical information and edited paper. Dr Barbara Fisher MD, principle investigator responsible for ethics approval, provided edits for paper. Dr Roman Kozak MD, radiologist in charge of referring and scheduling patients. Dr Xiaogang Chen PhD, Modified CT Perfusion software to include RMSD calculation. Dr Jeff Chen PhD, helped with experiment design, data analysis and provided edits. Dr Eugene Wong PhD, helped with experiment design, data analysis, provided the phantom used for validation and provided edits and supervision. Dr Ting-Yim Lee PhD, helped with experiment design, provided access to CT scanner and supervision.
Dr Jeff Chen PhD, helped with experiment design, data analysis and provided edits. Dr Ting-Yim Lee PhD, helped with experiment design, provided access to CT scanner and supervision. Dr Eugene Wong PhD, helped with experiment design, data analysis, and provided edits and supervision of experiment.
Chapter 5 was coauthored by: Mr Nikolaj Jensen, acquired all cone-beam CT scans, created treatment plans, evaluation of registration accuracy and data analysis. Dr Errol Stewart PhD, implanted tumour, performed DCE-CT and cine-imaging and animal care. Ms Lise Desjardins, anesthetized and monitored animals and assisted during all image acquisitions and tumour implantation. Dr Jeff Chen PhD, provided technical assistance and training in operating cone-beam CT console and LINAC as well as treatment
planning software and experiment guidance. Dr Ting-Yim Lee PhD, provided supervision and guidance. Dr Eugene Wong PhD, experimental setup, guidance, initial idea for simulation and supervision.
Acknowledgments
I would like to thank my supervisor Dr Eugene Wong for his unending support and dedication, his guidance and patience have made this work possible. Eugene put me in a position to succeed and helped surround me with people who provided me opportunities and support. Drs Ting-Yim Lee, Jeff Chen and Michael Lock have provided me with invaluable research opportunities, help, support and guidance.
For help in data acquisition and processing I would like to extend a heartfelt thank you to Kevin Sinclair for helping in processing patient scans and distilling patient charts into useful mineable data. I would like to thank Danielle Mulder for her hard work that was so instrumental to getting the tumour delineation study going including retrieving and registering the images, contouring all image sets and getting the oncologists to do the same. I would like to thank Dr Greg Pierce for his help in scanning the phantom used for validation of the registration method. For allowing me to piggy-back on his study and for providing ever aspect of animal care and setup in scanning pigs for validation I would to thank Dr Aaron So, Jennifer Hadway and Laura Morrison. A big thank you to Dr Errol Stewart, Mark Dekaban and Lise Desjardins for the very long hours spent and the hard work and support put in during rabbit experiments. Those experiments would certainly not have happened with you two and your extremely hard work and patience.
A big thank you to all current and former members of the Wong research group including Dr Michael Oliver, Jeff Craig, Michael Jensen, Anthony Lausch, Dr Iram Munavar, Dr Ady Abdellatif, Bon Ryu, William “Tom” Hrinivich – Tuesday mornings may never be quite the same again without those group meetings, the challenge of explaining my work and understanding yours.
To all those who have inspired me to get to where I am today, Kurt Nielsen, Jens Ingwersen, KP Larsen and Niels Dahl for making science and especially physics
Table of Contents
Abstract ... ii
Co-Authorship Statement... iv
Acknowledgments... vi
Table of Contents ... viii
List of Tables ... xii
List of Figures ... xiii
List of Appendices ... xv
List of symbols, abbreviations and nomenclature... xvi
Chapter 1... 1
1 Introduction ... 1
1.1 Liver pathology... 1
1.1.1 Normal liver function... 1
1.1.2 Liver diseases... 2
1.1.3 Intrahepatic cancer ... 3
1.1.4 Treatment ... 4
1.2 Imaging of liver cancer ... 6
1.2.1 Respiration tracked 4D-CT ... 7
1.2.2 Cone-beam CT ... 8
1.2.3 Tri-phasic CT ... 8
1.2.4 MRI ... 8
1.2.5 PET ... 9
1.2.6 SPECT... 9
1.3.1 Image acquisition ... 10
1.3.2 Deconvolution model... 11
1.3.3 Dual input modification of perfusion model... 13
1.3.4 Organ motion ... 14
1.3.5 Registration ... 15
1.3.6 Filtering... 16
1.3.7 Signal to noise... 18
1.4 Radiotherapy ... 20
1.4.1 Planning ... 20
1.4.2 Alignment and treatment... 21
1.5 Implementation and validation of DCE-CT motion correction ... 21
1.6 Objectives and outline... 24
1.6.1 Hypothesis... 24
1.6.2 Research objectives... 24
1.6.3 Thesis outline ... 25
1.7 References... 27
Chapter 2... 33
2 Hepatic CT perfusion with semi-automatic retrospective respiratory motion correction: implementation and validation... 33
2.1 Introduction... 33
2.2 Materials and methods ... 34
2.2.1 Image acquisition ... 34
2.2.2 Filtering and registration... 36
2.2.3 Interpolation and reconstitution of missing data... 39
2.2.4 Validation with a priori known motion in phantom and animal studies... 40
2.2.6 Algorithm robustness ... 42
2.2.7 Manual registration of patient scans ... 43
2.3 Results... 43
2.3.1 A priori known motion in phantom and animal studies... 43
2.3.2 Resolution improvement by interpolation ... 46
2.3.3 Motion induced artifacts in perfusion values from animal studies ... 47
2.3.4 Robustness with respect to user input in patient studies... 51
2.3.5 Manual registration of patient studies... 53
2.4 Discussion ... 54
2.5 Conclusion ... 57
2.6 References... 58
Chapter 3... 60
3 Prediction and reduction of motion artifacts in free breathing dynamic contrast enhanced CT perfusion imaging of primary and metastatic intrahepatic tumours ... 60
3.1 Introduction... 60
3.2 Materials and methods ... 62
3.3 Results... 66
3.4 Discussion ... 73
3.5 References... 75
Chapter 4... 78
4 Dynamic contrast enhanced CT aiding gross tumour volume delineation of liver cancers: an interobserver variability study... 78
4.1 Introduction... 78
4.2 Materials and methods ... 79
4.3 Results... 82
4.5 References... 90
Chapter 5... 93
5 Contrast enhanced cone-beam CT improves tumour alignment in image guided radiotherapy of liver tumours... 93
5.1 Introduction... 93
5.2 Material and methods... 94
5.3 Results... 101
5.4 Discussion ... 105
5.5 References... 107
Chapter 6... 108
6 Discussion ... 108
6.1 Motion correction in perfusion CT of liver in cancer patients... 110
6.2 Perfusion CT for radiotherapy planning ... 111
6.3 Application of perfusion CT to radiotherapy... 112
6.4 Contrast enhanced cone-beam CT ... 112
6.5 Limitations ... 113
6.6 Future work... 114
6.7 Conclusion ... 114
6.8 References... 115
Appendices... 117
List of Tables
Table 1: Difference of means and 95% confidence intervals of ABF and BV... 51
Table 2: Perfusion parameters in normal and tumour tissue... 66
Table 3: Perfusion values in high and low patients... 68
Table 4: Patient demographics... 80
Table 5: Imaging parameters for DCE-CT and CBCT. ... 96
List of Figures
Figure 1: Johnson-Wilson impulse response function. ... 13
Figure 2: Example of median filtering... 18
Figure 3: DCE-CT and 4D-CT slices of same patient. ... 19
Figure 4: Flow diagram of registration algorithm... 35
Figure 5: Registration regions of interest covering high contrast features. ... 36
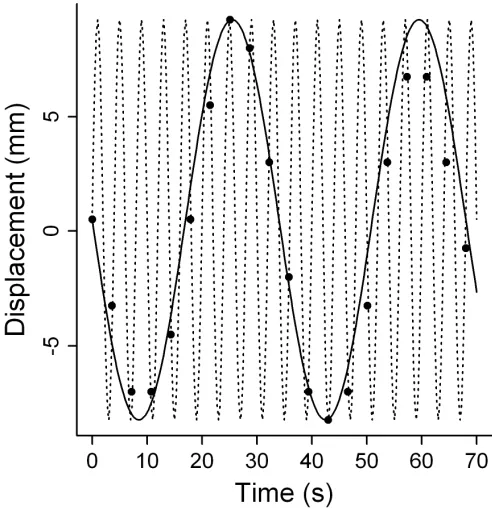
Figure 6: Phantom displacement vs. time. ... 44
Figure 7: Simulated motion tracks... 45
Figure 8: Interpolation and image reconstruction comparison. ... 46
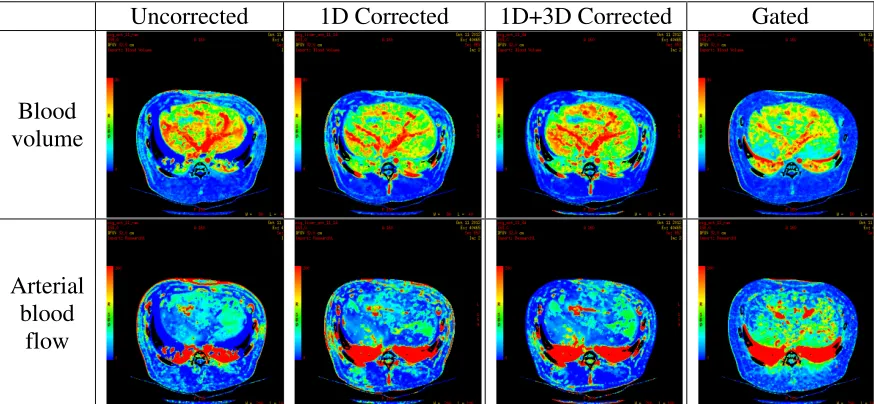
Figure 9: Sample perfusion maps with different motion correction algorithms... 48
Figure 10: Bland-Altman plots of blood volume... 49
Figure 11: Bland-Altman plots of arterial blood flow. ... 50
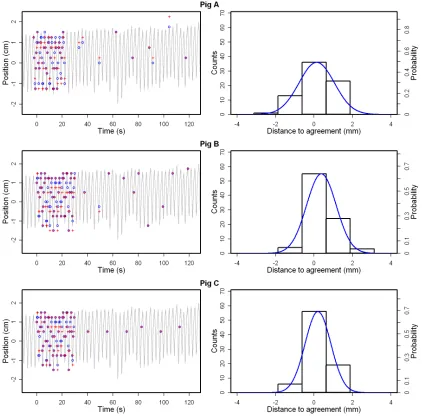
Figure 12: Distance to agreement distributions. ... 52
Figure 13: Sample patient perfusion maps with and without motion correction... 53
Figure 14: Sample time-density curve (TDC) with model fit and residuals... 64
Figure 15: Pre- and post-correction perfusion values. ... 67
Figure 16: Relative changes in perfusion values due to motion. ... 70
Figure 17: Motion induced artifacts in perfusion values vs. RMSD. ... 71
Figure 19: 4D-CT, DCE-CT and perfusion CT slices. ... 84
Figure 20: Boxplots of Dice’s coefficients. ... 85
Figure 21: Dice’s coefficient vs. tumour volume. ... 87
Figure 22: Simulated and measured contrast enhancement curves. ... 100
Figure 23: Contrast enhancement curves for CBCT and DCE-CT... 101
Figure 24: Sample CBCT slices with and without breath hold and contrast. ... 102
Figure 25: CTV coverage vs. PTV margin expansion... 104
List of Appendices
Appendix 1: Published liver perfusion CT values. ... 117
Appendix 2: Ethics approval for human subjects. ... 119
Appendix 3: Ethics approval for porcine scans. ... 120
Appendix 4: Ethics approval for rabbit scans. ... 121
List of symbols, abbreviations and nomenclature
Symbol Definition Units
4D-CT 4 dimensional computed tomography -
α(x) Hepatic arterial fraction %
A Area under the curve -
AFP α-phetoprotein -
ALD Alcoholic liver disease -
BF Blood flow ml/100g/min
BV Blood volume ml/100g
CBCT Cone-beam computer tomography -
CT Computer tomography -
CTDI Computed tomography dose index Gy
CTV Clinical target volume -
DCE Dynamic contrast enhanced -
DLP Dose length product Gy cm
E Extraction fraction -
EGFR Epidermal growth factor receptor -
EV Extravascular space -
FDG Flouro-deoxyglucose -
FWHM Full width half maximum -
GTV Gross tumour volume -
HABF Hepatic arterial blood flow ml/100g/min
HAI(t) Hepatic arterial input -
HCC Hepatocellular carcinoma -
HCV Hepatitis C virus -
I(t) Contrast input function -
∆I Change in intensity HU
ICC Intrahepatic Cholangiocarcinoma -
IGRT Image guided radiotherapy -
IRF(t,x) Impulse response function -
IV Intravascular space -
LoG Laplacian of Gaussian -
MRI Magnetic resonance imaging -
MTT Mean transit time min
PET Positron emission tomography -
PS Permeability surface product ml/100g/min
PTV Planning target volume -
PVBF Portal vein blood flow ml/100g/min
PVI(t) Portal vein input -
RFA Radiofrequency ablation -
RMC Respiratory motion correction - RMSD Root mean square deviation map -
ROI Region of interest -
RT External beam radiotherapy -
SNR Signal to noise ratio -
SPECT Single photon emission computed tomography -
T0 Contrast arrival time min
TDC(t,x) Time density curve -
Ti Contrast injection duration min
∆Tonset Arrival time delay between arterial and veinous contrast min
V Contrast volume ml
Chapter 1
1
Introduction
Contrast enhanced imaging is used worldwide for a wide variety of medical purposes. In this thesis I will describe dynamic contrast enhanced computed tomography imaging and the lessons learned from this technique that may help improve radiotherapy outcome for patients with liver cancer.
1.1
Liver pathology
1.1.1
Normal liver function
Blood is supplied to the liver by two separate vessels, the hepatic artery and the portal vein. The hepatic artery supplies oxygenated blood from the abdominal aorta, while the portal vein supplies de-oxygenated but nutrient rich blood from the gastrointestinal tract [1]. Normal liver tissue is mostly perfused by the portal vein which contributes 60-80% of the total blood flow [2].
The liver plays a key role in metabolism and filtering and synthesis of metabolic waste-products for excretion. Protein metabolism is an important and nearly exclusive function of the normal liver [3] including deamination, synthesis of essential amino-acids,
conversion of aminoacids into glucose and lipids and conversion of ammonia into urea. Fat metabolism is not a unique trait to the liver, but many aspects of fat metabolism and storage is carried out predominantly in the liver: oxidization of triglycerides, conversion of carbohydrates and amino-acids into fatty acids for storage in the adipose tissues, synthesis of cholesterol for metabolism or excretion and production of bile necessary for emulsifying fat in the intestine so it can be absorbed into the bloodstream [4]. Glucose balance in the blood is primarily maintained by the liver by forming and storing glycogen when the blood glucose concentration is elevated and by depolymerizing glycogen when glucose is needed to maintain the blood concentration [5].
excrete. The liver filters and excretes bilirubin which is produced by degradation of heme in the spleen, a waste-product of the breakdown of red blood cells [6]. Filtering and excretion of several drugs, minerals and hormones also primarily happens in the liver including xenobiotics, steroids, calcium, iron and copper. All liver excretion is through bile secretion, lipophilic compounds, heavy metals and lipids are dissolved in the bile and diffuse into the small bowel for elimination [7].
One issue in diagnosing liver cancer and other liver diseases is that the liver has significant redundant capacity and can function adequately with only a fraction of the hepatocytes working. This allows for partial liver transplants from a healthy subject as the remaining liver will be able to maintain normal function. Liver diseases can remain asymptomatic for quite a long time due to this redundancy [8].
1.1.2
Liver diseases
Alcohol is primarily metabolized in the liver and kidneys making these organs especially susceptible to damage from excessive alcohol intake. Alcoholic liver disease (ALD) is a common ailment among people with high alcohol consumption and can lead to a number of severe liver disorders. Fatty liver is the earliest lesion of ALD, caused by an
accumulation of triacylglycerol due to increase in supply of glycerol and free fatty acids in the liver. Fatty liver often displays one large central fatty lesion. Following prolonged alcohol abuse, non-viral hepatitis may set in, which may itself cause hepatic dysfunction or even organ failure. Alcohol hepatitis can progress to cirrhosis, the formation of fibrous nodules in the liver which can cause problems ranging from portal hypertension to hepatocellular carcinoma [9].
Fibrogenesis in the liver is a response to tissue injuries, causing accumulation of
extracellular matrix or scar tissue. This activity can lead to formation of nodules fibrous tissue that can lead to changes in hepatic function by causing changes to biliary and blood flow. Fibrogenesis is a response to a number of different injuries including alcohol or drug induced, infectious and autoimmune diseases, metabolic ailments and ionizing radiation [15]. Cirrhosis affects several hundred million people worldwide and although it may remain asymptomatic for years, once complications set in such as ascites or
encephalopathy the 5 year survival rate drops to 50%. Cirrhosis is a risk factor for development of hepatocellular carcinoma, and radiographically it may be difficult to distinguish cirrhotic nodules from cancerous neoplasms. Severe cirrhosis is associated with portal hyper-tension and an increase in fraction of total blood flow to the liver from the hepatic artery, making it difficult to separate from hypervascular HCC [8].
1.1.3
Intrahepatic cancer
Cholangiocarcinoma is caused by a malignancy in the epithelial cells that line the bile ducts. About 1/3 of all cholangiocarcinomas are intrahepatic [25]. Cholangiocarcinoma is a much rarer form of cancer than HCC, however incidence rates are on the rise [26]. Tumours in the intra-hepatic bile ducts tend to have few if any specific symptoms, often presenting with abdominal pain and diarrhea. Diagnosis is often done by eliminating all other possibilities, including HCC [27].
Cancer from a number of sites may metastasize to the liver due to the filtering function of the liver, the high blood throughput and the readily available nutrients. Colorectal,
pancreatic and breast carcinomas all metastasize aggressively to the liver, but other sites such as neuroendocrine and skin tumours may also metastasize to the liver [28].
The majority of patients analyzed as part of this thesis were diagnosed with HCC (n=17), the rest were diagnosed with colorectal metastasis (n=5), intrahepatic
cholangiocarcinoma (n=2), breast metastasis (n=2) and 1 each of renal cell carcinoma, melanoma, neuroendocrine, and lung metastasis.
1.1.4
Treatment
Several treatment modalities are used to treat patients diagnosed with liver cancer such as surgical resection or transplantation, ablative therapies such as radio frequency ablation, external beam radiotherapy, trans-arterial embolization combined with either
chemotherapy or internal radiation using seeds and systemic chemotherapy.
The most common forms of non-surgical treatment for primary liver lesions are radiofrequency ablation (RFA), trans-arterial chemo embolization (TACE), chemotherapy and radiotherapy or a combination of multiple therapies.
RFA is performed by image guided insertion of one or more needles into the tumour that connect to a large grounding pad placed on the patients skin, a large alternating current field is induced in the needle and the high resistance of the tissue around the needle causes localized heating leading to necrosis. RFA can not be applied if the tumour is close to a major blood vessel due the cooling effect of the blood; some attempts have been made to occlude blood vessels to the liver during treatment to increase the size of the ablated region [32]. RFA has been proven to be effective in both HCC [33, 34] and metastatic tumours in the liver [35, 36].
TACE is the image guided insertion of a catheter via the femoral artery and abdominal aorta to the hepatic artery. By injecting iodinated contrast agent via the catheter an angiogram can be acquired showing hyperdensity of arterial blood vessels. The catheter can be maneuvered such that either a chemotherapeutic or radiotherapeutic agent can be injected directly into the arterial branch feeding the tumour followed by an embolizing agent, often polyvinyl alcohol spheres that occlude the blood vessels, cutting of the tumours access to oxygenated blood. The most common therapeutic agents are doxorubicin, cisplatin, mitomycin [37] and microspheres containing Yttrium-90 [38], which is a β-emitter. TACE in the liver is only used to treat HCC as it only occludes the arterial blood supply which is the lesser part of the blood supply to most other hepatic tumours including ICC and metastasis.
Several systemic chemotherapeutic agents such as cisplatin, mitomycin C, doxorubicin and 5-fluorouracil have been employed clinically for treatment of primary liver
malignancies. A new generation of drugs targeting biochemical pathways upregulated in tumours have become available and several have been applied to liver cancer recently. Specifically, drugs targeting the vascular endothelial growth factor (VEGF) or epidermal growth factor receptor (EGFR) pathways, including bevacizumab, sorafenib and
systemic therapeutics [39]. Several traditional chemotherapy agents have been tested in liver, including thalidomide and tamoxifen among others, but have shown little efficacy in controlling advanced HCC [24].
External beam radiotherapy (RT), especially with the prevalence of hypofractionated treatment schemes, has recently become a viable treatment option of advanced HCC and cholangiocarcinomas in patients who are not eligible for surgery or ablation [40]. Modern treatment techniques allow for very conformal dose distributions and the widespread adoption of image guided therapy has allowed for better sparing of healthy tissue and dose escalation to the treatment target.
All patients in this study were scheduled for external beam radiotherapy, although some may have had other forms of therapy previously, including chemotherapy, TACE, surgery and prior radiotherapy at a distant site in the case of some metastatic patients.
1.2
Imaging of liver cancer
Accurate imaging is critically important to radiotherapy as it relies on both target
delineation for optimal treatment and normal tissue anatomy for dosimetry. The filtering and metabolic roles of the liver means normal liver tissue has high uptake of many compounds and metabolites which makes many forms of imaging less effective in liver than in other sites. Several different imaging modalities have been used for treatment planning of radiotherapy of liver cancer, including MRI (Magnetic Resonance Imaging), 4D-CT (4 Dimensional Computed Tomography), DCE-MRI (Dynamic Contrast
Enhanced – Magnetic Resonance Imaging) and PET (Positron Emission Tomopgrahy).
1.2.1
Respiration tracked 4D-CT
4D-CT is the extension of traditional 3D computer tomography to include a dynamic time component that visualizes respiratory motion by reconstructing several image volumes in different phases of the respiratory cycle. The respiratory cycle is measured using either an external surrogate, a spirometer or an internal imaging feature. Image projections are then binned based on the part of the respiratory cycle they were acquired in and image
volumes are then reconstructed from these binned projections.
Two different imaging techniques have been proposed for acquiring 4D-CT of the liver: helical acquisition and axial cine. During helical acquisition the imaging couch is continuously moved through the bore at a slow pace to allow oversampling at all
locations [41]. Axial cine scans are acquired by keeping the couch stationary, performing a cine scan that covers several respiration cycles and then progressing the couch by a distance equal to the axial field of view and repeating until the desired volume has been imaged [42]. Helical acquisition has a number of benefits including being faster, less prone to severe distortions due to changes in the respiratory cycle during imaging and less labor intensive compared to axial cine.
Contrast enhanced 4D-CT is used for radiotherapy treatment planning of many forms of abdominal and thoracic cancer including primary and metastatic liver tumours and lung [41]. Due to the dual blood supply of the liver, contrast kinetics can vary substantially between different types of tumours as well as other disease states such as cirrhosis or fibrosis. HCC is known to have a high fraction of arterial blood supply which means that it enhances earlier than the surrounding normal liver tissue. Optimal liver tumour contrast would be achieved by imaging during the arterial enhancement phase.
All patients in this study underwent contrast enhanced helical 4D-CT as part of the routine radiotherapy planning, the acquired 4D-CT image sets formed the basis for clinical contouring for treatment planning and dosimetry.
1.2.2
Cone-beam CT
Cone-beam CT (CBCT) is commonly used for image guided radiotherapy (IGRT) [43]. Using a cone x-ray source and a large 2D flat-panel detector mounted onto the linac gantry, the anatomy of the patient is imaged in a single rotation and aligned to the
planning CT scan using image registration. Acquisition times typically range from 30-60 seconds for a single rotation, which does make this imaging modality highly susceptible to reconstruction artifacts from respiratory motion.
1.2.3
Tri-phasic CT
Tri-phasic CT images are acquired in multiple phases of contrast enhancement. It is the current gold standard for diagnosis and treatment response assessment up of HCC. A pre-contrast image volume is acquired with a helical CT scan. Following injection of
iodinated contrast agent a second image volume is acquired during the arterial
enhancement phase. During this phase any regions with elevated arterial blood flow have enhanced contrast, while normal liver with low arterial blood flow is not. During contrast washout a third image volume is acquired.
1.2.4
MRI
Improvements in acquisition time have made MRI a very viable imaging modality for diagnosis and treatment planning of liver cancer. T2 weighted MRI images and diffusion weighted images have been shown to have very good tumour to normal tissue contrast in HCC patients [44, 45]. MRI is currently not widely available for diagnosis and treatment planning of HCC, and unlike CT imaging it does not provide tissue attenuation
coefficients, making it less suitable for dosimetry.
1.2.5
PET
Several different radio-labeled molecules have been tested as positron emission tomographic markers of liver cancer. 18-Flouro-deoxyglucose (FDG), which has been shown to be efficacious for tumour delineation in a number of sites, has been found to be of little value in the liver due to a very high uptake in normal liver tissue, leading to poor rate of true positive HCC patients [47]. Acetate has been shown to have some value as a tumour marker of HCC in PET imaging [48]. Acetate is part of cytoplasmic lipid synthesis which tends to be increased in some tumour cell lines [49]. It has been tested labeled with Carbon-11 and recently Flouride-18. Carbon-11 labeled Acetate has been shown to have high preferential tumour uptake in HCC, however when synthesized with Flouride-18 preferential uptake is diminished significantly [50]. Unfortunately, Carbon-11 is not a readily available isotope, which limits the applicability of Carbon-11-C Acetate PET imaging for tumour delineation.
1.2.6
SPECT
A number of metabolites have been radio labeled and tested for detection of liver tumours with single photon emission computed tomography (SPECT). Most tracers are labeled with 99m-Tc including tetrofosmin, DTPA-galactosyl human serum albumin and
methoxyisobutylisonitrile. Tetrofosmin has been shown to efficacious in detecting breast and lung tumours, however it has no value in detecting HCC [51]. Tc-galactosyl human serum albumin has been shown to correlate well with T2 weighted MRI and may be useful in determining if a suspected HCC is well differentiated, as increased uptake occurs mainly in well differentiated tumours while poorly differentiated tumours have decreased uptake [52]. Tc-methoxyisobutylisonitrile has shown correlation with tissue type in HCC, but detection rate is poor as uptake may be increased or decreased depending on tissue type [53].
1.3
Dynamic contrast enhanced CT
will be briefly discussed in the final chapter in this thesis. The algorithms that were applied will be described in the relevant parts of the thesis.
1.3.1
Image acquisition
CT acquisition of dynamic contrast enhanced images of the liver presents several challenges due to organ motion, organ size and required sample rate to accurately measure the aorta and portal vein contrast input curves described below.
1. Static axial acquisition [54-58]. Images are acquired with no couch motion allowing for high temporal sampling. This scan technique can be implemented on all CT scanners making it widely usable. The axial field of view is limited to the native field of view of the scanner, typically 24 or 40 mm, which is not enough to cover entire tumours and potentially not enough to include tumour and portal vein in the imaged volume.
2. Couch shuttling/table toggling axial acquisition [59]. Two contiguous couch positions are imaged alternating, effectively doubling the axial field of view of the static axial acquisition while sacrificing temporal resolution without
compromising calculation of functional parameters. Not all scanners are capable of shuttling the couch quickly enough during scanning.
3. Two phase static acquisition [60-62]. The first phase is acquired as a cine scan during arterial enhancement to increase temporal resolution, typically for up to 30 seconds with the patient holding their breath. After the initial phase, 6-10 bursts of cine scanning with pauses of 10 seconds in between are acquired with the patient breathing normally. This scan has a limited field of view and is not easily amenable to include couch motion, and only scanners with sufficiently fast rotation speed can acquire the burst cine 2nd phase with sufficient temporal resolution to avoid streaking and other respiratory artifacts.
4. Helical acquisition [63]. Fast helical acquisition can be used to cover the entire liver during scanning. This scanning technique is only possible on a select few CT scanners as the helical acquisition is not fast enough on most machines.
cause copying or deletion artifacts depending on respiratory phase and direction of couch movement.
All patient scans were acquired using technique 2. Animal scans were acquired with technique 2 and validated against technique 3. Specific details of the scanning protocols are listed in the appropriate chapters.
Dynamic contrast enhanced imaging tracks intravenous contrast agent over time. Two models have been developed to calculate perfusion maps from dynamic contrast
enhanced images: the deconvolution model [64] and the slope model [65]. Both work by tracking contrast dynamics on a voxel by voxel basis, fitting a curve to the measured contrast enhanced curve, and generating perfusion values from the parameters of the fitted curve.
1.3.2
Deconvolution model
The deconvolution (Johnson-Wilson) [64] model as implemented in CT perfusion (GE Healthcare, Waukesha, WI) was used for all calculations of perfusion values in this thesis. In organs with a single blood supply such as spleen and heart the time density curve (TDC) is given by:
) , ( ) ( ) ,
(t x I t IRF t x
TDC = ⊗ (Eq. 1)
where I(t) is the contrast enhancement curve of the blood vessel supplying blood to the organ (coronary artery for the heart, abdominal aorta for the spleen), IRF(t,x) is the modeled impulse response function at voxel x, TDC(t,x) is the time density curve at voxel x and ⊗ is the convolution operator. Perfusion parameters are calculated from iterative minimization of (Eq. 1b):
) , ( ) , ( )
(t IRF t x TDC t x
I ⊗ −
=
∆ (Eq. 1b)
impulse response function is established from a two compartment adiabatic
approximation, meaning contrast agent does not flow from voxel to voxel and is limited to either intra- or extra-vascular space, both of which are well-mixed and have
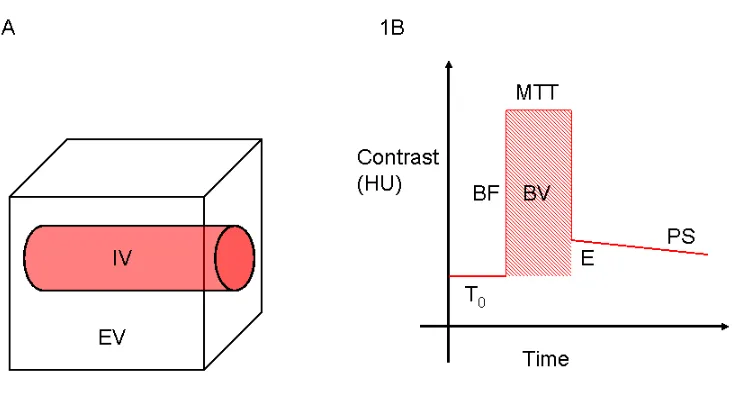
homogeneous contrast distribution (Figure 1a) [66]. The model IRF is shown in Figure 1b. Prior to contrast arriving in the voxel, density remains constant over time. At time T0 (arrival time) the contrast bolus arrives in the intra-vascular space causing a sudden rapid increase in density that is proportional to blood flow (BF). This increase lasts for a time MTT (mean transit time) during which the contrast bolus passes through the intra-vascular space. At time T0+MTT the contrast bolus leaves the intra-intra-vascular space causing a rapid decrease in density. Only the contrast that extravasated into the extra-vascular space remains in the voxel. The fraction of contrast that extravasated is the extraction fraction (E). The extravasated contrast agent will diffuse back into the blood stream and be washed out of the voxel causing the voxel density to decay at a rate PS (permeability-surface product) to pre-contrast levels. From the central volume theorem [67] blood volume (BV) can be calculated from (Eq. 2).
MTT BF
Figure 1: Johnson-Wilson impulse response function.
1A: A model two-compartment voxel with intravascular space (IV) and
extravascular space (EV). 1B: Impulse response function used in Wilson-Johnson
model, T0 is the arrival time of contrast, MTT is the mean transit time of a contrast
bolus through the voxel, BF is proportional to the blood flow through the voxel, BV
is proportional to the volume of blood in the voxel, E is the fraction of contrast that
extravasates into the EV during transit and PS is the exponential decay rate of
extravasated contrast agent.
1.3.3
Dual input modification of perfusion model
Both the hepatic artery and portal vein supply blood to the liver. The hepatic artery feeds oxygenated blood from the abdominal aorta and the portal vein drains nutrient rich blood from the gastrointestinal tract. The input function in the Johnson-Wilson model must be adjusted to account for dual blood supplies in a way that allows for the input to be
of total blood flow in voxel x that derives from the hepatic artery as well as HAI(t) which is the contrast enhancement curve of the hepatic artery and PVI(t) which is the contrast enhancement curve of the portal vein.
) ( )) ( 1 ( ) ( ) ( )
(t x HAI t x PVI t
I =α ⋅ + −α ⋅ (Eq. 3)
Replacing I(t) in (Eq. 1b) with (Eq. 3) generates the function to be minimized by iterating over the parameters of IRF(t,x). It is the parameters of the fitted model IRF that are plotted as perfusion maps. HAI(t) and PVI(t) are both determined from the CT images, HAI(t) by placing a region of interest on the abdominal aorta as a surrogate of the hepatic artery and PVI(t) by placing a region of interest on the portal vein.
1.3.4
Organ motion
Several studies have shown the liver may move 10-30 mm in the superior/inferior
direction during normal respiration and 0-10 mm in the anterior/posterior direction due to contraction and relaxation of the diaphragm [68, 69]. The movement is most severe at the dome of the liver near the diaphragm. The average adult relaxed respiration cycle has a period of about 4 seconds. To minimize streaking artifacts caused by movement of high contrast features in and out of the reconstruction volume image acquisition time should be no more than 0.5 seconds per volume. When using a CT scanner with low rotation speed, it is possible to utilize repeated breath holds to eliminate the possibility of
reconstruction artifacts. Registration would still be required after scanning to correct for poor reproducibility of lung volume between different breath holds.
Body shifts during scanning may introduce systematic rigid organ shifts that can be difficult to correct without using a rigid 3D registration method. To avoid this possibility patients should be instructed to remain still and in some cases abdominal straps may be required. When using couch shuttling the periodic motion of the couch may cause the patient to shift, particularly affecting obese patients. This can be mitigated with an abdominal strap.
1. Motion of portal vein: The dual input perfusion model is sensitively dependent on accurate contrast input curves – if a region can not be placed that includes only the portal vein in all image volumes the corresponding input curve will be incorrect, potentially leading to highly inaccurate perfusion estimates.
2. Tissue replacement: At organ boundaries or near smaller anatomical features such as blood vessels, calcifications, neoplasms or the gall bladder, a voxel may over time be occupied by several different tissue types. This can lead to inaccurate time-density curves, which can cause the optimization to generate perfusion values different from the actual values.
3. Reduction of field of view: Only the voxels included in every image volume can accurately be calculated. In the presence of motion voxels at the extreme superior and inferior edges of the image volumes will move in and out of the field of view during scanning.
Organ motion during DCE-CT acquisition must be minimized either by reducing motion during scanning or retrospectively through registration or image selection to reduce the probability and magnitude of artifactual perfusion values. In this thesis we describe and validate a retrospective method of reducing respiratory motion through image
registration.
1.3.5
Registration
To correct for respiratory motion in DCE-CT images, volumes acquired at the same couch position but at different times must be registered to account for patient respiration.
Registration of partial organ volumes presents a number of unique challenges, including the loss of volume conservation, small overlap between volumes and lack of
as possible, including bones, kidneys, spleen, stomach, small bowel and heart – the optimal method would perform full segmentation of the liver and then register the
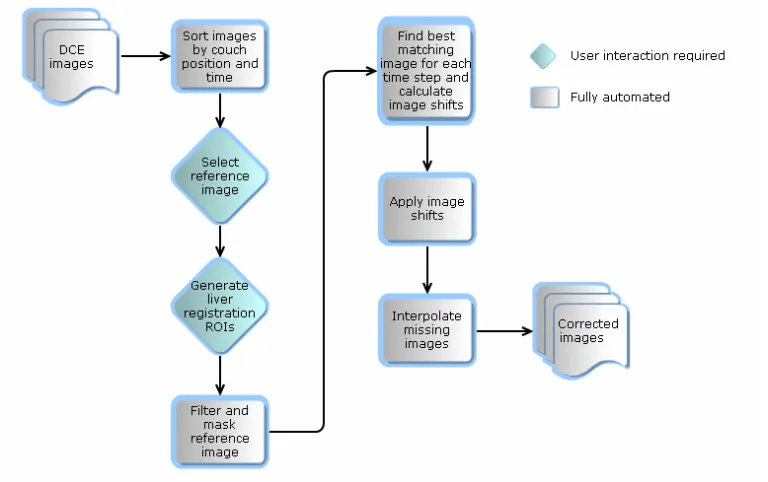
segmented volumes using a step wise process, first registering the segmented binary liver regions followed by registration including the intensity information in the liver to account for intra-hepatic features. Automatic segmentation of liver is a problem that has not yet been accurately solved for images with contrast enhancement. Due to changing contrast throughout the image series it was determined that automatic segmentation is not a viable option for motion correction of DCE-CT. The implemented registration algorithm uses manual selection of high contrast liver features. This is the only step of the registration that is not fully automated.
The user selected volumes are registered using cross-correlation maximization which was chosen for the registration algorithm presented in this thesis due to the efficiency of computation combined with the robustness to image noise and reconstruction artifacts compared to mutual information based registration algorithms. In chapter 2 the method is presented in more detail and tested for reproducibility, sensitivity to initial conditions and accuracy.
1.3.6
Filtering
Spatial and temporal filters can be used to reduce random noise in images. Spatial filtering employs different forms of averaging over local pixels to reduce local intensity fluctuations. This may lead to loss of highly localized signals. The potential loss of signal puts an emphasis on choosing the filter with optimal noise reduction and minimal risk of signal degradation for any given application.
Edge preservation is paramount when filtering images that require registration as registration is driven by tissue edges. Denoising filters that are typically used in that situation are anisotropic variable-size filters or median filters. Anisotropic variable-size filters use a traditional kernel such as a 2D Gaussian with variable and anisotropic standard deviations to avoid situations where the kernel would straddle a feature
fewer voxels around tissue boundaries as the kernel is reduced thus reducing the
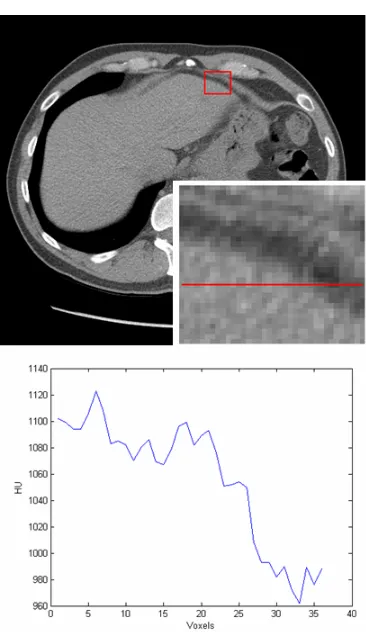
Figure 2: Example of median filtering.
On the left is shown a slice of a patient liver acquired with the DCE-CT protocol,
unfiltered. The inserted image shows a zoom of the area inside the red rectangle and
the plot shows an intensity profile along the red line in the insert. The part of the
profile from voxel 0-20 should have near constant HU as it is a homogenous region
of tissue, this is not the case without filtering due to reconstruction artifacts. On the
right is shown the same image after sequential median filtering with 3x3 and 5x5
filters with the same insert and line profile.
1.3.7
Signal to noise
estimated at around 20 mSv [70] compared to approximately 12-15 mSv [71] for abdominal tri-phasic contrast enhanced scans. Limiting this dose, and thereby the risk associated with it, is imperative. Signal-to-noise ratio (SNR) is the mean of a
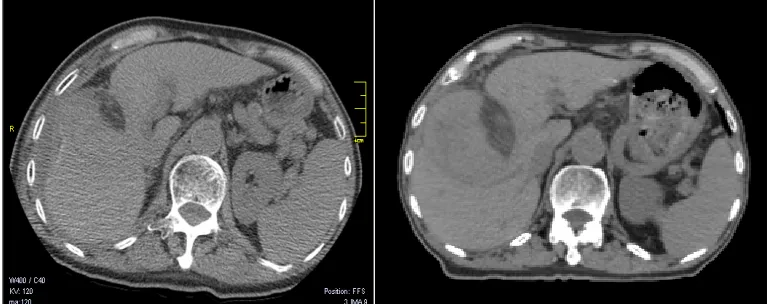
homogenous liver region of interest relative to the expectation value of water (ROI) divided by the standard deviation of that region (SNR=σµ). SNR in non-contrast enhanced images acquired with the clinical DCE-CT protocol ranged between 2 and 4 (Figure 3Error! Reference source not found.A). SNR in treatment planning 4D-CT was approximately 7(Figure 3B). Improved reconstruction and denoising algorithms such as iterative reconstruction and principal component analysis may increase SNR to improve image quality and allow further dose reduction.
Figure 3: DCE-CT and 4D-CT slices of same patient.
Left image (A) shows the DCE-CT slice at a time point prior to contrast arrival
compared to the 4D-CT slice on the right (B), the 4D-CT image clearly has a less
grainy appearance and more defined edges than the DCE-CT image.
The low SNR prevents reliable use of many fully automated image processing
high interpatient variability and time dependent contrast changes is reflected in the choices of algorithms utilized.
1.4
Radiotherapy
External beam radiotherapy is an option for palliative treatment of liver tumours. In the case of oligometastases [72] or solitary HCC [73], they would be treated with curative intent, giving doses upwards to 60 Gy in 6 fractions, equivalent to 70 Gy in 2 Gy per fraction. The radiation dose is limited by the risk of causing damage to the non-cancerous liver tissue or other toxicity to the patient. Radiotherapy can be split into two phases, the planning and the delivery, each with different challenges.
1.4.1
Planning
A radiotherapy plan is created on the basis of an image set featuring the organ to be treated as well as the surrounding healthy tissue to allow accurate dosimetric calculation and risk assessment. For liver cancer, contrast enhanced respiratory-tracked 4D-CT imaging is the most commonly used imaging modality for treatment planning. The radiation oncologist defines the clinical target volume (CTV) to be treated on the basis of pathology reports, radiology reading reports and the available information in the planning image set. The oncologist adds appropriate margins to create the planning target volume (PTV) which accounts for organ motion and inaccuracies in placing the patient on the treatment couch (typically between 3 and 7 mm). The oncologist prescribes a dose and treatment scheme. Healthy structures will be delineated for dosimetric purposes and a treatment plan will be created to comply with the prescribed dose and fractionation scheme, while sparing the adjacent healthy tissue to meet several organ-specific targets that have been derived such as maximum dose to the spinal cord and small bowel (limited to 50 and 47 Gy respectively) [74].
Radiation beam aperture shapes and beam weights are optimized using a commercial treatment planning system such as Pinnacle (Philips Healthcare, Best, The Netherlands) or Eclipse (Varian Medical Systems, Palo Alto, CA) in order to maximize dose
1.4.2
Alignment and treatment
On-line CT imaging is often employed to help reduce setup uncertainties to improve patient setup accuracy prior to treatment. A cone-beam CT source and detector is
attached to the treatment gantry and can acquire a CT of the relevant anatomical area that can be registered to the planning image.
To avoid giving excess imaging dose to healthy organs, cone-beam CT images are often acquired with relatively low x-ray tube voltage and current compared to diagnostic CT images. This combined with the slow rotation, and hence acquisition time, reduces the quality of images. Often the tumour is not well visualized in CBCT images and
registration is performed by aligning liver-lung boundary, bony structures or chest-wall as these structures have higher contrast and are easily visualized. Tumours located in the inferior part of the liver may be poorly aligned with the planned position by aligning only the abdominal diaphragm.
1.5
Implementation and validation of DCE-CT
motion correction
Key points for the registration algorithm developed in this thesis (chapter 2) were that it had to be able to register up to 80 independent image volumes in a timely manner, and had to be as automated as possible. The run time of the developed algorithm was compared to a similar approach relying strictly on manual registration, the automated algorithm was found to be able to perform registration in approximately 10-15 minutes compared to 1-3 hours for a comparable manual registration and validation.
Motion correction in this thesis is performed by strictly shifting images in the axial direction. The registration algorithm does not account for motion in the anterior/posterior direction nor deformation of the liver in different phases of the respiratory cycle. The majority of liver motion during normal respiration is along the axial direction and in the interest of computational efficiency and impact, 1D registration was chosen over 3D approaches. User feature selection for registration may decrease reproducibility and introduce interobserver variation if features are not chosen following provided guidelines.
Registration can be simplified by segmenting the liver, thus excluding all other tissue. Several automated segmentation algorithms were tested during implementation of the CTP motion correction algorithm presented in chapter 2. None were employed further, as performance testing favoured the regional intensity based method. These segmentation algorithms include:
1. Confidence connected segmentation. Implemented from the Matlab wrapper of ITK [75], segmentation is performed using a seed point and growing a region around the seed point by including 6-connected voxels with intensities within a predefined deviation from the intensity of seed. The segmentation is then updated by iteratively calculating the standard deviation and mean of the current
segmentation and including all 6-connected voxels that fall within µ±α⋅σ where
α is a predefined constant (around 2.5) this iteration is continued until no new voxels are included.
2. Model based level-set segmentation. A patient specific liver-model was created by generating the temporal average image of the unregistered CTP volumes and segmenting the liver using confidence connected segmentation. A level-set optimization was implemented in Matlab following the methodology of Chen and Radke [76] without a volume conserving term as organ volume can not be
the binary volume did not seem to improve results enough compared to 1D segmentation.
3. Edge detection using Canny and Laplacian of Gaussian (LoG) approaches. Segmentation using edge detection filters is known to be computationally efficient. Canny and LoG filters identify the steepest gradients, the main
difference being Canny filters do not provide closed shapes while LoG does. Due to the low signal-to-noise ratio in CTP image volumes edge detection was not able to reliably segment the liver from surrounding soft tissue.
Registration of binary volumes from segmented liver organ was attempted by registering the center of masses and then minimizing the sum of squared differences between
volumes using constrained minimization included in the Matlab optimization toolbox (fmincon) with 3 shift directions and 3 rotational angles as optimization parameters, each limited to anatomically relevant values (±3 cm for superior-inferior motion, ±1 cm for anterior-posterior and lateral motion, ±10o for all three rotations). The registration parameters were then applied to the registration volume and the same optimization was repeated this time with the image intensities multiplied onto the binary volumes and the constraints reduced to ±0.25 cm for superior-inferior motion, ±0.1 cm for anterior-posterior and lateral motion, ±2o for all three rotations. This multiphase approach was found to be computationally too intense and too sensitive to changes in the segmentation and generation of binary masks.
Deformable registration is often considered a better solution than rigid registration. However, due to the poor reproducibility, long computation time and intensive quality control effort required to verify deformable registration, rigid registration was
Demons deformable 3D registration algorithm [77] implemented in ITK as well as Analyze was investigated as a method to correct motion. It was rejected due to lack of reproducibility and several cases of misregistration in cases with large superior-inferior shifts between registration volumes.
1.6
Objectives and outline
1.6.1
Hypothesis
I hypothesize that respiratory motion correction perfusion imaging has the potential to improve radiotherapy treatment of liver cancer, both primary and metastatic, by
providing superior contrast between tumour and normal tissue and by providing patient specific tracer kinetics which can be applied to improve patient alignment for therapy and that retrospective 1D image registration is a fast and efficient motion correction strategy with the benefit of allowing improvement in field of view through couch shuttling and reducing patient discomfort and setup time.
1.6.2
Research objectives
The primary objective of this thesis was to implement, validate and apply an automated and fast registration algorithm to correct for respiratory motion in dynamic contrast enhanced CT images of the liver and to elucidate the value of perfusion CT of the liver for radiotherapy target delineation of primary and metastatic intrahepatic tumours.
1. The first objective of this thesis was to implement an automatic registration algorithm to correct for respiratory motion of the liver in dynamic contrast enhanced CT images and validate the registration method in phantom, virtual phantom and animal studies and against manual registration in human studies. 2. The second objective was to apply the registration method to patient scans to
determine the value of registration as retrospective correction for motion correction. Tumour and normal tissue perfusion values in 30 human subjects were determined and compared to previously published values.
acquired within 2 weeks of the clinical planning CT were registered to the planning CT and three observers (2 radiation oncologists and 1 radiotherapist) were asked delineate clinical target volumes on all three image sets for 15 patients and compare interobserver variability.
4. The final objective was to investigate the possibility of using contrast enhanced cone-beam CT for improved tumour alignment with planned position during image guided radiotherapy and to optimize contrast injection protocol through simulation by modeling contrast kinetics using the dual compartment perfusion model previously described. Contrast enhanced CBCT was performed in two New Zealand white rabbits and simulated contrast enhanced CBCT images were generated.
1.6.3
Thesis outline
1.6.3.1
Chapter 2: Hepatic CT perfusion with semi-automatic
retrospective respiratory motion correction: implementation
and validation
This chapter contains a description of the registration algorithm including implementation details and results of phantom studies with known motion patterns. Validation of the motion correction algorithm was performed against a simulated breath-hold image acquisition technique in animal studies and against manual registration of patient scans. The chapter is based on the paper titled “Hepatic CT perfusion with semi-automatic retrospective respiratory motion correction: implementation and validation”, submitted for publication to the journal Medical Physics January 2013 by NKG Jensen, A Lausch, M Lock, B Fisher, R Kozak, J Chen, TY Lee and E Wong.
1.6.3.2
Chapter 3: Prediction and reduction of motion artifacts in
free breathing dynamic contrast enhanced CT perfusion
imaging of primary and metastatic intrahepatic tumours
functional values in patient scans calculated with and without motion correction. This chapter is based on the paper titled “Prediction and Reduction of Motion Artifacts in Free Breathing Dynamic Contrast Enhanced CT Perfusion Imaging of Primary and Metastatic Intrahepatic Tumours” published in the journal Academic Radiology, volume 20 (4) in April 2013 by NKG Jensen, M Lock, B Fisher, R Kozak, X Chen, J chen, E Wong, TY Lee.
1.6.3.3
Chapter 4: Dynamic contrast enhanced CT aiding gross
tumour volume delineation of liver cancers: an
interobserver variability study
Functional imaging such as Fluorodeoxyglucose – positron emission tomography (FDG-PET) has been shown to decrease interobserver variability in clinical target volume delineation for radiotherapy in several types of cancer. Highly accurate functional nuclear imaging of the liver is made difficult by the liver’s function as a filtering gland, meaning normal liver tissue has very high uptake of most radiotracers, and the combination of liver motion and long acquisition time. In this chapter the possible benefits of integrating perfusion CT imaging into radiotherapy treatment planning was investigated by having 3 observers generate clinical target volumes based on perfusion information and comparing these volumes to some defined on traditional contrast enhanced 4D-CT currently used clinically. This chapter is based on the paper “Dynamic contrast enhanced CT aiding gross tumour volume delineation of liver cancers: an interobserver variability study” submitted for publication in the journal Radiotherapy and Oncology in October 2012 by NKG Jensen, D Mulder, M Lock, B Fisher, R Kozak, J Chen, TY Lee, E Wong.
1.6.3.4
Chapter 5: Contrast enhanced cone-beam CT improves
tumour alignment in image guided radiotherapy of liver
tumours
Due to image artifacts and poor soft-tissue contrast, image guided radiotherapy of liver cancer patients is often performed by aligning the liver-lung boundary and bony
during acquisition of cone-beam CT is investigated in a rabbit model as well as simulation of cone-beam CT images by modeling contrast kinetics.
1.7
References
1. Richardson PD, Withrington PG (1981) Liver blood flow. I. intrinsic and nervous control of liver blood flow. Gastroenterology 81:159-173.
2. Schenk WG,Jr, McDonald JC, McDonald K, Drapanas T (1962) Direct measurement of hepatic blood flow in surgical patients: With related observations on hepatic flow dynamics in experimental animals. Ann Surg 156:463-471.
3. Brosnan M, Brosnan J (2007) Protein and amino acid metabolism. In: Rodes J, Benhamon J, Blei A, Reichen J, Rizzetto M (eds). Hepatology: From Basic Science to Clinical Practice, 3rd edn. Blackwell Publishing, pp 142-149.
4. Scapa E, Kanno K, Cohen D (2007) Lipoprotein metabolism. In: Rodes J, Benhamon J, Blei A, Reichen J, Rizzetto M (eds). Hepatology: From Basic Science to Clinical Practice, 3rd edn. Blackwell Publishing, pp 133-142.
5. Boden G (2007) Carbohydrates and the liver. In: Rodes J, Benhamon J, Blei A,
Reichen J, Rizzetto M (eds). Hepatology: From Basic Science to Clinical Practice, 3rd edn. Blackwell Publishing, pp 129-133.
6. Tenhunen R, Marver HS, Schmid R (1968) The enzymatic conversion of heme to bilirubin by microsomal heme oxygenase. Proc Natl Acad Sci U S A 61:748-755. 7. Wagner M, Trauner M (2007) Physiology of bile formation. In: Rodes J, Benhamon J, Blei A, Reichen J, Rizzetto M (eds). Hepatology: From Basic Science to Clinical Practice, 3rd edn. Blackwell Publishing, pp 290-303.
8. Rockey D, Friedman S (2012) Hepatic fibrosis and cirrhosis. In: Boyer T, Manns M, Sanyal A (eds). Zakim and Boyer's Hepatology, 6th edn. Saunders Elsevier, pp 64-85.
9. Diehl AM (1989) Alcoholic liver disease. Med Clin North Am 73:815-830. 10. Anonymous (2012) WHO hepatitis B fact sheet. 204.
11. Fattovich G, Stroffolini T, Zagni I, Donato F (2004) Hepatocellular carcinoma in cirrhosis: Incidence and risk factors. Gastroenterology 127:S35-50.
12. Yeh F, Yu MC, Mo C, Luo S, Tong MJ, Henderson BE (1989) Hepatitis B virus, aflatoxins, and hepatocellular carcinoma in southern guangxi, china. Cancer Research 49:2506-2509.
14. Liang TJ, Heller T (2004) Pathogenesis of hepatitis C—associated hepatocellular carcinoma. Gastroenterology 127:S62-S71.
15. Geraci JP, Mariano MS (1993) Radiation hepatology of the rat: Parenchymal and nonparenchymal cell injury. Radiat Res 136:205-213.
16. Bosch FX, Ribes J, Diaz M, Cleries R (2004) Primary liver cancer: Worldwide incidence and trends. Gastroenterology 127:S5-S16.
17. el-Serag HB (2001) Epidemiology of hepatocellular carcinoma. Clin Liver Dis 5:87-107, vi.
18. Altekruse SF, McGlynn KA, Reichman ME (2009) Hepatocellular carcinoma
incidence, mortality, and survival trends in the united states from 1975 to 2005. J Clin Oncol 27:1485-1491.
19. Bruix J, Sherman M, Practice Guidelines Committee, American Association for the Study of Liver Diseases (2005) Management of hepatocellular carcinoma. Hepatology 42:1208-1236.
20. La Vecchia C (2007) Alcohol and liver cancer. Eur J Cancer Prev 16:495-497. 21. Liu Y, Wu F (2010) Global burden of aflatoxin-induced hepatocellular carcinoma: A
risk assessment. Environ Health Perspect 118:818-824.
22. Libbrecht L, Severi T, Cassiman D et al (2006) Glypican-3 expression distinguishes small hepatocellular carcinomas from cirrhosis, dysplastic nodules, and focal nodular hyperplasia-like nodules. Am J Surg Pathol 30:1405-1411.
23. Marrero JA, Feng Z, Wang Y et al (2009) Alpha-fetoprotein, des-gamma
carboxyprothrombin, and lectin-bound alpha-fetoprotein in early hepatocellular carcinoma. Gastroenterology 137:110-118.
24. Marrero J (2012) Hepatocellular carcinoma. In: Boyer T, Manns M, Sanyal A (eds). Zakim and Boyer's Hepatology, 6th edn. Saunders Elsevier, pp 1005-1031. 25. Welzel TM, McGlynn KA, Hsing AW, O'Brien TR, Pfeiffer RM (2006) Impact of
classification of hilar cholangiocarcinomas (klatskin tumours) on the incidence of intra- and extrahepatic cholangiocarcinoma in the united states. J Natl Cancer Inst 98:873-875.
26. Khan SA, Toledano MB, Taylor-Robinson SD (2008) Epidemiology, risk factors, and pathogenesis of cholangiocarcinoma. HPB (Oxford) 10:77-82.
27. Lazaridis K, Gores G (2012) Clogangiocarcinoma. In: Boyer T, Manns M, Sanyal A (eds). Zakim and Boyer's Hepatology, 6th edn. Saunders Elsevier, pp 1032-1044. 28. CRAIG J (1989) Tumours of the liver and intrahepatic bile ducts. Atlas of tumour
pathology.
30. Mazzaferro V, Regalia E, Doci R et al (1996) Liver transplantation for the treatment of small hepatocellular carcinomas in patients with cirrhosis. N Engl J Med 334:693-700.
31. Belghiti J, Kianmanesh R (2005) Surgical treatment of hepatocellular carcinoma. HPB (Oxford) 7:42-49.
32. Patterson EJ, Scudamore CH, Owen DA, Nagy AG, Buczkowski AK (1998) Radiofrequency ablation of porcine liver in vivo: Effects of blood flow and treatment time on lesion size. Ann Surg 227:559-565.
33. Rossi S, Di Stasi M, Buscarini E et al (1996) Percutaneous RF interstitial thermal ablation in the treatment of hepatic cancer. AJR Am J Roentgenol 167:759-768. 34. Francica G, Marone G (1999) Ultrasound-guided percutaneous treatment of
hepatocellular carcinoma by radiofrequency hyperthermia with a 'cooled-tip needle'. A preliminary clinical experience. Eur J Ultrasound 9:145-153. 35. Rossi S, Buscarini E, Garbagnati F et al (1998) Percutaneous treatment of small
hepatic tumours by an expandable RF needle electrode. AJR Am J Roentgenol 170:1015-1022.
36. Solbiati L, Goldberg SN, Ierace T et al (1997) Hepatic metastases: Percutaneous radio-frequency ablation with cooled-tip electrodes. Radiology 205:367-373. 37. Jelic S, Sotiropoulos GC, On behalf of the ESMO Guidelines Working Group (2010)
Hepatocellular carcinoma: ESMO clinical practice guidelines for diagnosis, treatment and follow-up. Annals of Oncology 21:v59-v64.
38. Salem R, Lewandowski RJ, Mulcahy MF et al (2010) Radioembolization for
hepatocellular carcinoma using yttrium-90 microspheres: A comprehensive report of long-term outcomes. Gastroenterology 138:52-64.
39. Abou-Alfa GK, Johnson P, Knox JJ et al (2010) Doxorubicin plus sorafenib vs doxorubicin alone in patients with advanced hepatocellular carcinoma: A randomized trial. JAMA 304:2154-2160.
40. Takeda A, Takahashi M, Kunieda E et al (2008) Hypofractionated stereotactic radiotherapy with and without transarterial chemoembolization for small hepatocellular carcinoma not eligible for other ablation therapies: Preliminary results for efficacy and toxicity. Hepatol Res 38:60-69.
41. Hof H, Rhein B, Haering P, Kopp-Schneider A, Debus J, Herfarth K (2009) 4D-CT-based target volume definition in stereotactic radiotherapy of lung tumours: Comparison with a conventional technique using individual margins. Radiother Oncol 93:419-423.
42. Rietzel E, Pan T, Chen GT (2005) Four-dimensional computed tomography: Image formation and clinical protocol. Med Phys 32:874-889.
44. Rosenkrantz AB, Lee L, Matza BW, Kim S (2012) Infiltrative hepatocellular carcinoma: Comparison of MRI sequences for lesion conspicuity. Clin Radiol. 67:e105-111.
45. Wu LM, Hu J, Gu HY, Hua J, Xu JR (2012) Can diffusion-weighted magnetic resonance imaging (DW-MRI) alone be used as a reliable sequence for the preoperative detection and characterisation of hepatic metastases? A meta-analysis. Eur J Cancer. 49:572-84.
46. Koh TS, Thng CH, Lee PS et al (2008) Hepatic metastases: In vivo assessment of perfusion parameters at dynamic contrast-enhanced MR imaging with dual-input two-compartment tracer kinetics Model1. Radiology 249:307-320.
47. Wu HB, Wang QS, Li BY, Li HS, Zhou WL, Wang QY (2011) F-18 FDG in conjunction with 11C-choline PET/CT in the diagnosis of hepatocellular carcinoma. Clin Nucl Med 36:1092-1097.
48. Park JW, Kim JH, Kim SK et al (2008) A prospective evaluation of 18F-FDG and 11C-acetate PET/CT for detection of primary and metastatic hepatocellular carcinoma. J Nucl Med 49:1912-1921.
49. Yoshimoto M, Waki A, Yonekura Y et al (2001) Characterization of acetate
metabolism in tumour cells in relation to cell proliferation: Acetate metabolism in tumour cells. Nucl Med Biol 28:117-122.
50. Ho CL, Cheung MK, Chen S et al (2012) 18F]fluoroacetate positron emission
tomography for hepatocellular carcinoma and metastases: An alternative tracer for [11C]acetate? Mol Imaging 11:229-239.
51. Ho YJ, Jeng LB, Yang MD, Kao CH, Lin CC, Lee CC (2003) A trial of single photon emission computed tomography of the liver with technetium-99m tetrofosmin to detect hepatocellular carcinoma. Anticancer Res 23:1743-1746.
52. Saito K, Koizumi K, Abe K, Goto Y, Seki T (1998) Potential for qualitative diagnosis of tumours and tumourous lesions in the liver with tc-99m-GSA
SPECT--correlation with pathological evaluation and MRI findings. Ann Nucl Med 12:275-280.
53. Fukushima K, Kono M, Ishii K, Sakai E, Hirota S, Yuri H (1997) Technetium-99m methoxyisobutylisonitrile single-photon emission tomography in hepatocellular carcinoma. Eur J Nucl Med 24:1426-1428.
54. Davide Ippolito, Sandro Sironi, Massimo Pozzi et al (2008) Hepatocellular carcinoma in cirrhotic liver disease: Functional computed tomography with perfusion
imaging in the assessment of tumour vascularization. Acad Radiol 15:919-927. 55. Ippolito D, Bonaffini PA, Ratti L et al (2010) Hepatocellular carcinoma treated with
transarterial chemoembolization: Dynamic perfusion-CT in the assessment of residual tumour. World J Gastroenterol 16:5993-6000.
57. Guyennon A, Mihaila M, Palma J, Lombard-Bohas C, Chayvialle JA, Pilleul F (2010) Perfusion characterization of liver metastases from endocrine tumours: Computed tomography perfusion. World J Radiol 2:449-454.
58. Yang ,Han, Du ,Yong, Ni ,Jia et al (2010) Perfusion computed tomography evaluation of angiogenesis in liver cancer. Eur Radiol:1424-1430.
59. Youn SW, Kim JH, Weon Y, Kim SH, Han M, Bae H (2008) Perfusion CT of the brain using 40-mm-wide detector and toggling table technique for initial imaging of acute stroke. American Journal of Roentgenology 191:W120-W126.
60. Stewart EE, Chen X, Hadway J, Lee T (2006) Correlation between hepatic tumour blood flow and glucose utilization in a rabbit liver tumour model. Radiology 239:740-750.
61. Stewart EE, Chen X, Hadway J, Lee T (2008) Hepatic perfusion in a tumour model using DCE-CT: An accuracy and precision study. Phys Med Biol 53:4249-4267. 62. Ng CS, Chandler AG, Wei W et al (2011) Reproducibility of CT perfusion
parameters in liver tumours and normal liver. Radiology 260:762-770.
63. Goetti R, Leschka S, Desbiolles L et al (2010) Quantitative computed tomography liver perfusion imaging using dynamic spiral scanning with variable pitch: Feasibility and initial results in patients with cancer metastases. Invest Radiol 45:419-426.
64. Johnson J, Wilson T (1966) A model for capillary exchange. American Journal of Physiology -- Legacy Content 210:1299-1303.
65. Miles KA (1991) Measurement of tissue perfusion by dynamic computed tomography. British Journal of Radiology 64:409-412.
66. St. Lawrence K,S., Lee T (1998) An adiabatic approximation to the tissue
homogeneity model for water exchange in the brain: I. theoretical derivation. J Cereb Blood Flow Metab 18:1365-1377.
67. Stewart GN (1893) Researches on the circulation time in organs and on the influences which affect it: Parts I.-III. J Physiol 15:1-89.
68. Davies SC, Hill AL, Holmes RB, Halliwell M, Jackson PC (1994) Ultrasound quantitation of respiratory organ motion in the upper abdomen. British Journal of Radiology 67:1096-1102.
69. Rohlfing T, Maurer J,Calvin R., O'Dell WG, Zhong J (2004) Modeling liver motion and deformation during the respiratory cycle using intensity-based nonrigid registration of gated MR images. Med Phys 31:427-432.
70. Lee TY, Purdie TG, Stewart E (2003) CT imaging of angiogenesis. Q J Nucl Med 47:171-187.
71. Shrimpton P, Hillier M, Lewis M, Dunn M (2005) Doses from computed tomography (CT) examinations in the UK – 2003 review. Chilton.
73. Ibarra RA, Rojas D, Snyder L et al (2012) Multicenter results of stereotactic body radiotherapy (SBRT) for non-resectable primary liver tumours. Acta Oncol 51:575-583.
74. Pan CC, Kavanagh BD, Dawson LA et al (2010) Radiation-associated liver injury. Int J Radiat Oncol Biol Phys 76:S94-S100.
75. Chu V, Hamarneh G (2005) MATITK: Extending matlab with ITK. Insight. 76. Siqi Chen, Radke RJ (2009) Level set segmentation with both shape and intensity
priors. Computer Vision, 2009 IEEE 12th International Conference on:763-770. 77. Nithiananthan S, Brock KK, Daly MJ, Chan H, Irish JC, Siewerdsen JH (2009)