1
Analysis of the Spatial and Temporal Distribution of the 2011 Earthquakes in Lake
1
Van Area and Rupture Complexity of the Aftershock Sequence in Eastern Anatolia,
2
Turkey
3
Mustafa Toker: 1. University of Oulu, Sodankylä Geophysical Observatory, Laboratory of 4
Applied Seismology, POB 3000, FIN-90014, Oulu/Finland 5
2. Yuzuncu Yıl University, Department of Geophysical Engineering, Zeve Campus, 65080, 6
Van/Turkey, [email protected] 7
8 9 10 11 12 13 14 15
Corresponding Author: 16
Dr. Mustafa Toker 17
Yüzüncü Yıl University, Department of Geophysical Engineering, Zeve Campus, Van, Turkey 18
Phone: +90-(0) 543-624-7503 19
Fax: +90-(0) 422-273-3756 20
E-mail: [email protected] 21
2
Abstract
22
This study presents an analysis of the spatial and temporal distribution of the two large 23
destructive earthquakes that occurred in Lake Van area on October 23, and November 9, 2011, 24
together with the azimuth-dependent distribution of the seismic activity and microseismicity 25
clusters after the mainshocks, associated with the complex rupture processes of their aftershock 26
sequence. The sequence began with the magnitude Mw 7.1 earthquake of 23 October and a 27
second destructive earthquake of Mw 5.6. The aftershock sequences of the two mainshocks were 28
linked to the local crustal faults beneath Lake Van area, followed successively and produced 29
unusually intense activity and significant damage in the area. The main purposes of this study are 30
to document the spatial and temporal distribution and evolution of the October 23, 2011 31
aftershock hypocenters and the azimuth-dependent distribution of seismic activity, and to 32
understand the spatial and temporal character of the aftershock sequence using the distributional 33
and evolutional patterns of the aftershock hypocenters. A total of 10,000 aftershocks were 34
obtained from seismic data with a high signal-to-noise ratio over collected over three years from 35
October 23, 2011 to March 2014. These aftershocks were plotted for the time periods from 36
November 2011 through March 2012 to March 2014 and ≈ 5000 aftershocks were retained in the 37
depth versus distance cross-sections to detect the clusters in the first step of study (November 38
2011-March 2012). The focal depth distribution of the aftershock clusters, the migration of 39
hypocenter activity and microseismicity clusters were analyzed and the distributional patterns of 40
the detected clusters were assessed using the geometric distribution of the aftershock 41
hypocenters. The spatial and temporal distribution of aftershocks reveal interesting key features 42
of the deep rupture complexity of the Van earthquake: (1) most prominent aftershocks have been 43
3 the upper crust is brittle and seismogenic; (2) two spatial clusters have been detected at 8-10 km 45
depths and the upward extrapolation of these clusters intersects with faults; the main cluster (60 46
km wide) bounded by inferred reverse faults (f3 and f4) and the central cluster (25-30 km wide) 47
bounded by faults (f1 and f2); (3) these spatial clusters form the largest volumetric pattern of the 48
conical-shaped cluster at depths of about 25-30 km of the azimuth-dependent rotational 49
projections, suggesting azimuthal distributions of deep rupture characteristics; and (4) the 50
strongest temporal cluster of microseismicity derived from temporal distribution of aftershocks 51
has been detected within an area of about 2.5-3.0 km2 and it is spatially observed at 20 km depth 52
within the central cluster, suggesting progressive failure of the adjacent patches of possible fault. 53
Keywords: Lake Van, Van earthquake, aftershock hypocenters, rupture complexity, azimuthal 54
distribution, aftershock clusters, microseismicity 55
56
57
58
59
60
61
4
1. Introduction
63
During the last ten years, seismological observations of aftershock seismicity from the interplate 64
and intraplate seismotectonic settings and magnitudes have indicated that variations in stress state 65
less than 1 bar are able to induce the reactivation of nearby faults that are close to failure, either 66
as long-term post-seismic deformation (e.g., spatial and temporal occurrence of aftershock 67
activity) or as secondary larger earthquakes (e.g., compound seismicity). This phenomenon has 68
been described as a triggering process (King et al. 1994; Harris et al. 1995; Benito et al. 2004). 69
The triggering process may involve the anomalous generation of aftershocks or secondary 70
mainshocks with different focal mechanisms, with prominent changes in the spatial and temporal 71
character of the mainshock aftershock sequence in a given focal area which increases or 72
decreases for several months or years after a mainshock (Stein and Lisowski 1983; Reasenberg 73
and Simpson 1992; Stein 1999; Benito et al. 2004). 74
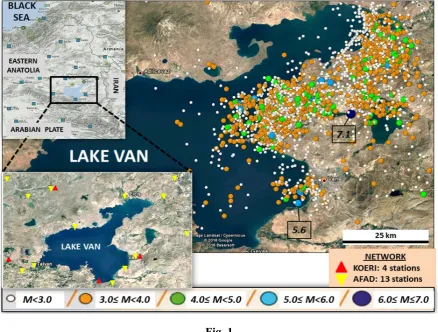
Lake Van located in the province of Van in eastern Anatolia is characterized by intraplate 75
seismicity and highly active compressional shear strains (Kutoğlu et al. 2016) with long-term 76
aftershocks of magnitudes more than 3.5-4.0 occurring repeatedly (Toker 2013; 2014) (Figure 1). 77
Toker (2014; 2015) has shown that these aftershock events in the temporal form of multi-78
clusteral patterns are repeating ruptures of asperities comprising areas of large coseismic slip, 79
which are locked during interseismic period. On October 23, 2011, a great thrust earthquake of 80
magnitude Mw 7.1 occurred in the Lake Van area (Irmak et al. 2012; Bayrak et al. 2013; Elliott et 81
al. 2013; Moro et al. 2014; Toker 2015) (Figure 1). The earthquake and its strong aftershocks 82
activated the ~ 27-km-long Blind Thrust fault system that marks the accretionary wedge complex 83
5 Karakaş 2013; Karakaş et al. 2013; Elliott et al. 2013; Doğan et al. 2014). The multi-crustal 85
occurrence and distribution of long-period aftershock activity and focal mechanism of this larger 86
event show a northeast–southwest striking rupture plane dipping towards the northwest (Irmak et 87
al. 2012; Toker 2013; Utkucu et al. 2013; Fielding et al. 2013; Bayrak et al. 2013) (Figure 2). The 88
rupture gradually expanded near the hypocenter and was shaped in a sigmoidal-like propagation 89
(Figure 2). It is thought that the earthquake occurred as a result of a long-term high plateau uplift 90
(Görür et al. 2015) and an eastward oblique tectonic extrusion of the Lake Van basin (Toker and 91
Şengör 2011; Toker and Ecevitoğlu 2012a, b). 92
The October 23, 2011 Van earthquake was a somewhat unusual case concerning the anomalous 93
occurrence and the spatial and temporal distribution of its aftershocks (M ≥ 4.0) in Lake Van 94
(Figures 2 and 3). The Van earthquake was followed by numerous aftershocks with the same 95
origin and most of the aftershock activity was restricted to a narrow area, bounded by the faults 96
of the lake (Figures 1 and 2); ~2,828 events occurred in the first month (November 2011), and 97
4,853 in the first five months (November 2011- March 2012), nearly half of which were larger 98
than Mw 2.5-3.0 (Figure 3b). Until the end of 13 April 2012 over a period of 163 days, the total 99
activity of 5,304 aftershocks comprised of 184 Mw ≥ 4.0 and 13 Mw ≥ 5.0 events (Bayrak et al. 100
2013; Toker 2014). This earthquake was associated with the local fault system aligned with the 101
Lake Van basin that extends from west to east (Figures 1 and 2) (Moro et al. 2014). Two weeks 102
later, on 9 November, a second major earthquake of Mw 5.6, the Edremit event (5-7 km depths), 103
occurred the near the southeastern coast of Lake Van along the north dipping a normal oblique-104
strike-slip Edremit fault (Utkucu 2013; Utkucu et al. 2013; Doğan et al. 2014) (Figure 2). This 105
second earthquake was also associated with the local fault system (Ketin 1977; Utkucu 2006). 106
6 that it occurred on a different fault (Figure 2). The aftershock sequence of the November 9, 2011 108
Edremit earthquake worsened the situation in the area that had been affected by the previous Van 109
earthquake. The epicenter locations and the fault focal solutions of these earthquakes indicate that 110
they occurred on different fault systems (Figure 2). 111
The two mainshocks of October 23 and November 9, together with thousands of events of lesser 112
magnitude and their respective aftershock sequences, produced an intense period of intraplate 113
seismic activity over a short time interval. This seismic activity did not appear to decrease over 114
time and frequency, according to the known laws. The temporal propagation and evolution of the 115
Van aftershock sequence showed a complex short and long term dynamic evolution in the 116
aftershock area (Toker 2013; 2014; 2015). This is repeated for all the events, and may have 117
induced alternating stress increases and decreases in either time or space, thus generating the 118
observed clusters, declusters and dynamic complexity in the aftershock sequence (Toker 2015). If 119
this is the case, the rupture area of the Van mainshock ruptures repeatedly in the consecutive 120
aftershocks and it is extremely important to reveal aftershock hypocenters of the mainshock in 121
order to understand the focal depth nature of the rupture complexity. This suggests that the 122
present probability of the repeated aftershock occurrence (Mw ≥ 4.0-4.5) in the mainshock area is 123
quite high. 124
Soon after the Van earthquake, many geologists undertook field investigations of the surface 125
ruptures and co-seismic deformation (Irmak et al. 2012; Koçyiğit 2012; Doğan and Karakaş 126
2013; Karakaş et al. 2013; Doğan et al. 2014). However, because of the occurrence of seismic-127
related surface ruptures, mass-wasting and landslides in the fields along the faults, the field 128
7 distribution of the ruptured area. Geophysical studies were also inadequate for determining the 130
spatial and temporal details of the aftershock clusters around the hypocenter of the mainshock 131
(Utkucu et al. 2013; Bayrak et al. 2013; Fielding et al. 2013; Elliott et al. 2013; Moro et al. 2014). 132
Furthermore, the land-based observations that were conducted were insufficient to describe the 133
overall rupture geometry and the detailed hypocenter activity (Utkucu 2013; Kalafat et al. 2013; 134
Altıner et al. 2013). Prior to the present study, little was known about the focal depth nature of 135
aftershock seismicity at crustal depths. 136
Since the aftershocks following the Van and Edremit mainshocks occurred in larger numbers, 137
they can assist in delineating the focal depth pattern of the rupture upon which the Van 138
mainshock occurred and clarify the spatial and temporal distribution of the seismicity around the 139
focal area. This paper explores the spatial and temporal distribution of the aftershock sequences 140
in the Lake Van area to gain a better understanding of the hypocenter dynamics of aftershock 141
sequence. Moreover, the current study analyzes the focal depth features of aftershocks beneath 142
the surface based on aftershock observations and comments on rupture complexity of aftershock
143
sequence, and contributes to the investigation of the distributional configurations of the 144
hypocenters on the scale of a few tens of kilometers. This paper presents the results of the first 145
detailed hypocentral observations and this is important data for future seismic hazard analyses in 146
the area. 147
2. Data and Method
148
The earthquake catalogues published by AFAD (2011-2014) (Republic of Turkey Prime Ministry 149
Disaster and Emergency Management Authority) ((http://www.afad.gov.tr/ and 150
8 Kandilli Observatory and Earthquake Research Institute)
152
(http://www.koeri.boun.edu.tr/scripts/Sondepremler.asp) were used in the present study to plot 153
the distribution of aftershocks and to propose a location uncertainty. This study used the routine 154
procedure of the hypocenter location method given in the KOERI catalogue. The earthquake data 155
set was manually analyzed using ZsacWin program of Yılmazer, (2003) developed at KOERI. 156
The ZsacWin program is based on Hypo71 location software (Lee and Lahr 1972; Lee and 157
Valdes, 1985) with 1-D crustal velocity models derived by Kalafat et al. (1987) for the 158
hypocenter determination (further details are given in Appendix A). 159
AFAD operates 13 permanent broadband seismic stations equipped with high-gain seismometers 160
around Lake Van and provides real-time data through on-line and dial-up stations. After the Van 161
earthquake, 4 permanent broadband seismic stations were installed and operated by KOERI 162
around Lake Van to record and locate the aftershock sequence (total 17 stations in Figure 1).It is 163
possible to obtain reliable and acceptable focal depth solutions for any area of Turkey from 164
earthquake data recorded at the digital broadband stations operated by the AFAD and KOERI 165
using conventional and also inversion techniques. 166
The location uncertainty of routinely analyzed focal depths puts limits on the fine seismicity 167
structure of the ruptured area. The use of a 1-D reference velocity models (Kalafat et al. 1987) to 168
locate the focal depths limits the location accuracy due to systematic biases introduced by 3-D 169
velocity variations. Several factors, such as the overall geometry of station network, arrival-times 170
reading accuracy with available phases, and the crustal structure of the region, control the 171
9 velocity models can minimize the relative location uncertainties by controlling the accuracy of 173
the relative arrival-time readings or selecting the high-quality events and the focal depths. 174
2.1AFAD-KOERI joint catalogue
175
In this study, the catalogues from AFAD and KOERI networks (Fig. 1) have been merged in for 176
quality check of the selected data. KOERI stations in the study area are not good enough to locate 177
their own events. Hence, data (e.g., phase picks, phase readings and residuals) from nearby 178
stations of KOERI network (see Appendix A) has been added to AFAD network to increase the 179
resolution, to improve the location quality and also to compare the residuals. KOERI and AFAD 180
networks have the schemes for automatically detecting events available for processing and 181
working with the continuous data. These networks also provide arrival times and make 182
corresponding hypocenter locations quite reliable for network well configured relative to the 183
events (Fig. 1) (see Appendix B). The catalogues of AFAD and KOERI are well performed to 184
improve the data quality and the depth resolution of the events given in the catalogues is refined. 185
An important task here is to check phase picks and phase identifications to find possible large 186
residuals from the different stations. 187
The hypocentral locations are the point with the best agreement between the observed and 188
calculated times which means the root mean squared residual RMS given in location program and 189
used as a guide to location accuracy and a criterion for “goodness of fit”. The RMS depending on 190
the number of stations used in our study is reported by DDA catalogue of AFAD 191
(http://www.deprem.gov.tr/en/ddacatalogue). DDA catalogue also has some scheme for 192
weighting out large residuals. The point with the lowest RMS is assigned as the “solution” for 193
10 RMS gives the approximate average residual. We assume that the residuals caused by the crustal 195
complexity are the same for all event-station pairs for various events. The residuals measured at 196
relatively distant stations are almost similar for some events due to velocity variations outside the 197
network that is suggested to cause individual station residuals. 198
In this study, the event locations and focal depths are well constrained due to both near and far 199
stations (17 stations with location azimuthal gaps < 180o) 200
(http://www.deprem.gov.tr/en/ddacatalogue/GetDDACatalogueSfile) (Fig. 1) using careful 201
selections of only available P-phase reads at the nearest stations to get a reliable solution and to 202
select high-quality events and the focal depths. The nearest stations influence very much on the 203
accuracy of the data evaluation and provide the most accurate information due to the clarity of 204
the phase reads. This gives a better fit and relatively correct location as an indication of the 205
reliability of the inversion. However, the S-phase reads do not improve the solution and seem to 206
have relatively large weights due to their lower velocities and possible local heterogeneities. 207
The AFAD-KOERI joint catalogue with selected events inside the network has P-residuals < 0.5 208
s. For distant stations, P-residuals from clear P-phases are less than 1 s while S-phases have 209
relatively larger residuals due to structural complexities or their low velocities. These results 210
show travel time residuals below AFAD-KOERI network and event-dependent values, depending 211
on the network array, number of stations, event types and the number of secondary phases. In 212
addition to residuals, epicenter locations, according to the faults observed from seismic reflection 213
profiles (Toker and Şengör, 2011; Çukur et al., 2013; Çukur et al., 2016; Toker et al., 2017; 214
Toker, 2017), are checked. Epicenters far outside the network and also S-phases are not used. The 215
11 to the appropriate action of the local operator. Thus, only the precisely located focal depths of 217
aftershocks are used and relocated for analyses (see Appendix B). As a result, 1-2 km differences 218
were obtained between the first solutions and horizontal and focal depth error. 219
In the present study, focal depth locations based on the AFAD-KOERI data set reveal a focused 220
geometric picture of distributed aftershock seismicity (Toker, 2013; 2014; 2015) (Figs. B1 and 221
B2). Most of the aftershocks align in upper crustal depths along curve-linear, linear, horizontal 222
streaks. Most of the aftershock activity consists of clustered similar and/or same events, 223
suggesting strong self-similarity of coupled events at depths with focal depth location errors 224
typically about 1-2 km. Some selected events of the aftershock activity constrained by AFAD-225
KOERI joint catalog picks are also compared with the data set performed by previous studies 226
(Gülen et al. 2002; Irmak et al., 2012; Kalafat et al., 2013; Fielding et al. 2013; Toker 2013; 227
Bayrak et al. 2013; Toker 2014). The comparison indicates that overall geometric pattern of the 228
individual events reveal the same relocated seismicity structure of Irmak et al., (2012) based on 229
the same KOERI data set with focal depth uncertainties of 1-2 km (Irmak et al., 2012) and 2-3 230
km (Kalafat et al., 2013; Bayrak et al., 2013). This indicates reduced and desired location 231
uncertainty in focal depths. Absolute uncertainties for aftershock locations are difficult to 232
estimate because of the extreme structural complexity of the study area. However, considering 233
that the structure is highly complex, and based on the hypocenter locations given in the AFAD-234
KOERI joint catalogue and alsothe data set performed by previous studies, this study proposes a 235
focal depth location uncertainty of ~1-2 km. 236
2.2. Relocation results
12 The relocation results of the selected high-quality events based on the AFAD-KOERI joint
238
catalog show that the seismicity has a maximum depth of ~30 km with peak activities at 8 and 10 239
km (Figs. B1 and B2). The relocated aftershocks more than about 65 % occur below ~10 km and 240
indicate a focused view of the cluster seismicity at ~8-10 km, compared to the more scattered 241
locations at AFAD network only (Fig. 1). Here, we conduct a spatial pattern analysis to address 242
the distribution of the aftershock seismicity with respect to the basin-bounding faults (Fig. 2). 243
The relocated aftershocks collapse into fault-bounding discrete zone within the Lake Van area 244
(Fig. 2), and roughly follow the local zones of increased strains associated with the faults, while 245
other located events became more spread out. Also, more aftershocks are densely positioned 246
along the E-part of the lake, compared to the W-part. Seismic activity is increased to the E and S 247
of the basin, while other areas remain seismically quite. When moving W in the basin along the 248
boundary faults, the activity decreases and fades out, showing quite areas within the basin. 249
However, the aftershock seismicity is densely distributed and clustered between the basin-250
bounding faults, when moving E in the basin. These observations indicate a clear “aftershock-251
clustered seismicity behavior” along the basin (Fig. 2). This is the basic pattern of our further 252
analyses. These observations are also correlated with the multi-channel seismic reflection studies 253
in Lake Van Basin (Çukur et al., 2013; Çukur et al., 2016; Toker et al., 2017; Toker, 2017) that 254
indicate a tectonic mobility of cold, brittle and fragmentary crustal flake (tectonic model by 255
Toker et al., 2017). This shows the clustered behavior of relocated aftershock seismic activity that 256
almost reaches the upper elastic crust at about 10 km (Şengör et al., 1985; Dewey et al., 1986; 257
Şengör et al., 2008; Toker et al., 2017; Toker, 2017) (Figs. A1 and A5) and the lower crust at 258
about 30 km (Şengör et al., 2003; Şengör et al., 2008) (Figs. B1 and B2). 259
13 The earthquake catalog of the Lake Van study area, spanning the period November 2011–March 261
2014 and contains 10,000 events over three years. The depth and magnitude of the earthquakes 262
ranged from 5 to 30 km and Mw 1.5–7.1, respectively. The relocated seismicity map of the Van 263
mainshock-aftershock sequence for magnitudes (Mw ≥ 3.5) is well constrained by the previously 264
mapped faults in Lake Van Basin (Çukur et al., 2013; Çukur et al., 2016; Toker et al., 2017; 265
Toker, 2017), showing a sigmoidal pattern of aftershock distribution and the rupture zone parallel 266
to the Lake Van tectonic trend and approximately 60-65 km in length (Figures 1 and 2). During 267
the period 23 October, 2011 through November 2011 to December 2, 2011, the Van aftershock 268
sequence consists of about 3100 events of (3.5 ≤ Mw ≤ 6.0) and the recorded events of magnitude 269
Mw ≥ 4.0 were more than 100 occurred towards the north-east and south-west parts of the rupture 270
area (Bayrak et al., 2013). These short-term records suggest that the seismic energy is mostly 271
released in the form of moderate size aftershocks in the rupture area where large size asperities 272
were found (Irmak et al. 2012; Bayrak et al. 2013). 273
The map view of the seismic density of the relocated aftershock hypocenters obtained from the 274
AFAD-KOERI joint catalogue includes 5,088 events shown in Figure 2. In this study, ~150 days 275
of aftershock data (from November 2011 to March 2012) were processed and projected from the 276
catalogue. As a result, 4,853 aftershock hypocenters, of which 2,476 had a local magnitude 277
greater than 3.5, were retrieved (Figures 3 and 4). In Figure 5, the cross-sections show the 278
migrational patterns of the relocated hypocenter activity over the four periods including 4853 279
events of March 2012 as shown in Figure 3b. Then, to establish azimuth-dependent cross-280
sectional images of the aftershock distribution, the epicentral distribution of 10,000 events were 281
selected for a time period from November 2011 to March 2014 (Figure 7). Finally, to plot the 282
14 microseismicity, 6,135 events were selected from 282 days covering the period from October 23, 284
2011 to August 1, 2012 (Figures 8 and 9). Detailed images for depth-dependent P- and S-wave 285
velocity anomalies and related cross-sections are given in Figs. A1-A5 and Figs. B1-B2, 286
respectively. 287
2.3. Pattern recognition
288
The spatial and temporal patterns of the aftershock distribution associated with the observed 289
clusters show no distinct difference between the periods of November 2011-March 2012 (Figures 290
3-6) and November 2011-March 2014 (Figure 7). The main difference is only related to the 291
growing, tightening and deepening patterns of the observed clusters, showing a concentrated 292
pattern of distribution and tightness of the relocated hypocenters. The hypocenter locations were 293
compared to investigate the spatial and temporal variation of the seismicity in the clusters. The 294
plotted hypocenter locations are closely and tightly spaced and clustered with the located clusters 295
being densely concentrated. As a result, the pattern recognition of the clusters observed from 296
aftershock relocation analyses is mainly based on the events concentration within highly distinct 297
spatial activity (also see Figs. B1 and B2). 298
The closely located patterns of aftershocks recorded by a given station provide useful constraints 299
in reducing the uncertainties involved in determining relative earthquake locations. The primary 300
assumption that guarantees the usefulness of the clusters is that the hypocenters are closely 301
spaced such that the observed waveforms of two close events are comparable due to the similarity 302
in Green's functions, which characterize the source-receiver paths (An et al. 2010). This suggests 303
that individual clusters show a high similarity of waveforms. However, there were thousands of 304
15 study, a waveform cross-correlation and/or a ST-clustering algorithm analysis were not carried 306
out when locating the aftershocks. Detailed spatial pattern analyses of the observed clusters are 307
not aimed in this study due to the presence of high quality, multi-channel seismic reflection and 308
high-resolution Geo-chirp datasets collected from Lake Van Basin (Fig . 2) (Toker, 2011; Toker 309
and Şengör, 2011; Çukur et al., 2013; Çukur et al., 2016; Toker et al., 2017; Toker, 2017) (see 310
also Appendix A for Vp and Vs anomalies). 311
Overall pattern of larger main cluster was clearly observed from the 2011 Van event. This pattern 312
was controlled by basin-bounding faults (Fig. 2) and caused by subsurface stress perturbations 313
closely occurred at similar and smaller spatial scales (Toker 2014; 2015). Bayrak et al. (2013) 314
reported that the irregular changes in b-value were extremely spatially localized. These results 315
indicate that earthquakes occurring in very close vicinity to make a main cluster may represent 316
the repeated slip of the same patch on a fault (Baisch et al. 2008; An et al. 2010). In the cross 317
sections, the observed clusters are concentrated within highly distinct spatial activity and well 318
constrained by the mapped basin-bounding faults (Fig. 2) (see Appendix B). The lower depth 319
limit of seismicity in the main cluster was 8-10 km (Figures 4-6), but ~30 km (Figure 7), similar 320
to the depths given in the previous studies. Thus, these observations indicate that the hypocentral 321
accuracy and the location uncertainty of ~1-2 km in the focal depths are not considered to 322
influence the discussion based on the main results presented in this study (see Appendix A and 323
Appendix B). 324
3. Spatial and Temporal Character of the 23 October 2011 Aftershock Sequence
325
This section focuses on the spatial and temporal pattern of hypocenter distribution of the October 326
16 and on the spatial and temporal characteristics of its aftershock sequence. This section aims to 328
shed light on the focal depth nature of aftershock seismicity and the rupture complexity of the
329
Van event.
330
3.1. Spatial and temporal distribution of aftershock hypocenters 331
The maps depicted in Figure 2 show the total distribution of 5088 aftershock events used in the 332
first step of this study (AFAD-KOERI 2011-2014). Figure 2 is also the map view of seismic 333
density of hypocenter distribution of the Van and Edremit aftershock sequences. That figure 334
shows the sigmoid-like propagation of the rupture area corresponding to the aftershock sequences 335
of the Van and Edremit mainshocks, with the boundary faults located around the epicenters of 336
Van and Edremit events. The purpose of this section is simply to identify the cross-sections of the 337
aftershock hypocenters associated with the map view given in Figure 2. To obtain a spatial and 338
temporal overview of the seismicity pattern, the focal depth distribution of the aftershock 339
hypocenters was examined month by month within the time period of November 2011 to March 340
2012. The results are presented in Figures 3a and 3b. 341
During the first month following the October 23 Van earthquake, different and various-sized 342
clusters of local events occurred in the focal area (Figure 3). These aftershocks can be seen to 343
have been gradually decaying over the subsequent months in the period up to March 2012 344
according to Omori’s law (Omori 1884), and were dying out when the second Edremit event 345
occurred (Figure 3a). In December 2011, the second month, the overall activity decreased 346
continuing to decrease in the third and fourth months, and virtually ceased in the fifth month 347
reaching 303 events (Figure 3a). In the same time period, November 2011 to March 2012, the 348
17 activity began to subside in March 2012, even though until the end of the July, 2012 there were 350
several more events of M ≥ 4.0 (Toker, 2014). The hypocentral superposition of aftershock 351
events produced unusual seismic activity during the two last months of 2011 (Figure 3b). It 352
appears that the Van earthquake repeatedly triggered one or more local faults in the area, and 353
these in turn affected the seismicity. 354
In order to obtain more information from the distribution of hypocenters shown in Figure 3b to 355
see and clarify the spatial patterns of the events distribution in detail different orientations of the 356
focal area were tested, centering on the aftershock cloud, according to the focal mechanism given 357
in Figure 2. The north-south trending zonal projections on the distribution of hypocenters 358
associated with the Van event, starting with the west-east trending zonal distribution of the 359
aftershocks for the four zones are shown in Figure 4. In this figure, the hypocenter distribution 360
for each zone from narrow (zone 1) to wide (zone 4) indicates the first appearance of the small-361
sized linear clusters (zone 1) and uneven rapid concentration and densification of the event 362
clusters (zone 2). Then, the hypocenter distribution defines a tightly consolidated and spherical 363
(or semi-spherical) and/or parabolic pattern of the distribution (zones 3 and 4), which agrees with 364
the distributional pattern given in Figure 3b. 365
3.2. The focal depth distribution of aftershock clusters 366
In Figure 4, the hypocenters of the aftershocks form a wide 'U' letter shaped cluster (hereafter 367
referred to as the "main cluster"). This main cluster is a half cylinder-like channel-shaped cluster 368
located at a broadly widening (about 60 km wide) area. The main cluster has a central (and/or 369
core) cluster that is more tightly densified. The central cluster is narrow (about 25-30 km wide) 370
18 the 'U' are symmetrically dip towards each other and are of almost the same length, about 20-30 372
km. The mainshock is included in the central part of the main and central cluster. The 373
hypocenters belonging to the main cluster and its surrounding area have spans of about 25 and 30 374
km in the strike and dip direction, concentrated well into a depth of 8-10 km. Also, the 375
hypocenters in the southern and northern part of the main cluster seem to be located along the 376
extension of the plane of the central cluster aftershocks down to a depth of about 8-10 km. 377
The distributional pattern of hypocenters at the central cluster is fault-bounded (f1 and f2) (Fig. 378
2) and shows strong concentration in and around the focal area (Figure 4). However, the 379
hypocenter activity outside the main cluster area deep down is more diffuse and few evident 380
clusters can be seen. It is difficult to image the overall shape of the hypocenter distribution at a 381
depth of more than 10 km due to the diffused and scattered focal depth distribution and do not 382
seem to form a systematic pattern of the hypocenter geometry (Figure 4). 383
The overall distribution of hypocenters shown in Figures 3b and 4 is concentrated around the 384
mainshock hypocenter and forms the central and main clusters. The most prominent aftershock 385
cluster contains the mainshock hypocenter and has a U shape. The spatial extent of the plane of 386
the concentrating aftershocks and their hypocenters indicate the location of the rupture area of the 387
mainshock. The aftershocks on the periphery of the rupture area (zones 3 and 4 in Figure 4) show 388
a more diffused distribution partly due to the off plane aftershock activity. The location of the 389
plane of the aftershock distribution corresponds to the upper crustal seismicity. This location 390
seems to be a good fit with the eastward and westward limit of the in-plane aftershock activity. 391
19 Figure 4 suggests that the shape of the upper crustal block controls the spatial extent of the
393
asperity complex of the Van earthquake. 394
3.3. Migration of hypocenter activity 395
As shown in Figures 3 and 4, the spatial and temporal distribution of the aftershock seismicity 396
can be explained through distinct cluster formations. The spatial and temporal variation of 397
seismic activity is densely complex and highly clustered, comprising a repeated formation of 398
small and large-sized clusters over brief time periods. 399
To further investigate the spatial and temporal variation of hypocenter activity in the main and 400
central clusters shown in Figure 4 the hypocentral data was divided into four periods and 401
different numbers of events for each period were used to reveal the migration and propagation of 402
the hypocenter activity. Figure 5 displays the hypocenter activity of the March 2012 shown in 403
Figure 3b and the distance versus depth plots for the four time periods are shown in each figure. 404
The four periods shown in Figure 5 indicate the positions of the hypocenter activity for the cases 405
of aftershock events of 662, 1,000, 2,000, 2,771, 3,000, 4,000, 4,402, and 4,853, respectively. 406
Figure 5 reveals that the seismic activity began near the peripheral parts of the main cluster with 407
small-sized linear clusters (a) and then migrated to the center and the north and formed the first 408
traces of the central and main clusters (b) during the first period. The activity in the northern part 409
started to accumulate in the center (c) and then, the activity jumped to the south during the 410
second period. In the south, many aftershock events occurred, particularly larger events with 411
magnitudes greater than 3.0-3.5 and the central and main clusters were apparently formed (d). 412
During the third (f and e) and fourth periods (g and h), the hypocenters were distributed across 413
20 lower bound (seismicity front) of the main cluster increases over time, rapidly in the second 415
period and this change in depth reaches 10-13 km. This parabolic-like envelope of the main 416
cluster characterizes the diffusion-like front migration (g and h). 417
In the cross sections, the shallow and deep migration of hypocenter activity in the main and 418
central clusters is shown in Figure 5. The hypocenters of more than 10 km seem to penetrate the 419
deeper levels and those shallower than 10 km are located in the main and central clusters. The 420
diffusivity is smaller inside the clusters and larger outside and towards the deeper levels. It can be 421
inferred from the distance versus depth plots in Figure 5 that the migration and diffusivity of the 422
hypocenter activity seems to increase over time from November 2011- March 2012, with the 423
maximum diffusivity recorded in November 2011, when the seismic activity had increased 424
drastically (2,828 events shown in Figure 3b). The general periodic trend of the migration of 425
hypocenters and diffusivity implies that the aftershock activity accelerated during the second 426
period of seismic activity for event numbers 2,000-2,771 (Figure 5). In Figure 5, the migrational 427
pattern of hypocenter activity indicates spatially predominantly linear to planar hypocenter 428
distributions in the first period, but quickly changes to parabolic to spherical (periods 2 and 3), 429
and a more spherical spatial pattern in the last period. This suggests that the hypocentral variation 430
of seismicity is not unidirectional but very complex. 431
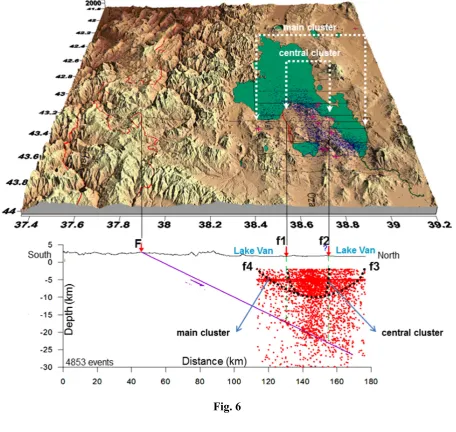
To interpret the main and central clusters, the hypocenters of the 4,853 events are projected on 432
the epicenters of the 5,088 events shown in Figure 6. The aftershock hypocenters are mainly 433
distributed in the central section of the focal area. The main cluster is interpreted to be limited by 434
the possible reverse faults f4 and f3 in south and north, respectively, while the central cluster is 435
21 central clusters in the rupture area appears to be separated by fault-bounded crustal blocks (Fig. 437
2), which are initially proposed by Toker et al., (2017) and well constrained by Toker, (2017) 438
based on the Gutenberg-Richter seismic b-values (see Figs. B1 and B2). 439
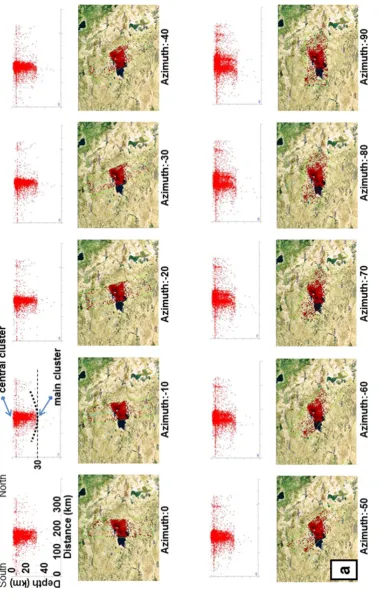
3.4. The Azimuth-dependent distribution of seismic activity 440
The spatial and temporal distributional patterns of the aftershock hypocenters were noted in the 441
previous sections. To investigate their seismicity activity in greater detail, approximately 10,000 442
events were recorded in the time period from November 2011 to March 2014 (Figure 7). The 443
epicenters and hypocenters were replotted using a rectangular-shaped analyse window (1.0o x 444
3.0o) to observe the azimuth-dependent changes of the aftershock seismicity projected on the 445
distance versus depth plots. This is a very useful tool for investigating the hypocenters of events 446
in the main and central clusters and their focal depth changes. Since the distribution of the 447
seismic activity strongly depends on the azimuth and azimuthal rotation, the aftershock events 448
located within the mainshock area are considered to be representative. For comparison, the 449
aftershocks are shown using the azimuth-dependent projections. 450
Counterclockwise (-) and clockwise (+) rotational projections were applied to the events with 451
rectangular-shaped analysis window of 1.0o x 3.0o. Hence, the azimuth-dependent rotation of the 452
depth versus distance plots were used with varying rotation angles. The azimuth is 0o for the 453
projections trending north-south, and ranges from -10° to -90°, for the counterclockwise rotation 454
shown in Figure 7a and from +10° to +90° for the clockwise rotation given in Figure 7b, 455
respectively. Then, the azimuth-dependent changes of the events are projected on the depth 456
22 The overall aftershock distribution on the cross-sections shown in Figure 7 roughly corresponds 458
to the aftershock activity on those cross-sections (Figures 3-6). Along the azimuth-dependent 459
projections, it can be seen that most of the hypocenter activity densely occurs just beneath the 460
mainshock area and the central and main clusters are combined into the one unique and larger 461
cluster at a depth of 30 km (Figs. B1 and B2). The cluster on the projections with an azimuth of 462
0o-40o and -50o-90o seems to have conical-shaped narrow and wide volumetric patterns, 463
respectively (Figure 7a). These conical-shaped volumetric patterns of cluster seem to have the 464
square-like widening patterns (Figure 7b). This suggests that the hypocenter activity migrates, 465
extends down to ~25 km, with the maximum depth being 30 km and covers the whole crustal 466
seismicity (Figs. A1-A4 and B1-B2). Given that the average cutoff depth of ~30 km represents 467
the seismic base of the crust along the rupture fault system, the seismicity distribution indicates 468
that the upper crust in the study area is brittle and seismogenic, and that the brittle–ductile 469
transition may occur at the transition between the middle and upper crust. Since most of the 470
aftershocks were found beneath the surface outcrops of the focal area and the basinal area of 471
Lake Van with sparse aftershocks may represent the base of the thick sediment body. 472
The cross-section shown in Figure 6 is oriented south to north with 0o azimuth (see Figure 7). 473
The hypocenters depicted on this cross-section show a possible convergence at depths of ~8-10 474
km (Figs. A1 and A5). The extrapolation of the central cluster from the surface is located around 475
the mainshock surface rupture in the narrow area between Lake Van and Lake Erçek (faults f1 476
and f2 in Figure 6). Therefore, currently the central cluster is highly active and considered to 477
represent the deep rupture associated with the mainshock and the main cluster appears to have 478
been activated by the pre-existing low-angle reverse faults (f3 and f4). The cluster distribution 479
23 be an insufficient description based solely on the distributional pattern of the hypocenter.
481
Basically, all the aftershocks are densely distributed around the main and central clusters, which 482
confirm that the earthquake fault was ruptured during the Van earthquake. 483
3.5. Microseismicity clusters 484
This section further analyzes the spatial and temporal aftershock sequences occurring along 485
secondary and/or splay faults at or along the fault-bounded (f1 and f2) central cluster shown in 486
Figure 6. If the central cluster is currently highly active and considered to represent the deep 487
rupture complexity, the close spatial and temporal proximity of microseismic events need to be 488
used to improve the visual resolution of hypocenters in the central cluster. Hence, similar events 489
were searched for using the temporal clustering procedure (Toker 2013; 2014) to locate the 490
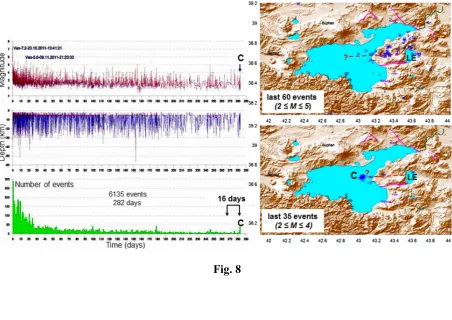
clustered microseismicity occurring within small volumes. Figure 8 shows the temporal 491
distribution of aftershocks and temporal relation of the clustered events comparable to the 492
magnitude and the focal depth versus time plots. 493
The temporal distribution of the aftershocks analyzed in this paper consists of a total of 6135 494
events over 282 days (October 23, 2011-August 1, 2012) in three different plots with Mw >1.5-495
2.0 earthquakes occurring sequentially one after another with the duration of each day being less 496
than 24 hrs (Figure 8). In Figure 8, the prominent temporal activity sequence contains 60 events 497
(2.0 ≤ Mw ≤ 5.0) occurring within the previous 16 days, with the strongest of the temporal 498
activity clusters including 35 events (2.0 ≤ Mw ≤ 4.0) occurring within less than 12 hrs. The last 499
individual temporal cluster was identified and analyzed, including the last 35 events. This cluster 500
indicates that the temporal activity of the cluster is spatially concentrated within distinct activity 501
24 As shown in Figure 8, the most prominent sequence observed along the inferred fault consists of 503
60 located microearthquakes all occurring within 16 days preceding 31 July 2012 and within the 504
ruptured area between Lake Van and Lake Erçek. This sequence indicates a west-east trending 505
morphology of the inferred fault. The observed prominent temporal cluster consisted of 35 506
located microearthquakes that all occurred within a time period of less than 12 hrs on 1 August 507
2012 and within an area of about 2.5-3.0 km2. The epicentral alignment of the events suggests an 508
east-west striking orientation in the map view. The strike of the aligned events with the cluster 509
and the local trend of the ruptured area suggest a junction between the main fault branch and a 510
splay fault at the cluster (Figure 8). For a further analysis, the hypocenters of temporal cluster 511
were plotted on a depth section trending north–south to observe the general trend of the events as 512
identified in Figure 8. The 35 microearthquakes are observed that all occurred at the central 513
cluster with varying depths (Figure 9). These events are linearly aligned in the section with the 514
activity expanding to shallower depths, the hypocentral depths of the events range from 3.0 to 20 515
km, but remain limited to a depth of 20 km, and suggest a steep dip (≈ 90°) (Figure 9). The events 516
were systematically spread along the plane of the section with a gradual increase of number of 517
events during the most active part of the cluster. The largest event occurs with a magnitude of 4.0 518
and the centroid of the activity then migrates to the central cluster bounded by faults f1 and f2 519
(Figure 9). The hypocenters define the starting point of the cluster followed by a systematic 520
migration throughout the central and main clusters shown in Figure 6. 521
The linear distributional pattern of the events cluster suggests vertical migration of the aftershock 522
activity and most probably indicates the nucleation point of the failure between f1 and f2 and the 523
progressive failure of adjacent patches of the possible fault (Figure 9). This was initiated on the 524
25 aftershock magnitudes, focal depths and the number of events observed within the cluster
526
increased and then gradually decreased. The events cluster observed in Figure 9 represent the 527
complex behavior of the rupture process within the central cluster. 528
4. Discussion
529
This paper reports on a study of the spatial and temporal character of the 2011 Van earthquake 530
aftershock sequence with the following five aims. First, to identify the aftershock hypocenters 531
and their spatial and temporal distributions linked to the mainshock and basin-bounding faults 532
(f1 and f2) mapped from seismic reflection data in Lake Van Basin (Fig. 2a) (Toker, 2011; Toker 533
and Şengör, 2011; Çukur et al., 2013; Çukur et al., 2016; Toker et al., 2017; Toker, 2017); 534
second, to observe the aftershock clusters, their focal depth distributional patterns; third, to 535
understand the migration of the hypocenter activity associated with each observed cluster; fourth, 536
to determine the azimuth-dependent distribution of seismic activity; and fifth, to detect an 537
individual temporal cluster of microseismicity along the ruptured area in the Lake Van area. Our 538
analysis of the aftershock sequence leads to the result that the observed hypocentral activity, the 539
main and central clusters and their surrounding events show distinct patterns of the distribution 540
(Figs. A1-A5 and B1-B2). The spatial extent of the rupture area was fault-controlled extending 541
from Lake Van Basin (Fig. 2) and found to be almost the same as the size of the aftershock 542
distribution (Figures 3-6). These correspondences suggest that the aftershock distribution 543
obtained by this study reflects an exact hypocentral picture of the crustal profile of the 2011 Van 544
26 4.1. Spatial and Temporal Character of the Aftershock Sequence
546
The overall pattern of the hypocenter distribution is seen to be terminated by the north- and 547
south-trending arms of the U-shaped main cluster and the hypocenters north and south of the 548
cluster show diffused focal depth distribution (Figures 4-6). This suggests that the north and 549
south arms mark the up-dip limit of the rupture area of the mainshock. The aftershocks, at a depth 550
of 8-10 km (Figures 5 and 6) and, up to 30 km (Figure 7) occur off the plane of the mainshock 551
rupture. In Figure 7, the distributional pattern of the hypocenters extends more, to the deeper 552
levels than the location of the main cluster as shown in Figures 5 and 6. This suggests that the 553
coseismic slip distribution may be shifted compared to the previously determined hypocenter 554
distribution. The aftershock activity may be inactive in the asperity region (e.g., the central 555
cluster), where there is a large amount of coseismic slip (e.g., Scholz 2002, Hino et al. 2000). In 556
the Van earthquake case, the aftershocks around the mainshock epicenter concentrated into large 557
clusters and several areas of low seismicity may be the locations of the asperities ruptured by the 558
mainshock (Yaginuma et al. 2005). 559
The northern and southern limits of the hypocenter distribution of the main cluster (Figures 4-6), 560
which are interpreted as the northern and southern limits of the rupture area of the Van 561
earthquake, correspond to the upper crustal-flake seismicity in eastern Anatolia (Dewey et al. 562
1986; Şengör et al. 1985; Şengör et al. 2008). The rupture propagation of the Van earthquake 563
may be terminated by possible crustal fault planes (f3 and f4) located about 8-10 km up-dip of the 564
hypocenter (Figure 6). This termination of the rupture propagation may have been caused by the 565
reduction of the stress at the tips of growing faults by the seismic deformation spread over a 566
27 crustal seismicity (Toker, 2013) is activated along the west-east trending southern and northern 568
arms of the main and central clusters (compare Figure 6 with Figure 7) as the result of the rupture 569
termination process. 570
Toker (2015) reanalyzed seismic network data to compare the distributional pattern of the 4853 571
aftershocks (see Figures 3-6) with the 10,000 aftershocks (Figure 7) (Toker 2015) and the 572
background seismicity pattern (Toker 2014). This comparison indicates that the positions of the 573
active aftershock seismicity show spatial and temporal variations. That is, the positions of 574
hypocenters and the overall geometric patterns of the clusters show the azimuth-dependent spatial 575
variations along the distance versus depth plots (Figure 7). This may suggest seismic coupling 576
and its spatial variations thus, implying that this seismic coupling is strongly controlled by the 577
persistent temporal and spatial clusteral nature of the Van event (Toker 2014), such as structural 578
heterogeneities, irregular strain accumulations, slip defects along or in the intraplate setting 579
(Toker 2014; 2015). This reveals that the hypocenter distribution of the aftershock activity 580
strongly reflects the spatial and temporal variation of the intraplate seismic coupling (Toker 581
2014). 582
The spatial and temporal clustering of microseismicity is also detected along the ruptured area in 583
the Lake Van area (Figures 8 and 9). The hypocenter distribution of a single individual cluster 584
represents an upward migration of microseismicity on an evolving subsidiary fault (Figure 9). 585
The west-east trending fault morphology hosting cluster shown in Figure 8 forms part of the 586
evolving fault network in the rupture area where the spatial and temporal distribution of the 587
events are densely concentrated (Toker, 2017). The temporal clusters are associated with the 588
28 planes of activity (Toker 2013; 2014). These clusters are interpreted to represent repeated failure 590
on the same source patch and considered to be hosted within the complex fault structures under 591
non-uniform stress fields (Ben-Zion 2008; Toker 2013; 2014). This indicates that the spatial and 592
temporal pattern of the events is associated with the currently active faults that display similar 593
kinematics throughout the ruptured area (Çukur et al., 2016; Toker et al., 2017; Toker, 2017). 594
This consists of a complex network of fault instabilities and/or patches connecting fluid-filled 595
extensional cracks and/or fractures (Hill 1977). The central cluster shown in Figure 6 was 596
correlated to the microseismicity cluster shown in Figure 9 finding that there was a spatial 597
correlation between these clusters. The nature of seismic deformation energy released was 598
assumed to be in a discrete form of spatial and temporal distribution of the aftershocks in and 599
around the ruptured area (Toker 2014). This offers evidence of the temporal and spatial density of 600
microseismicity clusters under the ruptured area, associated with discrete form of events due to 601
the presence of disordered fault zones and high fracture density in the seismogenic crust (Bayrak 602
et al., 2013; Toker 2013; 2015; 2017). 603
4.2. The rupture complexity of the Van earthquake 604
The analyses, in this paper, of the spatial and temporal character of the 2011 Van aftershock 605
sequence are often associated with mapped faults in the Lake Van Basin (Fig. 2a) (Toker, 2011; 606
Toker and Şengör, 2011; Çukur et al., 2013; Görür et al., 2015; Özalp et al., 2016; Çukur et al., 607
2016; Toker et al., 2017; Toker, 2017). The joint interpretation of aftershock sequence and 608
seismic reflection profiles reveals the lateral and vertical heterogeneity of the fault-controlled 609
aftershock distribution and along-strike seismic activity in crust within the rupture area. This 610
29 failure on the pre-existing, weak fault systems, but a more complex process that involved the 612
fracturing of strong rock blocks (Bayrak et al., 2013; Toker, 2017). This means that the rupture 613
area of the Van event is a fault-bounded fragmentation barrier (Toker, 2017). Such a local strong 614
area (e.g., large asperity and/or barrier) is highly resistant to rupture growth on a fault and this 615
area plays a more important role in determining the size of an earthquake than the remainder of 616
the fault plane, which has little resistance to rupture growth (Ohnaka and Kato 2007; An et al. 617
2010). Moreover, hypocenters and their distributional patterns (e.g., the migration, diffusion, 618
scattering and clusters) are also the consequence of stress redistribution related to the mainshock, 619
occurring as failure along smaller fault asperities (Toker, 2017). Aftershocks involve lower stress 620
values than the mainshock and thus, may occur at greater depths and over wider areas than the 621
mainshock (Strehlau, 1986). In the present case, most of the aftershock hypocenters rapidly 622
occurred and formed the clusters beneath the mainshock area, where the portion of the upper 623
crust consists of the thrusted slices with volcanic materials (Şengör et al. 2003; 2008; Toker et al., 624
2017; Toker, 2017) and may contain asperities and barriers (Toker 2014). This may explain the 625
spatial and temporal heterogeneity of the aftershock seismicity. 626
The anomalous distribution of larger aftershock activity in the Van mainshock also showed a 627
triggered pattern of multi-clusteral events (Mw ≥ 4.0) and extreme heterogeneity of the faulting 628
in the rupture area (Toker 2013; 2014; 2015), supported by the large size asperities in the rupture 629
zone of the mainshock (Irmak et al. 2012; Koçyiğit 2012). The short and long-term temporal 630
activity of distinct clusters defined by Toker (2013; 2014) permits a better understanding of the 631
rupture process in the local-scale seismicity along the ruptured area. Thus, the epicentral pattern 632
of sequential events and hypocenters of microseismicity clusters supply important information by 633
30 spatial and temporal distribution of microearthquakes and their systematic migration within 635
individual clusters during the progressive failure of neighboring fault patches may define the 636
simple picture of individual fault patches. Hence, the temporal pattern of seismic sequences 637
observed in the ruptured area may suggest a progressive failure process on adjacent fault patches. 638
Considering the above results, the spatial and temporal character of the Van aftershock sequence 639
is that the 2011 Van mainshock strongly triggered later events associated with a system of crustal 640
faults along the accretionary wedge complex of Eastern Anatolia, and at the same time some 641
crustal faults were activated reciprocally and new events were induced in the focal area. For 642
example, the second destructive earthquake of Mw 5.6 (Edremit event) on November 9 was 643
located on one of these faults, which probably had sufficient accumulated energy, and the stress 644
storage derived from the adjustment of the tractions after October 23 acted as a trigger. The Van 645
mainshock-aftershock sequence indicates the conditions under which aftershock events may 646
interact with the other events (e.g., Edremit aftershock sequence) to repeat or renew the 647
interactions of events (Toker 2013, 2014). The superposition of both the mainshocks within such 648
a short interval of time with the respective aftershock sequences produced an intense spatial and 649
temporal period of seismic activity that did not decay according to known simple laws. 650
4.3. Implications for the damaged area in and around Lake Van
651
The spatial and temporal character of the Van aftershock sequence associated with the mapped 652
faults in Lake Van Basin reveals an increasing damage pattern with internal damage zones in the 653
Lake Van area. The highly damaged rheology caused by the Van earthquake in multiple zones 654
with a variable density of cracks/fractures/secondary smaller faults manifested as activated fields 655
31 and anisotropy. These zones produced locally varying focal mechanisms and a high variance of 657
the stress fields (Görgün 2013; Bayrak et al. 2013; Toker 2014). 658
The post-seismic hypocentral behavior of the Van aftershock sequence also exhibits distinct 659
patterns of clusters and anisotropy in the distribution and redistribution of stresses over space and 660
time (Toker 2013; Altiner et al. 2013). The damaged area from the Van event had a distinct 661
asymmetric aftershock response to loading under heterogeneous stress conditions and clusters 662
(also with decluster, quiescence and power-law truncation of events) during the loading-663
unloading intervals (Toker 2013). This was mainly due to a higher energy dissipation associated 664
with the creation and activation of new small faults, microcracks and fractures (increasing 665
damage) and the inelastic deformation of the internal damage zones (Ben-Zion 2008). These 666
results imply that the asymmetry of the aftershock response to seismic deformation (damaged 667
area) became extreme and strongly anisotropic across a wide range of size scales (wide ROSS) of 668
the damage in the Lake Van area (Ben-Zion 2008; Toker 2013; 2014). This requires a view of the 669
discrete framework commonly used in a statistical mechanics approach (Ben-Zion, 2008). The 670
post-seismic hypocentral behavior of the Van aftershock sequence is, in fact, similar to the 671
readjustment of crustal stresses (Khilyuk et al. 2000) in intraplate accretionary orogens (Şengör et 672
al. 2003; 2008). This supports the argument that the real cause of the anomalous occurrence and 673
distribution of aftershocks and their hypocenters may be anisotropic stress transfer and the rapid 674
dynamic redistribution of stresses rather than the gradual static increase (Khilyuk et al. 2000; 675
Ben-Zion 2008). This assumes a discrete structural model of the seismogenetic crust and suggests 676
a dynamic origin of the 2011 Van mainshock-aftershock generation rather than the static concept 677
32 Previous studies of the 2011 Van event reported the heterogeneous stress and strain regimes in 679
and around the focal area, however, they did not reveal how the seismic activity and related stress 680
regime changed spatially and temporally. Several shallow faults observed in the field slipped for 681
days and weeks after the mainshock. These shallower faults in the crust now have increased 682
stress and were reported to have been triggered from the dynamic and static stress changes of the 683
mainshock (Fielding et al. 2013). It can be postulated that spatial and temporal variations of the 684
Van aftershock sequence, representing dynamical characteristics in the distribution of the spatial 685
hypocenter locations of events, are related to changes in the high stress regimes. Our results show 686
that the observed spatial and temporal variations in the seismicity are most likely due to 687
significant changes in the local stress regime over an 2-year period (2011-2014), ranging from 688
reverse-thrust faulting (fractures closing) via a strike-slip regime and finally to extensional 689
faulting (fractures opening) (Irmak et al., 2012; Çukur et al., 2016; Toker et al., 2017; Toker, 690
2017). The detailed origins of these changes are not clear yet however, these results are critical 691
for forthcoming large earthquakes. Despite the irresistant and warm crustal structure of the 692
rupture area, the mid-crust behaved sufficiently strongly to rupture in the 2011 Van event and 693
produce huge aftershock seismic activity. Thus, the Van earthquake and its long-period 694
aftershock sequence are anomalously different from all the other earthquake types across Turkey. 695
5. Conclusions
696
This analysis of the spatial and temporal distribution of the 2011 Van earthquake aftershock 697
sequenceleads to the main conclusion that the observed hypocentral activity, the main and 698
central clusters and their surrounding events show distinct distributional patterns of the rupture 699
33 extent of the rupture area and offer an exact hypocentral picture of the crustal profile of the 2011 701
Van event. 702
The overall distribution of hypocenters is concentrated around the mainshock hypocenter and 703
forms two prominent clusters consisting of the central and main clusters. The main cluster 704
bounded by possible reverse faults f4 and f3 seems to have been activated by the pre-existing 705
low-angle reverse faults, while the central cluster bounded by faults f1 and f2 is currently highly 706
active. The distributional pattern of both clusters in the rupture area appears to be separated by 707
fault-bounded crustal blocks, representing the deep rupture. The migrational patterns of the 708
hypocenter distribution indicate predominantly spatially linear to planar hypocenter distributions 709
in the first period, but quickly changes to parabolic then to spherical, acquiring a more spherical 710
spatial pattern in the last period. The location of the plane of aftershock distribution corresponds 711
to the upper crustal seismicity and the zonal correlation of hypocenter distribution from narrow to 712
wide suggests that the shape of the upper crustal block controls the spatial extent of the asperity 713
complex of the Van earthquake. The spatial and temporal distribution of aftershock sequence 714
with the observed clusters suggests that the hypocentral variation of seismic activity is not 715
unidirectional but very complex and highly clustered, consisting of the repeated formation of 716
small and large-sized clusters over brief time periods. 717
The most dense hypocenter activity occurs just beneath the mainshock area along the azimuth-718
dependent rotational projections. Only one, unique and larger cluster is observed in the 719
projections at 30 km depth. Depending on the azimuthal rotations, the distributional pattern of 720
this cluster ranges from the conical-shaped to the square-like narrow and widening volumetric 721
34 microseismicity and its spatial distribution can be observed in the rupture area. The spatial and 723
temporal distributional pattern of each microseismicity cluster represents the vertical migration of 724
the aftershock activity on an evolving subsidiary fault and indicates the nucleation point of the 725
failure between faults (f1 and f2) and the progressive failure of adjacent patches of the possible 726
fault. The west-east trending fault morphology hosting cluster forms part of the evolving fault 727
network in the rupture area. This cluster suggests the complex faulting behavior of the rupture 728
process both within and through the central cluster. 729
The results from the current study show that the observed spatial and temporal variations of the 730
Van aftershock sequence represent dynamic characteristics in the distribution of the spatial 731
hypocenter locations of events and related to significant changes in the local stress regime over a 732
three-year period. This indicates a rapid dynamic redistribution of stresses rather than their 733
gradual static increase, suggesting the azimuth-dependent spatial variations of the intraplate 734
seismic coupling along the distance versus the depth plots and anisotropic stress transfer through 735
the occurring events. This study provides valuable insight into the spatial and temporal 736
interaction of the Van aftershock events at various scales comparable to, or better than the 737
earthquake source dimensions. Hence, this analysis of the spatial and temporal characteristics of 738
the 2011 Van mainshock might a give a clue to understanding the seismogenesis in the area; 739
however, this approach to the Van rupture complexity is still lacking in terms of various stress 740
and strain sources. To improve our study, a promising approach is to undertake a high-resolution 741
spatial analysis of a much larger number of events and clusters including volcano-magmatic and 742
swarm activities. 743
35
Acknowledgments
745
The author thanks all the members of the Republic of Turkey Prime Ministry Disaster and 746
Emergency Management Authority (AFAD, Turkey), the National Earthquake Monitoring Center 747
(NEMC, Turkey) and the Kandilli Observatory and Earthquake Research Institute (KOERI, 748
Turkey) for providing the continuous seismological data (DDA catalogue and Sfile documents) 749
used in this study. The author is also grateful to; Prof. Dr. Ali Pınar (Boğaziçi University, 750
KOERI, Turkey), Prof. Dr. Şakir Şahin (Suleyman Demirel University, Turkey), Prof. Dr. Esa 751
Turunen, Prof. Dr. Elena Kozlovskaya (University of Oulu, Sodankylä Geophysical Observatory, 752
Finland) for help in providing the opportunity to use the earthquake data and the seismological 753
laboratory, Prof. Dr. G. Berkan Ecevitoğlu for providing the aftershock data monitoring 754
FORTRAN code and commenting on concluding remarks of this study. The author offers sincere 755
thanks to Prof. Dr. Sebastian Krastel (Kiel, Germany), the leader of the Lake Van Project seismic 756
survey, for providing the multi-channel seismic reflection profiles (International Continental 757
Drilling Program, ICDP-PaleoVan Project-2004 funded by Deutsche Forschungsgemeinschaft 758
collected from Lake Van basin. Also, the author offers his greatest thanks to the editors and the 759
two anonymous reviewers for their constructive comments and suggestions which helped 760
improve the manuscript. Some of the figures were generated by the Generic Mapping Tools 761
(GMT) code developed by Wessel and Smith (1998). 762
References
763
Altiner Y, Söhne W, Güney C, Perlt J, Wang R, Muzli M (2013) A geodetic study of the 23 764
October 2011 Van, Turkey earthquake. Tectonophysics 588:118-134. 765