Western University Western University
Scholarship@Western
Scholarship@Western
Electronic Thesis and Dissertation Repository
10-3-2016 12:00 AM
Uncertainty Analysis of the Performance of a System of Best
Uncertainty Analysis of the Performance of a System of Best
Management Practices for Achieving Phosphorus Load Reduction
Management Practices for Achieving Phosphorus Load Reduction
to Surface Waters
to Surface Waters
Jason D.M. IgrasThe University of Western Ontario Supervisor
Irena F. Creed
The University of Western Ontario Graduate Program in Geography
A thesis submitted in partial fulfillment of the requirements for the degree in Master of Science © Jason D.M. Igras 2016
Follow this and additional works at: https://ir.lib.uwo.ca/etd
Part of the Natural Resources Management and Policy Commons, Nature and Society Relations Commons, and the Water Resource Management Commons
Recommended Citation Recommended Citation
Igras, Jason D.M., "Uncertainty Analysis of the Performance of a System of Best Management Practices for Achieving Phosphorus Load Reduction to Surface Waters" (2016). Electronic Thesis and Dissertation Repository. 4227.
https://ir.lib.uwo.ca/etd/4227
This Dissertation/Thesis is brought to you for free and open access by Scholarship@Western. It has been accepted for inclusion in Electronic Thesis and Dissertation Repository by an authorized administrator of
Abstract and Keywords
The repeated occurrence of Lake Erie’s harmful algal blooms suggests an inadequate
phosphorus management system that results in excessive loads to the lake. In response,
Canadian and United States’ governments have issued a new management objective, a
40% reduction in total and dissolved reactive phosphorus loads relative to 2008. To
provide scientific evidence to guide managers toward achieving their management
objective, we used the International Standard of Organization (ISO) 31010 Bowtie Risk
Analysis Tool to analyze the performance of the phosphorus management system. The
effectiveness of agricultural best management practices (BMPs) and their adoption were
combined into a Bayesian belief network model to predict watershed performance of each
BMP. Then, the BMPs were analyzed for their probability of high risk phosphorus load
reduction and achieving the management objective. Trade-offs were observed among the
BMPs that will require decision makers to decide whether the management priority is to
achieve the 40% load reduction objectives, or prevent further increase in the proportion of
dissolved reactive phosphorus in the load, the identified culprit causing the repeated algal
blooms.
Co-Authorship Statement
This thesis will be reformatted for submission to an academic journal. Jason D.M. Igras
will be first author as he was responsible for writing the thesis and contributed to
conceptualizing the management approach, building the modeling structure, acquiring
and assimilating data to parameterize the model, and operating the model for simulations.
Irena F. Creed will be the second author as she was the primary editor of the thesis and
contributed to conceptualizing the management approach, building the model structure,
and validating its functional relevance to filling the management gap it was designed for.
Dedication
I dedicate this thesis to my Grandmother, Pauline, who, confined to a wheelchair for over
40 years, taught me that family is all you need to smile.
My Grandfather, Bill, for showing me what true and dedicated love looks like, in sickness
and health.
Thank you mother Averil, father Dave, Sister Mel and Brother Josh for always
encouraging me to pursue my passions, loving me for the weirdo I am, and pushing me to
always stay positive.
Finally, my teammate, world traveling partner and girlfriend Sara Martinali, who was
always available to support and push me; your encouragement contributed much to this
Acknowledgements
First and foremost, I acknowledge and appreciate Dr. Irena Creed for your supervision,
guidance, and big picture perspectives. I have always admired your ambition and passion
for research and feel privileged to have had the opportunity to work with you on forward
looking and adaptive science to move management in a sustainable direction. I come out
of this experience with a greater appreciation of science’s role in environmental policy.
Keep on inspiring and pushing your students to be better.
I would like to thank Dr. Adam Yates for taking on thesis advisory responsibilities,
providing me with feedback and a different research perspective. I truly appreciate your
positivity, patience and willingness to discuss my project in its infancy and bounce ideas
back and forth. I also enjoyed you as an instructor in the Riverine Monitoring course.
I would like to thank Dr. Katrina Laurent, who is without a doubt the most positive
person I have ever met. I want to acknowledge you taking on some supervision roles in
my thesis and just being a great teammate. Not only did I have a high level of respect for
you, but I did enjoy our partnership.
I would like to thank Roland Cormier for inspiring the initial research project, always
answering questions, clearing up concepts and providing a policy/management
perspective critical to my research. And, I would like to acknowledge Vanessa
Stelzenmüller and Ulrich Callies who developed a prototype of the Bayesian Belief
Network model structure during an ICES (International Council for the Exploration of the
Seas) workshop in Hamburg, Germany in March of 2015. To each of you, I appreciate
you making time for me and our project.
I would like to thank our government colleagues. First, Sandra Cooke and the Grand
River Conservation authority for always taking the time to answer emails with such
clarity and detailed explanation or referring me to different contacts within and beyond
the agency as well as being an active participant in our Great Lakes Risk Management
showing enthusiasm in what we are doing in our lab and willingly contributing data,
models and contacts to help answer the questions we had.
I appreciate the consultation and support from other academics including Dr. Margaret
Gitau for providing the BMP effectiveness database, Dr. Jill Crossman, Dr. George
Arhonditsis, Dr. Andrew Sharpley and Dr. Tom Bruulsema for answering emails at
length, providing data or pointing me in the right direction.
Finally, to all my lab colleagues for your support, contributions, encouragement and
positive attitude, this research was made possible by the team oriented dynamic in the
Table of Contents
Abstract and Keywords ... I
Co-Authorship Statement ... III
Dedication ... IV
Acknowledgements ... V
Table of Contents ... VII
List of Tables ... IX
List of Figures ... X
List of Abbreviations ... XII
Chapter 1: Introduction ... 1
1.1 Problem statement ... 1
1.2 Scientific justification ... 2
1.2.1 Lake Erie eutrophication and re-eutrophication ... 2
1.2.2 Phosphorus management... 3
1.2.3 A new policy objective for phosphorus load reduction ... 5
1.2.4 High risk uncertainty of phosphorus management ... 6
1.3 Thesis objectives and hypotheses ... 9
1.4 Thesis organization ... 10
Chapter 2: Test Area: The Grand River Watershed ... 11
2.1 Rationale for selecting the test area ... 11
2.2 Characterization of the Grand River Watershed, Ontario ... 11
2.3 Governance of phosphorus management in the Grand River Watershed ... 14
Chapter 3: Methods ... 16
3.1 Best management practices (BMPs) ... 16
3.2 Bayesian belief networks (BBNs) ... 18
3.2.1 Bayesian probability in Bayesian belief networks ... 20
3.3 Building the BBN model structure for phosphorus management ... 21
3.3.1 Estimating phosphorus loads from agricultural activities ... 24
3.3.2 Estimating probability distributions for BMP effectiveness ... 26
3.3.4 Calculating performance distributions for BMPs ... 28
3.3.5 Calculating residuals of phosphorus load after BMP implementation ... 29
3.3.6 Calculating probability distributions for discharged phosphorus loads ... 29
3.4 Sensitivity analysis of the phosphorus management system ... 30
3.5 Optimization of the phosphorus management system ... 30
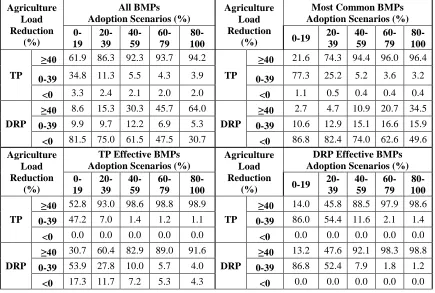
Chapter 4: Results ... 32
4.1 Performance of the phosphorus management system ... 32
4.1.1 Phosphorus loads ... 32
4.1.2 BMP effectiveness ... 32
4.1.3 BMP adoption ... 35
4.1.4 Sensitivity analysis and most influential BMPs ... 35
4.2 Achieving phosphorus objectives with optimized management strategies ... 37
Chapter 5: Discussion ... 42
5.1 Performance of existing phosphorus management system ... 42
5.1.1 BMP effectiveness and influence on phosphorus load reduction ... 42
5.2 Performance of the different phosphorus management strategies ... 44
5.2.1 TP reduction with traditional strategies ... 44
5.2.2 TP reduction with an alternative strategy ... 46
5.2.3 DRP reduction with traditional strategies ... 48
5.2.4 DRP reduction with alternative strategies ... 52
5.3 BBN suitability for management analysis and achieving objectives ... 53
Chapter 6: Conclusions ... 55
6.1 Scientific findings and management implications ... 55
6.2 Future research ... 57
References Cited ... 59
Appendices ... 70
Appendix A: BMP sub-models simulating 40−59% adoption ... 70
Appendix B: Summary statistics for BMP effectiveness ... 79
Appendix C: BBN model assumptions ... 80
List of Tables
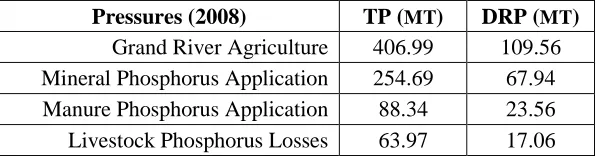
Table 4.1: Estimated phosphorus loads for mineral phosphorus application, manure phosphorus application and livestock phosphorus losses. [Based on data
reported in Maccoux et al. (2015), which was modified using data from the
Census of Agriculture (2006) together with manure P recoverability coefficients
from International Plant Nutrient Institute (2013)] ... 33
Table 4.2: Mean and standard deviation of the probability of percent phosphorus
load reduction. Positive values represent a decrease in phosphorus and negative
values represent an increase in phosphorus. The TP for crop rotation uses
particulate phosphorus data as TP data were not available. ... 34
Table 4.3: Summary ofBMP effectiveness with the probability of achieving <
0%, > 40%, and > 80% phosphorus load reductions by BMPs ... 35
Table 4.4: Sensitivity analysis of BMPs for reducing TP or DRP load. The larger the number the greater the relative influence of that node on residual TP and DRP
load at the pressure sequence output ... 36
Table 4.5: Optimization strategies for BMPs: (a) increased adoption for all BMPs; (b) increased adoption of the most common BMPs; (c) increased adoption
of BMPs effective for TP reduction; and (d) increased adoption of BMPs effective
for DRP reduction ... 38
Table B.1−8: Summary statistics with mean, standard deviation, minimum, maximum and number of data entries for (a) precision feeding, (b) nutrient
application management, (c) reduced tillage, (d) crop rotation, (e) contour strip
cropping, (f) vegetative filter strips, (g) forest filter strips, and (h) wetland
restoration. ... 79
List of Figures
Figure 1.1: TPloads to Lake Erie from 1967−2011. The Great Lakes Water Quality Agreement implemented the 11,000 MTA TP loading objective in 1972
that lead to decreases in TP load, eventually levelling off below the loading
objective in the late 1980s. The largest algal bloom in 2011 and the second largest
in 2008 occurred below the loading objective (Adapted from Scavia et al. 2014,
who used data from Dolan and Chapra, 2012). ... 4
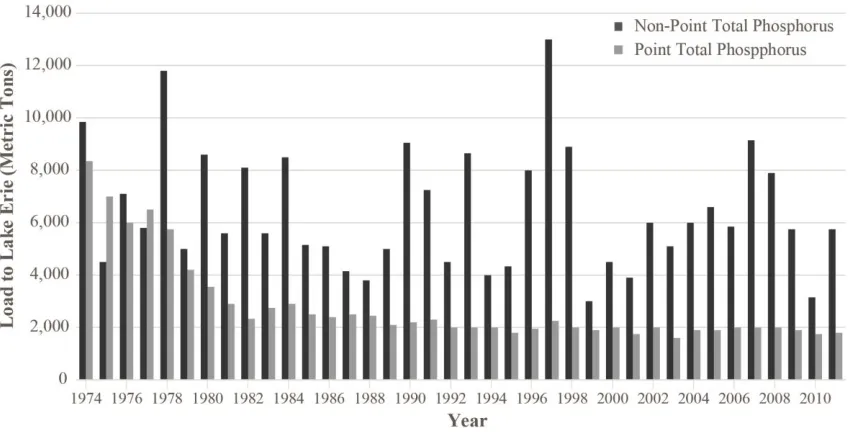
Figure 1.2: Point and non−point TP loads to Lake Erie from 1974−2011 (Baker et al. 2014). ... 4
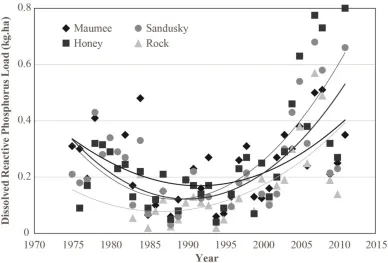
Figure 1.3: Trends in DRP loads from the Sandusky, Maumee and Raisin tributaries; DRP loads decrease in the 1970s and 1980s, but increase in the
mid-90s coincident with the peak of reduced tillage adoption (Kleinman et al. 2015,
with data from the International Joint Commission, 2014). ... 6
Figure 2.1: Grand River Watershed in Southern Ontario. ... 12
Figure 3.1: ISO 31010:2009 Bowtie Risk Analysis Tool evaluates the performance of a management system ... 21
Figure 3.2: BBN model structure for phosphorus management based on the left side of the Bowtie Risk Analysis Tool. ... 23
Figure A.1: Precision feeding. Effectiveness distributions for TP were based on
original data, and DRP were based on normal distribution. ... 71
Figure A.2: Nutrient application management. TP and DRP effectiveness were
based on a normal distribution. ... 72
Figure A.3: Reduced tillage. TP and DRP effectiveness were based on a normal
distribution. ... 73
Figure A.4: Crop rotation. TP and DRP effectiveness were based on a normal
distribution. ... 74
Figure A.5: Contour strip cropping. TP and DRP effectiveness were based on a
normal distribution. ... 75
Figure A.7: Forest filter strips. TP and DRP effectiveness were based on a normal distribution. ... 77
Figure A.8: Wetland restoration. TP and DRP effectiveness were based on the
List of Abbreviations
Pollutants:
DRP Dissolved reactive phosphorus
PP Particulate phosphorus
TP Total phosphorus
Best management practices:
BMP Best management practice
CR Crop rotation
CSC Contour strip cropping
FFS Forest filter strips (tree species)
NAM Nutrient application management
PF Precision feeding
RT Reduced tillage
VFS Vegetative filter strips (non-tree species)
WR Wetland restoration
Units:
km Kilometer
MT Metric tonnes
MTA Metric tonnes per annum
Other:
BBN Bayesian belief network
GLWQA Great Lakes Water Quality Agreement
GRCA Grand River Conservation Authority
Chapter 1: Introduction
1.1 Problem Statement
The Laurentian Great Lakes basin is home to a bi-national population of 48.5 million
inhabitants (Methot et al. 2015). The basin supports 25% of the combined Canada and
United States’ economy, where $344 billion in Canadian exports were directly dependent on the basin’s natural resources in 2011 (Campbell et al. 2015). Increasing population and
land use alterations with associated nutrient loads (particularly phosphorus) to the lakes,
caused localized eutrophication and nuisance algae hazards to nearshore areas throughout
the Great Lakes, with the problem most prevalent in Lake Erie. Total phosphorus (TP;
combining particulate and dissolved forms of phosphorus) management in the 1970s and
1980s had successfully reduced TP loads below the policy objective in most years since
the 1990s (Dolan and Chapra, 2012; Maccoux et al. 2016). However, eutrophication has
remerged as a crucial problem in large areas of Lake Erie, with nuisance algae again
threatening coastal dependent tourism, fish harvesting, property value, drinking water
supplies and other ecosystem services (Michalak et al. 2013; Scavia et al. 2014).
The re-eutrophication of Lake Erie, suggests ecosystem functions are changing such that
long-standing policy objectives are no longer reliable to prevent eutrophication and
related impacts. Evidence suggests the Great Lakes are vulnerable to climate change
(Bartolai et al. 2015), future populations will impose greater demand on the basin’s
resources (Methot et al. 2015) while a deficient management system is unable to prevent
threats to valued ecosystem services (Jetoo et al. 2015). In response, a 40% reduction in
TP and dissolved reactive phosphorus (DRP) loads relative to 2008 was recommended by
the Great Lakes Water Quality Agreement’s Annex 4 Nutrient Objectives and Targets
Task Team (2015). It appears urgent to re-visit Great Lakes management (Creed and
Laurent, 2015; Creed et al. 2016). There is a need to develop innovative and adaptive
tools to guide decision making to achieve the new phosphorus load reduction policy
1.2 Scientific Justification
1.2.1 Lake Erie Eutrophication and Re-eutrophication
The International Joint Commission (IJC, 2014) defines eutrophication as the “excessive
enrichment of freshwater with nutrients”. In an email survey distributed to limnology
experts worldwide by Downing et al. (2014), eutrophication was the most frequently cited
environmental problem in 2013 and the greatest problem predicted for 2023, having
socio-economic and environmental implications; a “wicked problem” that cannot be
solved, but can be managed (Thornton et al. 2013). Loading of nutrients prior to 1970,
especially phosphorus, from point sources like wastewater treatment plants and industry
and non-point sources from agriculture, led to the eutrophication of localized areas
around the Great Lakes. The phosphorus loads contributed to the proliferation of nuisance
algal blooms in Lake Erie that threatened the quality and quantity of ecosystem services
(Dolan and Chapra, 2012; Gidding et al. 2012; Michalak et al. 2013; Scavia et al. 2014).
The decline in Great Lakes’ ecosystem health triggered a bi-national movement to
manage environmental risks that led to the 1972 Great Lakes Water Quality Agreement
(the Agreement). The Agreement states in Article 3, General Objective vii that the waters
of the Great Lakes should “be free from nutrients that directly or indirectly enter the
water as a result of human activity, in amounts that promote growth of algae and
cyanobacteria that interfere with aquatic ecosystem health and human use of the
ecosystem”. The Agreement also implemented an 11,000 MTA TP load objective that
was achieved in the 1980s by regulations placed on phosphorus detergents, industry and
wastewater treatment facility upgrades, as well as the implementation of agricultural soil
conservation practices, such as nutrient application management that spatially and
temporally targets fertilizer application (Richards and Baker, 2002; Sharpley et al. 2012).
Following TP load management in the 1980s, Lake Erie’s “rapid and profound ecological
In a study that calculated trends in TP loads to Lake Erie, Dolan and Chapra (2012)
reported the TP load objective was exceeded just four times between 1994 and 2008,
re-affirmed in a recent study by Maccoux et al. (2016). Despite the successful environmental
management of TP load in past decades, scientific literature suggests Lake Erie is
experiencing a re-eutrophication (Baker et al. 2014, Scavia et al. 2014). In 2008, Lake
Erie experienced the second largest algal bloom in history, only to be succeeded three
years later by an algal bloom three times the size with an areal extent greater than
5,000 𝑘𝑚2 (IJC, 2014; Michalak et al. 2013). These algal events both occurred in years
when the TP load to the lake was below the policy objective (Figure 1.1) (Dolan and
Chapra, 2012). Repeated eutrophication events, occurring within the limitations of the TP
load objective, suggests the objective is no longer effective at meeting the Agreement’s
General Objectives, and those specifically of the Annex 4 for nutrients.
Gakstatter et al. (1978) showed if point sources were eradicated, 72−82% of United
States’ eutrophic lakes would still require management of non-point phosphorus sources
to meet water quality objectives. Scavia et al. (2014) similarly showed that even with
eradication of point sources in the Lake Erie basin, non-point sources would still require
additional management to reduce central basin hypoxia to acceptable levels in compliance
with relevant policy objectives. Baker et al. (2014) showed significant annual variability
in TP load from non-point sources compared to point sources that suggest ineffective
management and/or the influence of external environmental factors like climate change
(Figure 1.2). With 63% of Lake Erie’s catchment contributing non-point P from
agricultural human activities, the IJC (2014) has identified farming not only as a driver of
eutrophication but also a potential solution.
1.2.2 Phosphorus management
The most significant proportion of TP discharged from agricultural tributaries has
traditionally been the fraction sorbed to sediments (particulate phosphorus, PP) (Richards
et al. 2008; Panuska and Karthikeyan, 2010; Coelho et al. 2012). Management of
non-point agricultural sources has therefore focused on PP reduction to achieve the TP policy
Figure 1.1: TPloads to Lake Erie from 1967−2011. The Great Lakes Water Quality Agreement implemented the 11,000 MTA TP loading objective (grey dashed line) in 1972 that lead to decreases in TP load that levelled off below the loading objective in the late 1980s. The largest algal bloom in 2011 and the second largest in 2008 occurred below the loading objective (Adapted from Scavia et al. 2014, who used data from Dolan and Chapra, 2012).
Figure 1.2: Point and non-point TP loads to Lake Erie from 1974−2011 (Baker et al. 2014).
Sharpley et al. (2012) showed a substantial 75% decline in TP load (1975−1995) from
reduction was achieved by voluntary implementation of best management practices
(BMPs), specifically nutrient application management to meet crop requirements and soil
conservation practices to prevent soil erosion and PP transport from farms. These declines
are also described by Dolan and Chapra (2012) and Maccoux et al. (2016) for the Lake
Erie basin. At the same time, Sharpley et al. (2012) described a 50% reduction in DRP
load, the fraction of TP that is in dissolved form and almost 100% biologically available,
and therefore, easily accessible for algae proliferation (Baker et al. 2014). This
undoubtedly contributed to the “rapid and profound ecological response” of Lake Erie in
the 1980s described by Michalak et al. (2013). However, despite the reductions, a
substantial upward trend in DRP load followed in the mid−1990s (Figure 1.3),
simultaneous with the peak adoption of reduced tillage (Richards and Baker, 2002;
Sharpley et al. 2012) and tile drainage (King et al. 2015; Kleinman et al. 2015; Lamba et
al. 2009; Molder et al. 2015; Statistics Canada, 2006). Many criticize traditional TP
management for contributing increased DRP load, causing unintended consequences
(Dodd and Sharpley, 2016) including the re-eutrophication of Lake Erie (Scavia et al.
2014). However, this criticism has been met with mixed support from the agricultural
community, watershed managers and scientist’s alike (Kleinman et al. 2015). Although
traditional soil conservation management has been successful at achieving TP load
objectives (Dolan and Chapra, 2012; Sharpley et al. 2012), the management of DRP load
from non-point agricultural landscapes has proven a more complex challenge with
reductions highly variable and the potential for load increases a priority concern
(Sharpley, 2016).
1.2.3 A new policy objective for phosphorus load reduction
With Lake Erie returning to a eutrophic state and threatening to compromise valued
ecosystem services, governments from Canada and the United States have once again
mobilized to tackle the issue from a perspective that considers both TP and DRP
management. The Annex 4 Nutrient Objectives and Targets Task Team (2015) (Task
Team) was assembled to recommend policy objectives for reducing the probability of
Lake Erie cyanobacteria algal blooms. Based on tributary loading and in-lake
Figure 1.3: Trends in DRP loads from the Sandusky, Maumee and Raisin tributaries; DRP loads decrease in the 1970s and 1980s, but increase in the mid−90s coincident with the peak of reduced tillage adoption (Kleinman et al. 2015, with data from the
International Joint Commission, 2014).
load relative to 2008 from all western basin tributaries and the Thames River. This
reduction was recommended to achieve a 90% annual probability of causing western
basin cyanobacteria bloom no greater than those observed in 2004 and 2012. To achieve
the policy objective, the performance of the system of phosphorus management measures
for reducing loads needs to be analyzed and then improved (Creed et al. 2016).
1.2.4 High risk uncertainty of phosphorus management
Agriculture and its contribution to non-point phosphorus loads to aquatic ecosystems can
be managed by regulatory measures (i.e., the 2006 Nutrient Management Act) or
voluntary measures. In Ontario, agricultural Best Management Practices (BMPs) are
farming methods that are voluntarily implemented by the farm operation and farm
operators. This thesis focused on BMPs for environmental conservation, specifically
methods only qualify as “best” management practices when approved by a team of
researchers, farmers, extension staff and agribusiness professionals (Ontario Ministry
Agriculture Food and Rural Affairs, 2014). Europe relies predominantly on regulatory
strategies, whereas North America and the Great Lakes region relies more on voluntary
strategies such as BMPs (Kleinman et al. 2015). Both suffer from a lack of research and
relevant data, and therefore anticipating management outcomes is uncertain (Kleinman et
al. 2015).
One way to measure effectiveness of a management measure is to examine the percent of
pollutant or contaminant load that is reduced by the management measure. In the Great
Lakes, Chesapeake Bay and other agricultural basins in North America, the effectiveness
of BMPs has been a considerable focus of science and management initiatives (Kleinman
et al. 2009; McElmurry et al. 2013), but clear trends in BMP effectiveness remain
uncertain (Dodd and Sharpley, 2016; Sharpley et al. 2009), as there is considerable
variation in TP and DRP load reductions by individual BMPs (Dodd and Sharpley, 2016;
Gitau et al. 2005; McElmurry et al. 2013).
Dillaha et al. (1989) examined the effectiveness of vegetative filter strips (VFSs) for
reducing nutrient pollution from cropland; their effectiveness ranged from 35 to 95%
reduction for TP and from −258 to 79% reduction for DRP, indicating an overall
reduction in TP load but a possible increase in DRP. Similar variation in VFS
effectiveness for TP and DRP load reduction was reported in other studies
(Blanco-Canqui et al. 2004; Chaubey et al. 1994; Daniels and Gilliam, 1996; Lee et al. 2000; Lee
et al. 2003; Schmit et al. 1999). Uncertainty exists with other BMPs, Gitau et al. (2005)
reported phosphorus load reductions for contour strip cropping (CSC) to range between
8−93% for TP and 20−93% for DRP. Schreiber and Cullen (1998) reported that reduced
tillage (RT) reduced TP loads by 59%, however a 390% increase in DRP loads was also
observed. Koskiaho et al. (2003) reported wetland restoration (WR) and construction or,
gully plug installation, resulted in −6−67% reduction in TP load and −33−33%
reduction in DRP load. A review of wetlands worldwide by Fisher and Acreman (2004)
showed effectiveness to range from 50 to 90% for TP load and 25 to 95% for DRP load.
anticipating their effect prior to implementation and therefore creates risk of failing to
achieve policy objectives.
Current management approaches favour the adoption of BMPs that effectively manage
TP, but are variable in their effectiveness to manage DRP with potential for antagonistic
effects. For example, in the Lake Erie basin, RT (combining conservation tillage and
no-tillage) has gained considerable adoption by the Great Lakes States (Kleinman et al.
2015) and Ontario farm operations (Statistics Canada 2006; Lamba et al. 2009; Molder et
al. 2015). RT is designed for sediment conservation and, although effective for TP
reduction for its retention of the PP fraction, some studies have reported increased DRP
loads partly responsible for the recent re-eutrophication (McElmurry et al. 2013; Scavia et
al. 2014; Smith et al. 2015). In addition, tile drainage, a BMP to increase crop biomass
and economic return (not an environmental conservation BMP) through water table
management, has also been advocated for additional benefits as an indirect BMP for
phosphorus load reduction by preventing surface runoff causing erosion and the transport
of PP. Tile drainage has also gained considerable adoption in Lake Erie tributaries and
have received similar criticisms for increased DRP load (King et al. 2015). The literature
seems to indicate trade-offs for targeting soil conservation methods that further enhance
the uncertainty of the management system for DRP management and preventing
eutrophication in Lake Erie.
Consideration of site-specific attributes like slope, soil type, weather and climate is often
suggested to better predict effectiveness of BMPs prior to their implementation (Baker
and Johnson, 1983; Dodd and Sharpley 2016; Geng et al. 2015). Gitau et al. (2005)
developed a simple tool for estimating BMP effectiveness based on a synthesis of data
found in scientific literature focused on the United States. Slope, soil type and study
location attributes gathered from reviewed studies were populated into lookup tables and
used to query TP, PP and DRP reduction predictions for BMPs. Geng et al. (2015)
developed the same tool for application in China. The simplicity of these prediction tools
is a major benefit, however, if the tool operator attempts to predict effectiveness for a
BMP where data are lacking for location, soil and/or slope variables, the tool does not
estimations (Gitau et al. 2005), limiting its general application. These tools draw attention
to the lack of region-specific BMP effectiveness data, an observation also reported in a
review of BMPs for application in the Great Lakes basin by McElmurry et al. (2013) and
is consistent with observations for the United States, United Kingdom and Sweden
(Kleinman et al. 2015).
The broad ranges in BMP effectiveness for reducing phosphorus loads produces
considerable risk for achieving policy objectives. This risk is greater because of the
potential for some BMPs to reduce TP but increase DRP, thereby increasing the
likelihood of eutrophication events. Dodd and Sharpley (2016) emphasize these
“unintended consequences” of BMP implementation despite best intentions. Without
better predictions of anticipated BMP effectiveness prior to implementation, achieving
water quality objectives in agricultural tributaries of the Great Lakes may be a “shot in the dark”, with the potential to exasperate eutrophication risk and its impacts (Dodd and
Sharpley 2015; Sharpley et al. 2009; Smith et al. 2015). For Lake Erie tributaries to
achieve their TP and DRP load reduction objectives while reducing the uncertainty of
alternative high risk load scenarios, simple tools are needed that can identify strengths
and weaknesses as well as gaps and redundancies in the management system, and that can
communicate the uncertainty of alternative management outcomes to decision makers.
1.3 Thesis objectives and hypotheses
The goal of this thesis was to contribute further knowledge into phosphorus management
methods and the performance of the system of voluntary management measures in place
for reduction of phosphorus loads to the Great Lakes. The first objective was to develop a
novel approach that quantifies the probability of TP and DRP load reduction and
accommodates management uncertainty with different agricultural BMPs individually
and as an integrated management system. The second objective was to implement the
approach to optimize BMP management strategies for reducing the uncertainty of
achieving the 40% load reduction objectives in the Grand River watershed of southern
Ontario. Considering current BMPs are designed for soil conservation (Dodd and
BMPs is the most suitable strategy for achieving the TP objective but increases the risk of
elevated DRP loads; and (2) adoption of DRP effective BMPs is the optimal strategy to
simultaneously achieve both TP and DRP reduction objectives.
To achieve the thesis objectives and test the hypotheses, we developed a Bayesian belief
network model to simulate the probability of TP and DRP load reductions by agricultural
BMPs, individually and collectively as a management system. This relied on data
compiled from BMP effectiveness studies and databases, which were used to determine
the optimal BMP management strategy to increase probability of achieving the 40% TP
and DRP load reduction policy objective while managing the uncertainty of alternative
high risk loading scenarios. We applied our Bayesian belief network model to the Grand
River watershed in southern Ontario, Canada.
1.4 Thesis organization
This thesis is written as a monograph. Chapter 1 presents the problem statement, a
scientific justification for researching the problem, and thesis objectives and hypotheses.
Chapter 2 details the study area where the model is applied, including the sources of
phosphorus and the governing authorities with influence on phosphorus management for
load reduction to Lake Erie. Chapter 3 describes the Bayesian belief network model and
its application to quantify the probability of TP and DRP loads from agricultural activities
in the Grand River to Lake Erie, and the simulation of different BMP management
strategies for achieving the 40% TP and DRP load reduction policy objective. Chapter 4
presents the scientific findings related to the quantification of TP and DRP loads from
agriculture, the effectiveness of individual and combined BMPs, and the probability of
achieving the policy objective of a 40% reduction in TP and DRP loads under different
management scenarios and hypothesis outcomes. Chapter 5 discusses the scientific
findings within the context of current and past literature studies and implications for
phosphorus management. Chapter 6 provides a conclusion to the thesis with implications
for Great Lakes phosphorus management and identifies opportunities of future research to
Chapter 2: Test Area: The Grand River Watershed
2.1 Rationale for selecting the Grand River Watershed Test Area
The IJC identified agriculture not only as the source of re-eutrophication in Lake Erie but
also a solution (IJC, 2014). Specifically, the Annex 4 Nutrient Objectives and Targets
Task Team (2015) identifies the Grand River as a priority watershed for continued and
enhanced management and monitoring of phosphorus loads to avoid proliferation of
nuisance algae, primarily Cladophora sp. in the eastern basin’s nearshore areas. In
addition, the Grand River Conservation Authority (GRCA) is considered an agency with
an abundance of relevant data available to support this thesis, relative to comparable Lake
Erie watersheds. Applying the recommended 40% reduction in phosphorus load intended
for western basin tributaries to the lower risk but data rich eastern basin is suitable to
demonstrate the implementation of our approach to manage TP and DRP loads for
achieving policy objectives. For these reasons, the Grand River watershed in southern
Ontario, Canada was selected as a suitable test area for the thesis.
2.2 Characterization of the Grand River Watershed, Ontario
The Grand River watershed covers an area of 6,800 km2 of southern Ontario (Figure 2.1)
and flows from its northern headwaters in a cool temperate climate region, 535 m.a.s.l.
near Orangeville, Ontario, to its southern outlet south of Brantford discharging into Lake
Erie’s eastern basin in a moderate temperature climate region at 173 m.a.s.l.
Seasonality in the Grand River watershed is characteristic of southern Ontario, with high
precipitation and increasing temperature in the spring causing accumulated snow melt to
runoff over thawing, impermeable soils that produce large flows with dispersed flooding.
Temperatures peak in the summer months when precipitation is low and
evapotranspiration is high, resulting in drought-like conditions and hydrologic flows
confined to the low flow channel. With reduced water quantity flowing through the
have low precipitation but increased flows attributed to declining evapotranspiration and
lower water withdrawal demands.
Figure 2.1: Grand River Watershed in Southern Ontario.
In the winter months, temperatures reach annual lows and precipitation falls as snow. The
cold temperatures have many implications on Grand River watershed hydrology with
lower flows and frozen soils. The frozen soils decrease soil porosity and infiltration
capacity causing increased runoff and transport of nutrients from uplands to receiving
surface water during winter rains expected to become more frequent with climate change
(LSPRTT, 2008). Average monthly temperatures ranges from -9°C in January to 21°C in
July. Temperature extremes have been reported as low as -35°C and as high as 40°C.
The Grand River watershed physiography is heavily influenced by the glacial retreat
nearly 13,000 years ago. The quaternary geology is distributed into three regions that
pose different implications for the transport of nutrients to receiving surface waters. The
region hosts higher relief and permeability in its courser grained, sand and gravel
moraines. The southern region experiences lower relief and permeability like the northern
region with surface lacustrine clays. Two major tributaries, the Nith and Conestogo, drain
much of the north-western contributing area and the Speed tributary drains much of the
eastern contributing area with smaller tributaries draining what remains to the main stem
of the Grand River (LSPRTT, 2008).
According to the Watershed Characterization Report (LSPRTT, 2008), a minimum of
30% vegetation cover is required to maintain the ecological functioning of a watershed.
The Grand River watershed has 19% vegetation cover from natural forests, leaving it
vulnerable to increased flows and nutrient export (GRCA, 2013). The vegetation cover
and specifically forest cover continues to be threatened by urbanization, agriculture,
invasive species and now climate change (LSPRTT, 2008). There are 38 upper and lower
tier municipalities within the watershed where a total population of 821,000 reside. Of the
total population, 73.5% are centralized in the urban municipalities of Brantford,
Cambridge, Kitchener, Waterloo and Guelph, an area representing just 7% of the
watershed. The remaining 26.5% of the population lives in smaller towns and rural areas.
Projections into 2031 show significant population growth in major urban centers as well
as rural areas like Wellington and Brant Counties. This trend is an expectation of the
rising costs of living in Toronto and the lateral urban growth restrictions posed by the
Green Belt Act (2005) that surrounds the metropolis of the Greater Toronto Area
(Hemson Consulting Limited, 2005).
The most extensive land-use in the Grand River watershed is agriculture at 75% of the
watershed area. Agricultural areas of the Grand River watershed are a significant source
of phosphorus to Lake Erie’s eastern basin and nearshore (Annex 4 Objectives and
Targets Task Team, 2015; Maccoux et al. 2015). Agricultural activities include
approximately 6,400 farms divided between livestock, crop, or combined operations.
Most crop agriculture produces crops necessary to support livestock operations with feed.
According to the Lake Erie Source Protection Region Technical Team (2008) (LSPRTT),
crop agriculture is divided into 29.1% corn, 24.9% hay for forage and fodder, 20.7%
2006 Census of Agriculture (Statistics Canada, 2006) reports that livestock is divided into
approximately 290,000 head of cattle, 500,000 head of swine and 8,800,000 head of
poultry. The 2006 Census of Agriculture is relatively dated, however in the context of the
policy objective for a 40% reduction relative to 2008, 2006 is a reasonable source year.
Livestock is a significant source of nutrients from: (1) the manure that is either lost in
runoff or applied to crop as a fertilizer; and (2) the application of mineral fertilizers to
crops to support livestock feeding as well. In addition, the higher clay content and thus
lower permeability in the agriculturally dominant northern and southern regions result in
enhanced overland flow, that rapidly transports water and phosphorus to nearby surface
water systems (LSPRTT, 2008).
2.3 Governance of phosphorus management in the Grand River
Watershed
The management of phosphorus is a collective, yet disorganized, effort by different
governing agencies whose jurisdictions extend beyond the topographic confinements of
the watershed (Friedman et al. 2015). For phosphorus management in the Grand River
watershed, the governing authorities range from local counties and municipalities, to
provincial, federal and even bi-national agencies. The IJC is considered the over-arching
bi-national governance authority for the Great Lakes basin responsible for the Great
Lakes Water Quality Agreement and delegating responsibility to other authorities for its
implementation. At the federal level, the most relevant governance agencies are,
Agriculture and Agri-Food Canada (2015) who work with farmers and food producers to
grow the industry and help farmers achieve their social and economic objectives.
Environment and Climate Change Canada (2013a, 2013b) is responsible for research on
environmental quality with initiatives directed toward agriculture, their land use and
ecosystems to understand their impact on water quality and develop programs to manage
these pressures with Acts like the Environment Protection Act 1999 to guide land
At the provincial level, relevant agencies include the Ontario Ministry of Agriculture,
Food and Rural Affairs (2016) who are responsible for developing programs to advertise
and educate farmers on the use of nutrient management practices as well as implementing
Acts like the Nutrient Management Act 2002 to prevent nutrient effects and resulting
impacts in surface waters. The Ontario Ministry of the Environment and Climate Change
(2016) is responsible for developing policies, acts, and regulations through research and
ensure compliance to protect the environment and its waters. They implement Acts like
the Great Lakes Protection Act 2015 and the Clean Water Act 2006.
However, the Grand River Conservation Authority (GRCA) is the primary authority for
watershed management of water quantity and quality under the Conservation Authorities
Act (1990). Within the Grand River watershed, the 38 upper and lower tier municipalities
have varying degrees of responsibility that influence agricultural practices and water
quality in their jurisdictions (LSPRTT, 2008). Each of these authorities impose different
policies with regulatory measures, offer incentives to encourage adoption of voluntary
measures, as well as provide channels to communicate and educate farmers on the
implications of their operation for water quality.
In addition to governing authorities, other organizations influence agricultural activities
and farmer decisions including organizations like the Ontario Federation of Agriculture
(2016) which is a farmer run, volunteer organization (among others) that acts as the voice
for farmers and their families and provides an information resource on relevant nutrient
Chapter 3: Methods
3.1 Best management practices (BMPs)
The BMPs considered in this thesis were selected based on available data and their
suitability for application in the Grand River watershed. Due to limited data availability,
some BMPs were combined into one based on their similar design and function.
Precision feeding (PF) customizes livestock diets to the individual animal’s nutritional
requirements (OMAFRA, 2011). Conventional feeding diets are implemented to
maximize livestock quality for market sale and is often the same diet for the entire herd as
opposed to the individual animal, however, this conventional method often provides more
phosphorus than required which is then excreted as excess in manure (Pomar et al. 2011).
By tailoring diets to individual livestock needs, the amount of phosphorus excreted in
manure can be reduced on livestock operations and crop operations where it is applied.
Nutrient application management (NAM) implements one or all the following: applying
phosphorus in the right form, at the right rate to meet crop requirements, at the right
timing to avoid runoff from precipitation events, and with the right method of application
to reduce phosphorus availability for runoff (OMAFRA, 2011). Implementing these
practices in combination is called the 4Rs of nutrient stewardship; right source, right rate,
right time and right method (Mikkelsen, 2011).
The BMP of reduced tillage (RT) combined both no tillage and conservation or “mulch”
tillage. In no-till operations, the soil remains undisturbed prior to seeding, allowing the
soil structure to develop and maintain crop residue on the surface to increase surface
roughness and decrease overland flow. Conservation tillage or “mulch” tillage only
partially tills the surface, incorporating crop residue into the soil leaving approximately
30% on the surface. Alternatively, conservation tillage is conventionally tilled once every
three years (OMAFRA, 2011). RT allows soils to develop structure reducing their
vulnerability to erosion and transportation of phosphorus that is sorbed to sediments. By
in runoff (Doran, 1980). The context and implications for grouping similar functioning
BMPs is discussed in section 3.3.2 and in Table C.1.
Crop rotation (CR) involves seeding the soil with a different crop family in alternating
years to increase nutrient uptake, and reduce soil degradation and vulnerability to erosion
and transport of PP (OMAFRA, 2011). No relevant data was found for TP and therefore
we defaulted to PP data based on it being traditionally the largest fraction of TP (Baker et
al. 2014).
Contour strip cropping (CSC) involves alternating bands of crop species (row crops and
forage or cereals) planted parallel to field contours to reduce vulnerability of soil erosion
and transport of phosphorus in runoff (Ontario Ministry of Agriculture, Food and Rural
Affairs, 2011).
Vegetative filter strips (VFS) require land that is taken out of production to allow
permanent vegetative cover to develop along hydrological flow paths or surround surface
water conduits (OMAFRA, 2011). VFSs increase surface roughness and decrease
overland flow of runoff passing through, allowing runoff and nutrients in runoff to
infiltrate the soil and be retained (Zhang et al. 2010).
Forest filter strips (FFS) are functionally identical to VFS, but with trees rather than
grasses or shrubs. The root systems of trees further increase soil infiltration relative to
VFSs and their far-reaching roots have a greater ability to uptake nutrients from the soil
thereby reducing their accumulation in the soil (Kleinman et al. 2009).
Wetland restoration and construction (WR) were combined into one BMP. Wetlands can
be restored or constructed in topographic depressions on farm operations to purify runoff
waters through phosphorus sorption in wetland sediments or through biological uptake in
plants or microorganisms (OMAFRA, 2011).
Tile drainage is implemented considerably in agricultural areas of the Grand River
watershed, exceeding 30% by area in a few sub-watersheds (Grand River Watershed
Management Plan, 2013) even though it is controversial in terms of its benefits to reduce
and crop production BMP advocated for additional soil and phosphorus reduction
benefits, however it has been criticized for facilitating DRP transport from farm
operations and may be one of the factors contributing to the recent re-eutrophication of
Lake Erie (King et al. 2015; Scavia et al. 2014). Unfortunately, despite relatively
considerable research, a lack of ‘relevant’ BMP effectiveness coefficient data as well as
relevant experts being uncomfortable providing an opinion due to considerable
uncertainty, tile drainage had to be eliminated from the analyses.
3.2 Bayesian Belief Networks (BBNs)
Bayesian belief networks (BBN) are conditional probability, cause-and-effect models
with output distributions that communicate model and scenario uncertainty to decision
makers. They consist of an interacting network of variables called nodes and each node
represents a different ecosystem predictor and response variable connected by arrows that
characterize their relationship to other nodes in the network like an influence diagram.
Input nodes to the BBN network (nodes with no parents) have states whose probability of
being observed are quantified using empirical data or expert opinion where data are
lacking. Intermediate nodes have conditional probability distributions, where the
probability of observing each state is conditional on the probability of each state of their
parent nodes (Landuyt et al. 2013). Empirical equations are used to quantify the
probabilistic relationship of each state in these child nodes based on the probability of
each state in their parent nodes. If empirical equations do not exist to characterize the
relationship, expert opinion can be consulted. Finally, output nodes are joint probability
distributions representing the different possible outcomes based on the intermediate and
input nodes. The probability of each state in each node is communicated as a percent and
a bar graph (belief bar), with all states in the node and their belief bars combining to form
a probability distribution (Marcot et al. 2006).
The benefits of BBNs include their ability to incorporate expert opinion when empirical
data are lacking (Landuyt et al. 2013; Nash and Hannah, 2011). BBNs can be easily
updated as science develops or environmental conditions change, enhancing its suitability
2013). Furthermore, BBNs enable transparency that leads to better communication
between scientists and ecosystem managers (Allen et al. 2012; McCann et al. 2006;
McDowell et al. 2009; Quinn et al. 2013). Often decision makers rely on a single
deterministic value and do not consider the uncertainty with other possible outcomes, in
BBNs, uncertainty is communicated to decision makers by providing a probability
distribution of possible outcomes (Barton et al. 2008; McDowell et al. 2009; Rigosi et al.
2015). Marcot et al. (2006) advised against BBN models that are too large with too many
intermediate nodes that separate input nodes from the model output node. The influence
of nodes higher up in the network becomes considerably supressed relative to nodes
closer to the model output.
BBNs have been previously applied in ecosystem management (Landuyt et al. 2013;
McCann et al. 2007). Of particular interest for this thesis is the demonstrated ability of
BBNs to predict the probable influence of different agricultural BMPs on phosphorus
loads (Barton et al. 2008; Lucci et al. 2014; McVittie et al. 2015; Nash and Hannah
2011), as well as predicting the risk of failure to achieve policy objectives (Gudimov et
al. 2012; Stow et al. 2014). To our knowledge, BBNs have not integrated both analysis
objectives; predicting the probability of phosphorus load reduction by BMPs and their
probable influence as a management system on achieving policy objectives, such as the
40% reduction in 2008 TP and DRP loads to Lake Erie. We used BBNs to quantify the
probability of achieving the load reduction policy objective from Grand River
agricultural areas only, given the initial 2008 TP and DRP load from agricultural
activities, the probability distributions of BMP effectiveness, and different BMP
management strategies and rates of increased adoption relative to 2008.
3.2.1 Bayesian probability in Bayesian belief networks
The classical, or frequentist approach to statistics interprets probabilities as the relative
frequency of outcomes from a long series of identical experiments or trials (VanderPlas,
2014). When estimating the probability of phosphorus load reduction by a BMP or a
management system of BMPs in the Grand River watershed, it is impossible to conduct a
long series of identical management system experiments and therefore the classical
Bayesian statistics interprets probabilities as our own, subjective, beliefs about a
parameter of interest with the uncertainty of our belief communicated with a probability
distribution (VanderPlas, 2014). We can update our beliefs, called ‘belief updating’ using
Bayes theorem, the mathematical theory underlying the operation of BBNs (Parent and
Rivot, 2012) in equation (1):
𝑃(𝐴|𝐵) = 𝑃(𝐵|𝐴)𝑃(𝐴) 𝑃(𝐵)
Equation 1
In Bayes theorem, the parameter of interest to be estimated is the posterior distribution,
denoted P(A|B). The posterior distribution is a conditional probability statement that
estimates the true probability distribution of A, given or conditional on some new data we
observed; B (VanderPlas, 2014). This could be the estimated true probability distribution
for watershed phosphorus load reduction by a BMP, given some new observed data. The
initial, subjective belief about the posterior distribution, before new collected data is
observed, is represented by P(A), known as the prior distribution in Bayes theorem and
could be based on previous data (VanderPlas, 2014). Bayes theorem is used for belief
updating of the prior distribution to incorporate new data represented by P(B|A). In this
way, Bayes theorem is subjective, the cause for so much criticism by classical
frequentists who suggest statistics should be unbiased (VanderPlas, 2014). Therefore, the
prior distribution could represent the current belief about watershed phosphorus load
reduction by a BMP, and the posterior distribution is the updated belief that incorporates
the new data. The variable P(B) in Bayes theorem is a normalization constant that ensures
the posterior distribution is estimated between 0-1 (VanderPlas, 2014).
In BBN models, the probability distributions for input nodes are estimated from empirical
data or expert opinion and represent prior distributions. The probability distribution in
intermediate nodes are conditional on the distribution of their parent, input nodes that can
be updated by changing the distribution of one or multiple parent nodes with new findings
or data. In this way, the posterior distribution, P(A|B), in the intermediate child node is an
updated belief, conditional on the prior distribution, P(A), in the unchanged parent
updating in BBNs is why scientists have advocated its use adaptive management (Marcot
et al. 2006).
3.3 Building the BBN model structure for phosphorus management
Building and quantifying the BBN model required making assumptions (Table C.1) that
differ from true environmental and human behaviour, and should be considered when
interpreting the results of this thesis. The structure of the BBN model was inspired by the
International Organization for Standardization (ISO) 31010:2009 Bowtie Risk Analysis
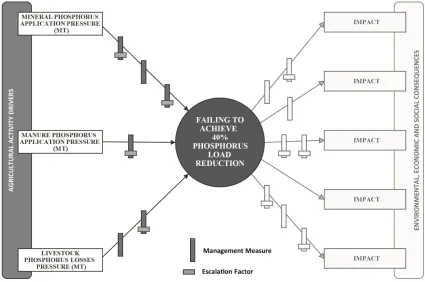
Tool (BRAT) (Figure 3.1), which diagrammatically analyzes the causal pathway of a risk
event (the effect), from its pressures leading to the risk event, and the impacts that could
result from the risk event, while incorporating the influence of intervening preventative
and mitigation management measures (Creed et al. 2016). Drivers are the social, cultural,
economic, and political influences that drive human activities like agricultural operations.
Pressures result from human activities that introduce physical, chemical (like
phosphorus), or biological agents into the ecosystem that could cause undesirable effects.
Effects are the risk event that result from the residual pressures after the implemented
preventive management measures. Impacts describe a reduction in the quality and/or
quantity of ecosystem services that might occur if the effect is not mitigated.
Consequences are the economic, environmental and social implications that result from
the impacts. The management system includes prevention measures that act to reduce the
likelihood of pressures causing the effect, and mitigation measures that reduce the
severity of impacts (Creed et al. 2016). Escalation factors are outside influences that
undermine the effectiveness of prevention or mitigation measures, but their consideration
was beyond the scope of this thesis.
For this thesis, the BBN model structure was based on the preventative, left side of the
BRAT only, with the risk event being the failure to achieve the 40% reduction in 2008 TP
and DRP loads to Lake Erie objective (Figure 3.1). Norsys Netica 5.24 (Norsys Software
Corp. 2016) for Bayes Nets software was used to build and operate the model. The BBN
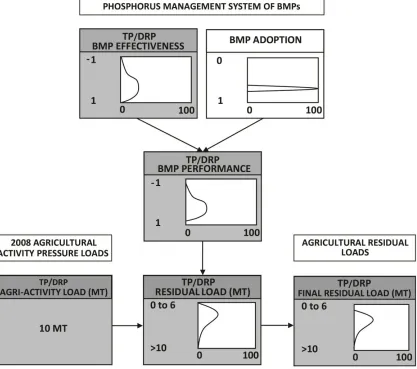
model structure incorporated four main components (Figure 3.2). First, (1) input nodes
for 2008 TP and DRP load from agricultural activity pressures, (2) output risk event
(effect) nodes that represented the final residual TP and DRP load discharged from the
Grand River watershed, (3) the BMP sub-models aligned in sequence to collectively
reduce the 2008 agricultural activity TP and DRP input loads and, (4) residual TP and
DRP load nodes that tracked the amount of TP and DRP load as it was influenced by each
BMP sub-model (Figure 3.2). Loads were indicated as constants in MT, adoption as
probability distribution in proportions from 0−1 (0−100% adoption) and effectiveness
and performance as probability distributions in proportions (representing percent
reduction).
Three agricultural activities that contribute TP and DRP loads were identified for input
pressure nodes: (1) cropland mineral phosphorus application; (2) cropland manure
phosphorus application; and (3) livestock manure phosphorus losses, each agricultural
In the BMP sub-models, BMP effectiveness referred to the ‘local’ TP and DRP load
reductions by a BMP on a single farm operation and assumed 100% of the operation’s
hydrological flow path is treated by the BMP (Table C.1). BMP adoption referred to the
percent of the hydrological flow path in agricultural areas of the watershed that is treated
by the BMP. BMP performance referred to the TP and DRP load reduction from all
Figure 3.2: BBN model structure for phosphorus management based on the left side of the Bowtie Risk Analysis Tool.
agricultural areas in the watershed attributed to a BMP and was conditional on the BMP’s
effectiveness, and adoption (Figure 3.2).
BMP sub-models were aligned in sequence for each agricultural activity based on their
suitability to manage their phosphorus load, which resulted in seven BMPs as a
management system for cropland mineral phosphorus application, eight for cropland
order of BMPs in the agricultural activity pressure sequences was an important
consideration as BBNs represent the causal pathways of influence (Marcot et al. 2006).
The order of BMP sub-models was sequenced in relation to their position along the
hydrological flow path between phosphorus application and the receiving surface water.
BMPs that influenced the amount and availability of phosphorus were positioned first,
their residual loads were then influenced by soil and crop management BMPs positioned
next, and finally phosphorus trapping and retention BMPs at the end of the sequence
before the final residual load is exported from farm operations/agricultural areas (Dodd
and Sharpley, 2015). Residual load nodes referred to the resulting watershed TP or DRP
load following the implementation of a BMP and were accumulated at each step along the
sequence of BMP sub-models. The final TP and DRP load (effect node) was the
summation of residual loads from the three agricultural activities following the
implementation of their specific system of BMP management sequence (Figure 3.2).
3.3.1 Estimating phosphorus loads from agricultural activities
The 2008 TP load to the Grand River watershed was 447 MT (Maccoux et al. 2016), with
40.01 MT contributed by municipal areas and industry, leaving 406.99 MT remaining
assumed to have been contributed by agricultural activities (LSPRTT, 2008). The 406.99
MT TP load from agricultural activity was divided into contributions from cropland
mineral phosphorus application, cropland manure phosphorus application and livestock
manure phosphorus losses. The BBN model assumed the area of agricultural land
receiving phosphorus application was representative of the load of phosphorus in
discharge from Grand River agricultural areas (Table C.1). The 2006 Census of
Agriculture for the Grand River watershed reported that 4,353.14 𝑘𝑚2received mineral
fertilizer application and 1,509.84 𝑘𝑚2received manure application (Statistics Canada,
2006). The resulting total area of phosphorus application was greater than the area of
agricultural land use reported in the Census, which we attributed to repeated application
of phosphorus to the same farm operations in a year.
A proportion of the manure phosphorus produced on a livestock operation can be
2000). Therefore, the BBN model assumed the proportion of manure phosphorus that was
not collected (1-recoverability) was the proportion that was exported from operations as
livestock phosphorus losses (Table C.1). The average proportion of manure phosphorus in
the Grand River watershed that is recoverable and available for application is 0.58, as
determined by a weighted average calculated from livestock species-specific
recoverability coefficients for Ontario (International Crop Nutrient Institute, 2013) that
we applied to livestock counts in the 2006 Census of Agriculture for the Grand River
watershed. Therefore, if the 0.58 fraction represented 1,509.84 𝑘𝑚2, then the 0.42
fraction represented 1,093.33 𝑘𝑚2. A total representative area of 6,956.13 𝑘𝑚2 included
the cropland mineral phosphorus application (4,353.14 𝑘𝑚2), the cropland manure
phosphorus application (1,509.84 𝑘𝑚2), and the livestock manure phosphorus losses
(1,093.33 𝑘𝑚2). The total representative area summed greater than the area of the
watershed, this reflected the census reporting fertilizer and manure application multiple
times a year to the same area by farmers. Each representative area was converted to their
proportion of the total area and used to divide the total 406.99MT TP load among the
three agricultural activities.
The Maccoux et al. (2015) study reported dissolved reactive phosphorus (DRP) loads for
2009−2013. The BBN model assumed the annual average proportion of TP load was the
DRP load, was representative of the proportion of DRP load for 2008 (Table C.1) The
average proportion of TP that was DRP over this period was 0.27 with a standard
deviation of 0.04. The 2008 DRP loads in MT was therefore assumed to be 0.27 of the
calculated 2008 TP loads for each of the three agricultural activity pressures.
3.3.2 Estimating probability distributions for BMP Effectiveness
BMP effectiveness coefficients for TP and DRP were compiled into a database from a
review of the scientific literature. The lack of BMP effectiveness data for the Grand River
watershed and even the Great Lakes basin meant data had to be compiled from all
available studies including those from the United States, Canada (Ontario and Quebec
only), and internationally. This assumed that the compiled BMP effectiveness coefficients
Effectiveness data for mineral and manure phosphorus reduction by BMPs was too
limited to generate their separate distributions, thus their effectiveness data was combined
and assumed that BMPs treated manure and mineral phosphorus the same (Table C.1).
Some BMPs still had limited effectiveness data (n < 5). It was assumed these BMPs
could be grouped and analyzed together if, and only if, they performed similar functions
to reduce phosphorus load (Table C.1). This resulted in two grouped BMPs described
previously in section 3.1 for NAM and RT. Also, TP effectiveness data was not found for
CR, and therefore we defaulted to PP data as it represented the dominant fraction of TP
from crop operations (Table C.1) (Coelho et al. 2012; Panuska and Karthikeyan, 2010;
Richards et al. 2002). Finally, the number of effectiveness coefficients for most BMPs
was < 30 and therefore the entire range of potential effectiveness may not be represented
in the compiled data and should be considered when interpreting results. The maximum
and minimum effectiveness coefficient for percent load reduction, established the range
of BMP effectiveness. BMP effectiveness nodes were discretized into five equal bins for
reductions ≥0 and five equal bins for reductions < 0 for a total of five bins for BMPs with no probability of increased loads, and ten bins otherwise. As seen in Figure 3.2 (or
Figures A.1−8), percent reductions were populated into effectiveness nodes as
proportions for computational purposes, therefore 0−100% was 0−1; however, we used
percent reduction when describing effectiveness in this thesis for better communication
and knowledge transfer.
The distribution for effectiveness of most BMPs was not evident through visual
inspection of the data and therefore it was assumed to follow a normal distribution (Table
C.1). The distribution of effectiveness coefficients for all BMPs were tested for normality
using the Shapiro-Wilk test (Figures A.1-8) and verified using a quantile-quantile plot in
Sigma Plot (Systat Software Inc., 2016). For BMPs that passed the normality test
(generally those with n < 30), the probability distributions were generated with the
following equation:
P (Effectiveness) = NormalDist (Effectiveness, Mean, Standard Deviation)
which describes the probability of observing any BMP effectiveness state in the node is
equal to the normal distribution of reported BMP effectiveness. For BMPs that failed the
normality test (generally those with n ≥ 30), the probability distributions were generated using the “Learn from Cases” function in the Netica software, with the resulting
probability distribution that reflected the true distribution of the data.
3.3.3 Estimating probability distributions for BMP adoption
It was assumed that a 100% adoption indicated that 100% of the hydrological flow path
(surface and subsurface conduits that transport water) in agricultural areas was treated by
farm operations that implemented a specific BMP and hence 100% of the phosphorus
load was also treated (Table C.1). The adoption nodes in the model ranged from 0 to
100% adoption, discretized into five equal bins. As seen in Figure 3.2, percent adoption
was populated as proportions for computational purposes, therefore 0−100% is 0−1. The
2008 TP and DRP loads from the watershed outlet which were used as input into the
model, already reflected BMP adoption in that year. Therefore, the 0−100% adoption to
BMPs in the adoption node referred only to the remaining area of hydrological flow paths
not treated by the BMPs in 2008. For this reason, a non-informative, flat distribution for
adoption nodes was generated initially, however, when belief updating was implemented
to simulate further adoption of BMPs relative to 2008 (described later in section 3.5),
distributions were configured to reflect the simulation scenario.
Adoption nodes that ranged from 0−100% assumed that BMPs have the potential to treat
0−100% of the hydrological flow path transporting phosphorus load. While this
assumption is true for many BMPs, the assumption does not hold true for WR. The
adoption of WR as a BMP is constrained by site-specific attributes that are suitable for
wetlands to be restored or constructed. Therefore, the total possible proportion of
hydrological flow paths in agricultural areas in the Grand River watershed that could be
treated by WR was calculated. It was assumed that tile drainage was the main mechanism
of wetland loss. A map of historical wetlands (from 1800) with current wetlands
removed, was intersected with a map of farm operations that implemented tile drainage to