1556-6811/07/$08.00⫹0 doi:10.1128/CVI.00263-07
Copyright © 2007, American Society for Microbiology. All Rights Reserved.
Development and Evaluation of a Real-Time Reverse Transcription-PCR
Assay for Quantification of Gamma Interferon mRNA To Diagnose
Tuberculosis in Multiple Animal Species
䌤
Noel P. Harrington,
1,2* Om P. Surujballi,
1W. Ray Waters,
3and John F. Prescott
2Canadian Food Inspection Agency, Ottawa Laboratory Fallowfield, Ottawa, Ontario, Canada1; Department of Pathobiology,
University of Guelph, Guelph, Ontario, Canada2; and National Animal Disease Center, United States Department of
Agriculture, Ames, Iowa3
Received 27 June 2007/Returned for modification 8 August 2007/Accepted 7 October 2007
Tuberculosis of free-ranging and captive wildlife, including species implicated in the maintenance and
transmission ofMycobacterium bovis, is a difficult disease to diagnose and control. Historically, diagnosis of
tuberculosis has relied largely upon assays of cell-mediated immunity (CMI), such as tuberculin skin testing. This approach, however, is problematic or impractical for use with many wildlife species. Increasingly, in vitro
diagnostic tests, including gamma interferon (IFN-␥)-based assays, are replacing or complementing skin
testing of cattle and humans. Analogous assays are unavailable for most wildlife because of a lack of species-specific immunological reagents. This report describes the development and validation of a
whole-blood assay to quantify antigen-specific IFN-␥mRNA expression by quantitative real-time reverse
transcrip-tion-PCR. Oligonucleotide primers and probes were designed and tested for reactivity towards several sus-ceptible species of interest with respect to tuberculosis infection. The assay was subsequently optimized to
quantify the IFN-␥mRNA expression in elk and red deer (Cervus elaphus) and was evaluated for its ability to
detect mycobacterial antigen-specific responses of experimentally tuberculosis-infected animals. The assay was
a simple, rapid, and sensitive measure of antigen-specific CMI. The IFN-␥mRNA responses correlated well
with IFN-␥protein production and showed performance in determining an animal’s infection status superior
to that of either lymphocyte proliferation or IFN-␥protein enzyme-linked immunosorbent assay methods. An
additional advantage is the ease with which the assay can be modified to reliably quantify IFN-␥expression by
using consensus sequences of closely related species or of other species for which IFN-␥sequence information
is available.
Mycobacterium bovis, the etiological agent of bovine
tuber-culosis (TB), has an extraordinarily broad mammalian host range that includes humans, domestic livestock, and wildlife. Globally, several wildlife species have been implicated in the maintenance and transmission ofM. bovis: the badger (Meles
meles) in Great Britain and Ireland (1), the brushtail possum
(Trichosurus vulpecula) in New Zealand (2), white-tailed deer
(Odocoileus virginianus) in Michigan (28), elk (Cervus elaphus)
in Manitoba, Canada (17), and buffalo (Syncerus caffer) and kudu (Tragelaphus strepsiceros) in southern Africa (15). These wildlife hosts are difficult to control, and the transmission ofM.
bovis to domestic livestock may result in regulatory action,
movement restrictions, or isolation of infected individuals and may become a significant barrier to the success of national eradication and control programs. Transmission among free-ranging and captive wildlife also creates problems in the man-agement of zoological collections; the risk of infection to other valuable animals is increased, directly affecting the value of the collection, and in some cases, the value of tourism or related economic benefits to a country (15).
New control strategies that address wildlife reservoirs are
required to eradicate bovine TB worldwide. An accurate assay for the antemortem detection of M. bovis-infected wildlife would serve as a useful surveillance tool for establishing dis-ease prevalence in free-ranging as well as captive wildlife and would be beneficial for any future eradication or vaccination programs. Historically, the tuberculin skin test, which involves intradermal injection of M. bovis tuberculin purified protein derivative (PPD), with the subsequent detection of swelling delayed-type hypersensitivity at the site of injection 3 days later has been the standard method of TB detection for domestic cattle, but it has numerous disadvantages (16) and is imprac-tical for wildlife.
To overcome limitations associated with skin testing, efforts have been directed at developing alternative blood-based in vitro assays for TB detection. Although serological assays have advantages in terms of logistics, lower cost, and ease of appli-cation, to date, no assay detecting circulating antibody toM.
bovishas shown adequate sensitivity or specificity suitable for
routine diagnostic use (3). Since M. bovis is an intracellular pathogen, diagnostic assays based on the conserved cell-medi-ated immune (CMI) response have shown greater promise for detecting a spectrum ofM. bovis-infected animals. The lym-phocyte proliferation assay (LPA) was the first-reported in vitro correlate of the in vivo delayed-type hypersensitivity re-sponse fromM. bovis-infected animals (20) and was shown to be more sensitive than serological assays for a variety of species (31). Such proliferation assays, however, are generally
re-* Corresponding author. Mailing address: Ottawa Laboratory Fal-lowfield, Canadian Food Inspection Agency, 3851 Fallowfield Road, Ottawa, Ontario K2H 8P9, Canada. Phone: (613) 228-6698, ext. 5922. Fax: (613) 228-6669. E-mail: [email protected].
䌤Published ahead of print on 17 October 2007.
1563
on August 17, 2020 by guest
http://cvi.asm.org/
garded as unsuitable outside research applications because of requirements for expensive equipment, long incubation peri-ods in complex tissue culture media, and the use of radioactive nucleotides and because they may also measure B-lymphocyte proliferation.
The discovery of the role of T-lymphocytes and gamma interferon (IFN-␥) in the immune response to TB has led to the development of cytokine assays for reactivity of cattle and humans toM. bovis(25) andMycobacterium tuberculosis(5), respectively. The IFN-␥ cytokine produced by sensitized T-lymphocytes is an essential component of the immune re-sponse to many intracellular pathogens via its effect on mac-rophage activation, inducing the release of mycobactericidal nitric oxide synthase and increasing the expression of major histocompatibility complex class I and class II molecules (6). Current IFN-␥assays are based on the detection and quanti-fication of IFN-␥protein (by enzyme-linked immunosorbent assay [ELISA] [35] or enzyme-linked immunospot assay[12]) that is released from antigen-sensitized lymphocytes following overnight incubation with mycobacterial antigen (e.g., PPD). Importantly, IFN-␥is not consumed during short-term culture and its production correlates with results of lymphocyte blas-togenesis assays and tuberculin skin tests (10). The IFN-␥ assays, having undergone extensive trials worldwide, are re-placing or complementing skin testing in cattle and humans (4, 21).
Analogous assays to detect cytokine expression at the pro-tein level for many nonagricultural animal species are unavail-able because of a lack of species-specific immunological re-agents. Consequently, cytokine research and associated applications have been severely hampered for wildlife and non-traditional domestic species and, thus, new cellular and molec-ular immunological approaches are required. The detection of mRNA is an alternative method of demonstrating cytokine induction. Recently, the reverse transcription (RT) of mRNA into DNA, followed by PCR using real-time PCR has become the method of choice for the rapid analysis and quantified RT-PCR (qRT-PCR) of cytokine mRNA for humans and other mammalian species (18). This technique requires only knowledge of the gene sequence, and specific reagents (prim-ers/probes) can be made rapidly in the laboratory or pur-chased. Several genes, including IFN-␥gene, have been cloned and sequenced for a variety of nontraditional domestic and wildlife species (29). The quantification of IFN-␥mRNA levels therefore provides an alternative approach to IFN-␥ protein-based assays for the detection of M. bovis-infected animals (27). Such an in vitro assay would be particularly useful for wildlife species, as it would require only a single handling event.
This report describes the development and validation of a simple, rapid, and reliable whole-blood assay to quantify anti-gen-specific IFN-␥mRNA expression from several TB-suscep-tible target species by qRT-PCR. The ability of the assay to detect mycobacterial antigen-specific responses of experimen-tally TB-infectedCervus elaphus, a significant reservoir host species forM. bovisin Canada (17), was subsequently evalu-ated. Diagnostic performance was compared with the LPA and a recently available commercial ELISA for cervid IFN-␥ pro-tein. A secondary objective was to evaluate the kinetics of, and the effect of skin testing on, the cervid CMI response as
de-tected by current diagnostic tests. These findings may lead to modifications in current testing protocols that improve the detection efficiency for infected wildlife.
MATERIALS AND METHODS
Experimental design, blood collection, and animals.The first objective of this study was to develop a qRT-PCR assay of IFN-␥mRNA expression that could be used for several species of interest with respect to detecting TB infection, including cattle (Bos taurus), sheep (Ovis aries), goat (Capra hircus), white-tailed deer (Odocoileus virginianus), reindeer (Rangifer tarandus), mule deer (Odocoileus hemio-nus), red deer (Cervus elaphus elaphus), elk (Cervus elaphus manitobensis), llama (Llama glama), and bison (Bison bison). For this purpose, blood samples were collected into a heparinized Vacutainer (Becton Dickinson, Oakville, Ontario, Can-ada), transported at approximately 20°C, and processed within 24 h from the time of collection. Cattle, sheep, goat, red deer, and llama blood samples were obtained from control animals housed at the Ottawa Laboratory Fallowfield, Canadian Food Inspection Agency (OLF-CFIA; Ottawa, Ontario, Canada). Blood from elk, white-tailed deer, and bison was obtained from animals captured by net gun from Decem-ber 2003 to February 2004 as part of a multiagency disease surveillance project in Riding Mountain National Park (RMNP; Manitoba, Canada); the project was spon-sored by Parks Canada Agency. Blood from reindeer was collected and kindly provided by staff of the Toronto Zoo (Toronto, Ontario, Canada).
Subsequently, and as a proof of principle for using IFN-␥mRNA as an indicator of TB infection, the qRT-PCR assay was validated for use with a single target species experimentally infected withM. bovis.Fifteen healthy red deer (Cervus elaphus elaphus)⫻elk (Cervus elaphus nelsoni) hybrids of approximately 4 weeks of age were obtained from a herd with no history of TB and moved to the OLF-CFIA (Ottawa, Ontario, Canada). Prior to our beginning the infection study, an outline of all procedures was approved by a CFIA Institutional Animal Care and Use Committee and was in accordance with humane animal treatment requirements of the Canadian Council on Animal Care. At 8 months of age, and prior to the experimental infection, animals were screened using a LPA against M. bovis,Mycobacterium avium, andM. aviumsubsp.paratuberculosistuberculins (PPD-bovis, PPD-avium, and PPD-Johnin, respectively; Biologics Production Unit, OLF-CFIA, Ottawa, Ontario, Canada) to confirm their bovine TB-free status. For the duration of the study, 10M. bovis-inoculated animals were housed in temperature- and humidity-controlled rooms (two to three animals per room) within a biosafety level 3 confinement facility. For the same duration, five un-treated control animals were housed in a biosafety level 2 confinement facility and were treated similarly. Prior to inoculation, all animals were allowed to acclimate to their new environment for 2 weeks. Blood samples were collected from control and infected animals at regular intervals from preinfection to 32 weeks postinfection (p.i.) and were used for the setup of in vitro assays to detect IFN-␥mRNA, IFN-␥protein, and lymphocyte proliferation.
Experimental infection and necropsy.Ten experimental red deer⫻elk hy-brids were inoculated with a field strain ofM. bovis(02/1007, CFIA designation), originally isolated from a beef cow in the Grandview, Manitoba, Canada, area adjacent to RMNP, with a spoligotype strain pattern identical to that reported for TB-infected wild elk from within RMNP. The challenge inoculum consisted of 103
CFU of mid-log-phaseM. bovisgrown in Middlebrook 7H9 medium supplemented with 10% oleic acid-albumin-dextrose complex (Becton Dickin-son, Mississauga, Ontario, Canada). To harvest tubercle bacilli from culture medium, cells were pelleted by centrifugation at 750⫻g, washed twice with 1 ml of phosphate-buffered saline (PBS), pH 7.2, and diluted to the appropriate cell density in 2 ml of PBS. The challenge inoculum was instilled directly into the tonsillar crypts of anesthetized deer. At postmortem examination, specimens were collected for bacteriological culture that included tonsil, lung, liver, spleen, kidney, and mandibular, parotid, medial retropharyngeal, lateral retropharyn-geal, superficial cervical, tracheobronchial, mediastinal, mesenteric, hepatic, iliac, supramammary, and prefemoral lymph nodes. All inoculated animals were confirmed as having tuberculous lesions, andM. boviswas isolated by mycobac-teriological culture using standard methods (23).
Mononuclear cell culture and antigens.Peripheral blood mononuclear cells (PBMCs) were separated by density gradient centrifugation using Ficoll-Paque (density, 1.077; Amersham Biosciences, Piscataway, NJ) and washed twice with RPMI 1640 medium (Invitrogen, Burlington, Ontario, Canada). PBMCs were diluted to 5⫻106cells per milliliter in RPMI 1640 containing 10% fetal calf
serum (Invitrogen) and supplemented with penicillin G and streptomycin (100 U/ml and 80g/ml, respectively; Invitrogen). Concanavalin A (ConA; Sigma-Aldrich, Oakville, Ontario, Canada), or bovine tuberculin (PPD-bovis; Biologics Production Unit, OLF-CFIA, Ottawa, Ontario, Canada) was added to cell
on August 17, 2020 by guest
http://cvi.asm.org/
pensions at a concentration of 10g/ml. Medium was added to suspensions acting as no-treatment controls. A 200-l volume of each cell suspension was placed into four wells of a 96-well, round-bottom microtiter plate (Corning, Acton, MA) and incubated from 2 to 96 h in a humidified tissue culture incubator (VWR Scientific, Mississauga, Ontario, Canada) at 37°C and 5% (vol/vol) CO2
and 95% (vol/vol) air.
Total RNA isolation and cDNA synthesis.Total RNA was extracted from PBMCs following in vitro culture using the RNeasy kit (QIAGEN, Mississauga, Ontario, Canada) according to the manufacturer’s instructions, which incorpo-rated an extended DNase treatment with DNase I (QIAGEN) to remove any genomic DNA contamination. Total RNA was eluted with 40l of RNase-free water and quantified by spectrophotometry (optical density at 260 nm [OD260])
and by low-mass gel electrophoresis (Invitrogen). Total RNA was reverse tran-scribed to cDNA with the Omniscript cDNA synthesis kit (QIAGEN) following the manufacturer’s instructions. Briefly, approximately 0.2g of total RNA was reverse transcribed in a final volume of 20l reaction mixture containing the following components: 1⫻RT buffer, deoxynucleotide triphosphate mix (5 mM each), RNase inhibitor (10 U/l RNase Out; Invitrogen), and 4 U of Omniscript RT. The samples were incubated at 37°C for 60 min. The resulting cDNA was stored frozen (⫺70°C) until assayed by real-time PCR.
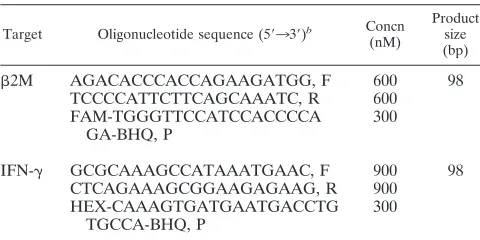
Design of specific oligonucleotide primers and probes for PCR. Oligonucleo-tide primers and fluorogenic probes of the IFN-␥target gene and the normal-izing beta 2-microglobulin (2M) housekeeping gene were designed using Primer3 software (26). The primers and probes were designed for use in multiple species of interest with respect to TB infection in Canada, including elk, cattle, sheep, goat, and llama for which sequence information was available in the GenBank database (http://www.ncbi.nlm.nih.gov/GenBank/index.html). This de-sign was accomplished by selecting oligonucleotide sequences from highly con-served coding regions of cDNA. At the time of this study, there was no sequence information available in published databases regarding reindeer, white-tailed deer, or bison cDNA sequences, but samples from these animal species were tested based on presumed sequence conservation. The IFN-␥and2M oligo-nucleotide probes contained the 6-carboxyfluorescein and hexachloro-6-carboxy-fluorescein reporter dyes, respectively, covalently attached at the 5⬘end. The black hole quencher (BHQ) molecule was covalently attached at the 3⬘end (Integrated DNA Technology, Coralville, IA) for each probes. Primer and probe sequences were also chosen to prevent reactivity to undesired genes and other coding sequences and checked with Basic Local Alignment Search Tool (BLAST) software (www.ncbi.nlm.nih.gov/BLAST/). For each target gene, dif-ferent primer (300 to 900 nM) and probe (100 to 300 nM) concentrations were tested to optimize the PCR amplification. The primer/probe sequences and expected PCR product lengths are shown in Table 1.
Real-time PCR assay.Real-time PCRs were carried out in 25-l volumes and performed using an iCycler IQ thermocycler (Bio-Rad Laboratories, Missis-sauga, Ontario, Canada). The PCR mixture contained 5l of cDNA sample and 20l of a master mix containing final concentrations of probe (300 nM), forward and reverse primers (600 to 900 nM each), and 1⫻Platinum quantitative PCR SuperMix (Invitrogen). The wells of the plate were sealed with optical adhesive
covers (Bio-Rad Laboratories) and centrifuged at a low speed (200⫻g, 5 min). Thermal cycling conditions comprised of an initial incubation at 95°C for 10 min, followed by 40 cycles of denaturation at 95°C for 15 s and an annealing with primer extension at 60°C for 45 s.
Each measurement was performed at least in duplicate, and optical data obtained by real-time PCR was analyzed by using the default and variable parameters available with the iCycler optical system interface (version 2.3; Bio-Rad Laboratories). Data expression levels were recorded as the cycle threshold (CT) value, i.e., the PCR cycle number at which the amount of amplified target
was detected above the threshold value. Primer efficiencies and the dynamic range for each target gene assay were determined using a 10-fold dilution series of purified target gene products in triplicate. Standard curves were generated by plotting the log of the starting quantity of template against theCTvalue obtained
ruing the amplification of each dilution. The quality of each standard curve was judged from the slope and the correlation coefficient (r). The slope of the line was used to determine the efficiency of the target amplification (E) using the equationE⫽10(⫺1/slope), where 2.0 represents the optimal efficiency. The
re-producibility of the qRT-PCR method was examined by intra-assay and interas-say amplification. To assess asinteras-say reproducibility, the standard curves were gen-erated on different days for each target gene. PCR consumables were always prepared as a mixture, whereas cDNA aliquots were added individually to each well. Calculation of test variability was based on the variation ofCTfrom the
meanCTvalue. The intra-assay variation was determined in four repeats of the
standard curve PCR of purified PCR product over a range of different dilutions (101
to⬎108
starting molecules). Interassay variation was similarly examined over a wide range of starting molecules from four different experiment runs performed on different days. PCR amplicons were sequenced to demonstrate primer specificity.
Quantitation of IFN-␥mRNA expression kinetics.To evaluate the usefulness of the qRT-PCR assay for the quantification of antigen-specific IFN-␥mRNA expression, changes in mRNA expression over time were examined following antigen stimulation of PBMCs isolated fromM. bovis-infected cervids. Blood from sixM. bovis-infected and five control animals at 57 days postinoculation was collected into heparinized Vacutainer tubes (Becton Dickinson). PBMCs were isolated within 4 h of collection and were incubated at 37°C with stimulation (ConA or PPD-bovis) or without stimulation as described above. Total RNA was harvested for cytokine analysis after 0, 2, 4, 8, 16, 24, 48, 72, and 96 h of culture, and IFN-␥mRNA was quantified.
Whole-blood cultures forM. bovis-specific IFN-␥production.Following the development and validation of the real-time RT-PCR assay for the quantification of cervid IFN-␥mRNA from PBMCs, the assay was adapted to a whole-blood culture system. The antigen stimulation portion of this adapted assay was based upon the format of commercial IFN-␥tests, allowing for higher throughput detection of mycobacterium-specific responses. Briefly, up to 10 ml of venous blood was collected into heparinized Vacutainer tubes and 1.5-ml aliquots were dispensed into individual wells of 24-well tissue culture plates (Costar, Corning, Inc., Corning, NY) containing either PPD-bovis (25g/ml), PPD-avium (25 g/ml; Biologics Production Unit, OLF-CFIA), Pokeweed mitogen (PWM; Sigma) positive control (25g/ml), or PBS nonstimulated control. Duplicate plates were incubated: one plate for 16 h (for IFN-␥mRNA by qRT-PCR) and a second plate for 48 h (for IFN-␥protein by ELISA) at 37°C in a humidified tissue culture incubator as described above. Following culture, plates destined for qRT-PCR analysis were subjected to total RNA extraction from whole blood by using the QIAamp RNA blood mini kit (QIAGEN, Inc.) according to the manufacturer’s instructions. Subsequent cDNA synthesis, real-time PCR, and mRNA quantification were performed as described elsewhere in Materials and Methods. Plates destined for ELISA were centrifuged (500 ⫻ g, 5 min), and plasma supernatants were harvested from each well and stored at⫺80°C until analyzed by ELISA.
IFN-␥ELISA.Plasma supernatants were assayed in duplicate by sandwich ELISA using a commercial diagnostic kit (Cervigam; Prionics Ag, Schlieren, Switzerland) according to the manufacturer’s instructions. Absorbencies of test samples were read at 450 nm by using an ELISA plate reader (Molecular Devices, Menlo Park, CA). Individual treatments were analyzed in duplicate, and the assay was repeated if duplicate responses were inconsistent. The results were expressed as the increase in mean OD readings at 450 nm in the presence of antigen compared to the OD in the PBS nonstimulated supernatants resulting in a delta (⌬) OD value. A sample was considered positive when the⌬OD450of the
PPD-bovis-stimulated sample was 0.05 U greater than the values for the control nonstimulated sample and the PPD-avium sample.
LPA.The LPA was performed as described previously (21). Briefly, mononu-clear cells were isolated from the buffy coat fraction of peripheral blood and cultured with or without antigen as described above. Cells were stimulated by the
TABLE 1. Oligonucleotide primer and probe sequences for real-time PCR amplificationa
Target Oligonucleotide sequence (5⬘33⬘)b Concn
(nM)
Product size (bp)
2M AGACACCCACCAGAAGATGG, F 600 98
TCCCCATTCTTCAGCAAATC, R 600 FAM-TGGGTTCCATCCACCCCA
GA-BHQ, P
300
IFN-␥ GCGCAAAGCCATAAATGAAC, F 900 98
CTCAGAAAGCGGAAGAGAAG, R 900 HEX-CAAAGTGATGAATGACCTG
TGCCA-BHQ, P
300
aPrimers and probes were designed to detect2M and IFN-␥of multiple
species, including elk, cattle, sheep, goat, and bison, for which sequence infor-mation was available from EMBL/GenBank.
bProbes contained either the 6-carboxyfluorescein (FAM) or
hexachloro-6-carboxyfluorescein (HEX) reporter dye covalently attached at the 5⬘end and the BHQ molecule covalently attached at the 3⬘end. F, forward primer; R, reverse primer; P, probe.
on August 17, 2020 by guest
http://cvi.asm.org/
addition of antigens PPD-bovis (10g/ml), PPD-avium (10g/ml), ConA mito-gen-positive control (10g/ml), or nonstimulated control. Cells were cultured for 5 days in a humidified tissue culture incubator as described above. Cellular proliferation was assessed by the addition of 1Ci of [3H]thymidine (ICN
Biochemicals, Costa Mesa, CA) in 20l of medium over the final 18 h of culture. The well contents were harvested onto glass fiber filter mats (Micromate 196 Harvester; Packard Instrument Co., Meriden, CT). The filters were washed with water, dried, and placed into a scintillation cocktail. The incorporated radiolabel for each well was measured in counts per minute (cpm) using a direct beta counter (Matrix 96 Direct Beta Counter; Packard Instrument Co.). Treatments were run in triplicate, and stimulation index (SI) (SI⫽mean cpm of antigen or mitogen/mean cpm of negative control) and⌬cpm (mean cpm of antigen or mitogen⫺mean cpm of negative control) values were calculated for each sample.
Quantitative and statistical analysis.Quantification of IFN-␥mRNA levels and tests of statistical difference in mRNA expression were analyzed by the Relative Expression Software Tool (REST) for real-time PCR (24) which is based upon the comparativeCT[2⫺(⌬⌬Ct)] method as described previously (14).
To assess the effect of PPD stimulation on IFN-␥mRNA expression by this method, values were expressed relative to a reference sample (the control non-stimulation sample) and an endogenous2M housekeeping gene was used to normalize for differences in the quantity and quality of total nucleic acid added to each reaction and the efficiency of the RT step. All samples are reported as relative transcription or then-fold difference between the reference nonstimu-lated sample and the PPD-bovis- or mitogen-stimunonstimu-lated samples. Statistical eval-uations of the calculated relative expression variations were analyzed for signif-icant differences by pair-wise fixed reallocation randomization test (24).
SI values for lymphocyte blastogenesis and OD values for IFN-␥protein by ELISA ofM. bovis-infected and control deer were compared by Student’sttest. Differences were considered significant ifPvalues of⬍0.05 were obtained.
Receiver operating characteristics (ROC) curve analysis (MedCalc Software, Mariakerke, Belgium) was performed on the qRT-PCR results to determine the optimal cutoff point (the relative mRNA expression level at which the sum of the sensitivity and specificity values was maximal) for distinguishing between positive and negative test results. Sensitivity was defined as the proportion ofM. bovis culture-positive animals that were categorized as positive by the real-time RT-PCR assay. Specificity was defined as the proportion ofM. bovisculture-negative animals that were classified as negative by the real-time RT-PCR assay. The area under the ROC curve was calculated as a measure of the accuracy of the test. Performance of the qRT-PCR assay was assessed by comparison with the current gold standard (M. bovisculture from postmortem tissues) and with the LPA and
IFN-␥ELISA immunological tests. The level of agreement beyond chance be-tween tests was determined by a calculation of kappa values.
RESULTS
Confirmation of primer/probe specificity and application in
multiple species.Specific oligonucleotide primers and
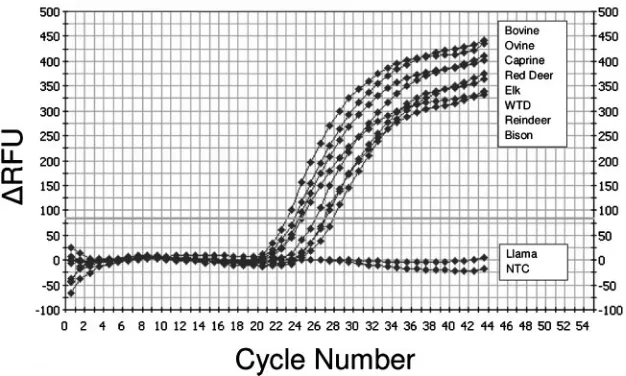
fluoro-genic probes were designed using consensus sequences from several target species, both domestic and free ranging, to assess the cross-species application of the method. Primers and probes were tested for their abilities to detect IFN-␥mRNA from PBMCs stimulated with ConA mitogen. High-resolution gel electrophoresis of IFN-␥qRT-PCR products resulted in a single PCR product of the expected size (98 bp), and melting curve analysis demonstrated no primer-dimer formation dur-ing the 40 real-time PCR amplification cycles (data not shown). Sequence analysis of PCR products showed identity with the published sequences. The respective, real-time, probe-based assay was subsequently positive for IFN-␥mRNA de-tection for cattle, sheep, goats, reindeer, white-tailed deer, red deer, elk, and bison (Fig. 1). In some cases (cattle, sheep, and bison), although 100% sequence identity was not possible in a primer/probe design with mismatches of 1 to 2 bp, there was still positive reactivity for the respective primer/probe set. For other species (white-tailed deer and reindeer) for which the IFN-␥mRNA sequence was unknown, the positive cross-reac-tivity presumably reflected phylogenetic homology for the IFN-␥mRNA sequence among these species. Only for llama samples (Llama glama) were the primers found to be cross-reactive, whereas the primer/probe set was not.
Real-time PCR assay amplification efficiencies,
reproduc-ibility, and dynamic range.The efficiency, reproducibility, and
dynamic range of the qRT-PCR assays for elk IFN-␥and2M were determined by constructing standard curves using serial
FIG. 1. Typical IFN-␥real-time RT-PCR amplification curves from multiple target species. Real-time PCR was performed on cDNA obtained from mitogen-stimulated PBMCs of the following species: bovine (Bos taurus), ovine (Ovis aries), caprine (Capra hircus), bison (Bison bison), red deer (Cervus elaphus elaphus), elk (Cervus elaphus manitobensis), white-tailed deer (WTD) (Odocoileus virginianus), reindeer (Rangifer tarandus), and llama (Llama glama). The amplification curves showed positive reactions for all tested animals with the exception of llamas. Theyaxis indicates the absolute emission intensity (delta RFU indicates relative fluorescence units subtracted by the background fluorescence signal); thexaxis shows the number of PCR cycles. NTC, no template control.
on August 17, 2020 by guest
http://cvi.asm.org/
dilutions of known template quantity. The equation of the linear regression line, along with Pearson’s correlation coeffi-cient was used to evaluate the qRT-PCR assay (Table 2). A linear relationship was detected over 8 orders of magnitude, with analytical sensitivity of 10 target molecules per reaction. Standard curves showed slopes of ⫺3.303 and ⫺3.380 for IFN-␥and2M, respectively. Real-time PCR efficiencies (E) calculated from the standard curve slope were 101% and 98% for2M and IFN-␥, respectively. The correlation coefficient (r) was⬎0.99 for both the IFN-␥and2M qRT-PCR assays. The target genes showed minimal intra-assay variation, with coef-ficients of variation (CV%) of 3.45 and 1.34 for 2M and IFN-␥, respectively. The intra-assay variability rose as the number of starting template molecules decreased, and for the interassay experiment, it was reversed (data not shown). The interassay CV% was 1.5 and 4.0 for 2M and IFN-␥, respectively.
Kinetics of IFN-␥mRNA expression after antigenic
stimu-lation.To determine whether the qRT-PCR method was
suit-able for the analysis of deer mononuclear cell responses, a kinetic study of IFN-␥mRNA expression was performed. The PBMCs isolated from six of theM. bovis-infected elk⫻ red deer hybrids at 57 days p.i. were stimulated with a well-estab-lished recall antigen (PPB-bovis). PBMCs were also tested from the five control animals that were not infected withM.
bovisand that should therefore not respond to PPD-bovis with
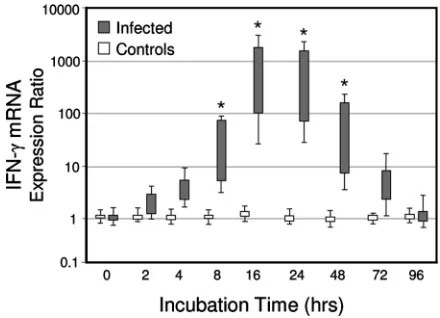
IFN-␥mRNA induction. Figure 2 illustrates the capacity of this system to quantify IFN-␥mRNA expression. There was a rapid and transient induction of IFN-␥mRNA after the incu-bation of PBMCs from theM. bovis-infected animals but not from the noninfected deer. The IFN-␥ mRNA expression reached a peak at 16 to 24 h poststimulation, whereas expres-sion was unchanged between groups before cultivation. Com-parable kinetics and levels of IFN-␥mRNA expression in re-sponse to PPD-bovis antigen stimulation were noted between PBMC and whole-blood assay formats (data not shown).
PBMC proliferation and whole-blood IFN-␥ responses
to-ward PPD-bovis. Heparinized blood was collected from M.
bovis-inoculated and control animals over the 7-month
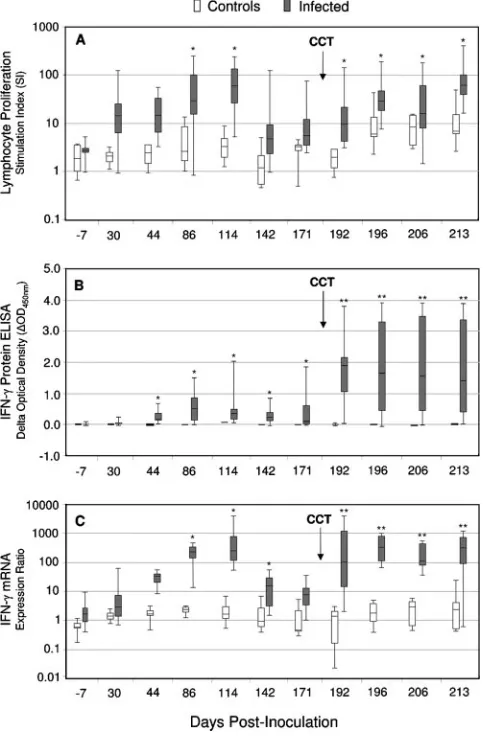
infec-tion study, and CMI responses (IFN-␥mRNA, IFN-␥protein, and lymphoproliferation) to stimulation with PPD-bovis were evaluated. The response kinetics of the assays are illustrated in Fig. 3. In general, the CMI responses displayed similar patterns of reactivity to PPD-bovis stimulation. Recall responses were
evident by 30 to 44 days postinoculation, and group mean responses grew stronger and peaked by 86 to 114 days p.i. (P⬍
0.05). This result was followed by a progressive decline in the group mean responses through 171 days p.i. The subsequent administration of mycobacterial antigens through tuberculin skin testing resulted in significantly boosted (P ⬍ 0.01) re-sponses. This effect was noted for all assays at 7 days post-skin test and remained elevated for the 4 weeks of testing post-skin test (the time was 192, 199, 206, and 213 days p.i.).
Infected deer also showed some responsiveness to the sim-ilar antigen preparation forM. avium(data not shown), owing to antigenic cross-reactivity between these organisms. The re-sponse to homologous PPD-bovis, however, was consistently much greater. In control animals, PPD-bovis induced compar-atively little activity in any of the assays (Fig. 3). Adequate viability of the cultured PBMCs was confirmed by high thymi-dine uptake or IFN-␥production in response to mitogen stim-ulation.
CMI-based assay comparison. Although CMI-based assays
have been useful for the detection of intracellular infective agents, associations among lymphocyte proliferation, IFN-␥mRNA, and IFN-␥protein recall responses in deer following ex vivo myco-bacterial antigen stimulation have not previously been examined. The minimum and maximum values of whisker box plots of Fig. 3 illustrate the broad spectrum of CMI responses of theM. bovis -inoculated deer. In spite of this variation, however, deer that were strong IFN-␥responders as measured by ELISA were also strong IFN-␥mRNA responders as measured by qRT-PCR. Correlation analysis of the CMI response data demonstrated a strong positive association between antigen-specific IFN-␥ protein and IFN-␥ mRNA responses (r⫽0.613;P⬍0.01). Pairwise comparison of immunoassay (lymphoproliferation, IFN-␥secretion, and IFN-␥ mRNA) responses ofM. bovis-infected cervids to mycobacterial antigen (PPD-bovis) stimulation were as follows. For LPA versus
FIG. 2. qRT-PCR analysis ofCervus elaphusIFN-␥gene expres-sion kinetics from PBMCs stimulated with tuberculin (PPD-bovis). Isolated PBMCs from sixM. bovis-infected deer were stimulated with PPD-bovis (10g/ml), and RNA was extracted at 0, 2, 4, 8, 16, 24, 48, 72, and 96 h for analysis by qRT-PCR. The results are expressed as box plots of mRNA expression relative to nonstimulated cells after nor-malization against the2M housekeeping gene. Shown are the 25% to 75% response ranges (top and bottom lines of boxes) and minima and maxima (whiskers). Asterisks indicate responses byM. bovis-infected deer that differ (P⬍0.01) from the respective responses of nonin-fected control deer.
TABLE 2. Characteristics and validation parameters of quantitative real-time RT-PCR for cervid IFN-␥and2M
Target Detection limita
Quantification range (test linearity关r兴)b
PCR efficiencyc
Intra-assay variationd
Interassay variatione
2M 10 101–109(0.998) 2.01 3.45 1.5
IFN-␥ 10 101–109(0.991) 1.98 1.34 4.0 aValues are expressed as molecules per reaction.
bValues are given in molecules per reaction. Assay variation was determined
in four repeats (n⫽4) over the complete quantification range.
cThe values for PCR efficiency were calculated according to the following
equation:E⫽10关⫺1/slope兴.
dDetermination of variation is based on crossing point variation. Values are
coefficients of variation expressed as percentages.
eValues are coefficients of variation expressed as percentages.
on August 17, 2020 by guest
http://cvi.asm.org/
ELISA,rwas 0.214 (P⬍0.05); for LPA versus qRT-PCR,rwas 0.127 (not significant); and for ELISA versus qRT-PCR,rwas 0.613 (P⬍0.01). Blood and PBMCs were isolated from deer at various time points postinfection and cultured in medium alone or medium plus mycobacterial antigen (PPD-bovis; 10g/ml). LPA was assessed after 5 days of culture of PBMCs by titrated thymidine incorporation. Protein of IFN-␥in whole-blood culture supernatant was quantified by ELISA after 48 h of whole-blood culture. Total RNA was extracted after 14 to 18 h of whole-blood
culture, and IFN-␥ mRNA was quantified by qRT-PCR. The association of the IFN-␥assays with lymphocyte proliferation was more modest (r values were 0.214 and 0.177 for IFN-␥protein and IFN-␥mRNA, respectively). No associations were detected for these responses to no antigen stimulation (data not shown).
Diagnostic classification by CMI assays.The diagnostic
per-formance results of the CMI-based assays were examined over the course of theM. bovisinfection study relative to one an-other and relative to the infection status of the experimental animals (Table 3). For this purpose, deer were classified asM.
bovisreactors based on test interpretation criteria previously
described for the LPA (7) and as recommended by the man-ufacturer of the IFN-␥Cervigam ELISA. For the qRT-PCR assay, a ROC curve analysis of the data from the present infection study recommended an optimal IFN-␥mRNA ex-pression ratio cutoff point of 7.84. The area under the ROC curve value of 0.881 (P ⬍ 0.0001; 95% confidence interval, 0.816 to 0.929) indicated that the qRT-PCR assay for IFN-␥ mRNA was able to distinguish betweenM. bovis-infected and noninfected deer. At this cutoff point, the sensitivity estimate of the qRT-PCR assay over the entire infection study was 78.6%. By comparison, the diagnostic sensitivity values of the LPA and the IFN-␥ELISA were 65.7% and 70.0%, respec-tively. All assays demonstrated high levels (⬎90%) of specific-ity for this infection study. The kappa statistic was determined to quantify the level of agreement between the classification result of each CMI assay and the animal’s true infection status (Table 3). Correlating with the sensitivity results, qRT-PCR for IFN-␥mRNA showed the highest agreement with myco-bacterial culture results (kappa⫽0.72). This was followed by the IFN-␥ELISA and LPA, with kappa values of 0.65 and 0.53, respectively.
The CMI-based assays were performed 11 times over the course of the 7-month infection study. For each assay, the number of deer classified as M. bovis positive mirrored the magnitude of the respective CMI response (Fig. 4). No deer were classified as reactors prior toM. bovisinoculation. By 30 days p.i., 2 of 10 or 3 of 10 inoculated deer were classified
asM. bovisreactors. This increased to a maximal sensitivity of
at least 8 of 10 deer for all assays at 112 days p.i. As the CMI responses declined at 4 to 6 months p.i., so did the number of
FIG. 3. Lymphocyte proliferation (A), IFN-␥ protein (B), and IFN-␥mRNA (C) responses to PPD-bovis. Infected cervids (n⫽10) were inoculated by intratonsillar instillation of 1.5⫻103CFU ofM.
bovis, whereas control deer (n⫽5) received no inoculation. Hepa-rinized blood samples were obtained at the indicated time points, and isolated PBMCs (lymphoproliferation) or whole-blood cells (IFN-␥ assays) were stimulated with mycobacterial antigen (PPD-bovis) or received no stimulation. The LPA sample was incubated for 5 days, and the blood cultures were incubated for 16 h and 48 h for qRT-PCR and ELISA, respectively. Shown are the medians (solid lines in boxes), 25 to 75% response ranges (top and bottom lines of boxes), and minima and maxima (whiskers). CCT indicates skin testing performed at 184 days p.i. Asterisks indicate responses byM. bovis-infected deer that differ (P⬍0.05) from the respective responses of noninfected control deer. Double asterisks indicate that responses ofM. bovis -infected deer post-CCT were greater (P⬍0.05) than the respective responses of noninfected control deer and greater than the immediate pre-CCT response (171 days p.i.).
TABLE 3. Immunoassay comparison for the detection of M. bovis-infected cervids
Assay Cutoff Sensitivity
(%)d Specificity
(%)e Kappaf
LPA ⬎1.10a 65.7 92.5 0.53
ELISA for IFN-␥ ⬎0.05b 70.0 100 0.65
qRT-PCR for IFN-␥ ⬎7.84c 78.6 97.5 0.72 aCutoff level of LPA developed by Griffen et al. (7), where cpm values for
PPD-bovis/PPD-avium of⬎1.1 were classified as positive.
bCutoff developed by the manufacturer of the Cervigam kit, where
PPD-bovis-stimulated blood plasma having an OD value greater than 0.050 above that of PPD-avium- and PBS-stimulated plasma was classified as positive.
cCutoff determined by ROC analysis of this study, where relative mRNA
expression values of⬎7.84 were classified as positive.
dSensitivity indicates the proportion of animals that wereM. bovisinfected
(culture positive) and test positive.
eSpecificity indicates the proportion of animals that were notM. bovisinfected
(culture negative) and test negative.
fKappa indicates the level of agreement between the outcome of each assay
andM. bovisculture result.
on August 17, 2020 by guest
http://cvi.asm.org/
animals classified as reactors (down to 6 of 10 by 171 days p.i. for all assays). Subsequent administration of the tuberculin skin test produced, in addition to boosted CMI responses, a corresponding increase in the proportion of deer (8 of 10 deer to 10 of 10 deer) classified as positive reactors forM. bovis.
DISCUSSION
This study describes the development and evaluation of a real-time RT-PCR assay for the quantification of IFN-␥ mRNA as a means of detecting a spectrum of TB-infected domestic and wildlife species. This approach is particularly relevant for species for which protein-based reagents are not yet available, and it should facilitate disease diagnosis. When used in conjunction with a whole-blood culture system, the result was a simple, rapid, and sensitive measure of antigen-specific, cell-mediated immunity. The IFN-␥mRNA expres-sion of whole blood from red deer⫻elk hybrids in response to ex vivo PPD-bovis stimulation correlated well with the IFN-␥ protein and showed performance for determining infection status superior to that of either the lymphocyte proliferation or the IFN-␥ ELISA method. An additional advantage of the qRT-PCR assay is the ease with which it can be modified to reliably quantify the IFN-␥expression of other species using consensus sequences of closely related species or of other species for which sequence information is available. In contrast to tuberculin skin testing, this blood-based qRT-PCR assay allows testing without handling the animals twice, produces results within 24 h, and does not compromise the immune status of the animal, allowing for repeat testing if necessary.
Diagnostic tests for TB are used as tools for achieving dis-ease control objectives. The LPA is currently used as an in vitro diagnostic tool for TB surveillance of captive and free-ranging cervids in several countries (3). This study assessed the value of qRT-PCR of IFN-␥mRNA expression as a means to detectM. bovis-infected animals and allowed for a comparison with the LPA and a newly available commercial ELISA
(Cervigam) designed to detect cervine IFN-␥. Although the sensitivities and specificities reported in this study do not re-flect the field performance of a particular assay, they do pro-vide a useful interassay comparison of relative performance over a controlled infection study period. As a result, the rela-tive inherent value of each test could be judged and selected or rejected accordingly. All three assays displayed high levels of diagnostic specificity (few false positives) at greater than 90%. The qRT-PCR assay showed the highest overall sensitivity (79%), followed by the Cervigam ELISA and the LPA with 70% and 66%, respectively. Taken together, these results in-dicate that IFN-␥-based assays (qRT-PCR or ELISA) not only are easier and quicker to perform than LPAs but also have greater diagnostic accuracy. This result is consistent with what has previously been shown for humans, primates, and cattle and is not surprising since lymphocyte proliferation, unlike cytotoxicity or IFN-␥, is an indirect measure of T-cell effector function.
The commercial Cervigam IFN-␥ELISA was developed us-ing monoclonal antibodies to IFN-␥from red deer (29) and was recently demonstrated to cross-react with IFN-␥produced by white-tailed deer (22) and reindeer (33). The release of IFN-␥in response to ex vivo PPD-bovis stimulation was found to correlate with an animal’s infection status. However, the diagnostic performance of the IFN-␥ELISA in field samples or its diagnostic utility compared to other in vitro or in vivo tests has not previously been reported forCervus elaphus. Al-though the present study confirmed the reactivity of the IFN-␥ ELISA for red deer⫻elk hybrids, the qRT-PCR measure of IFN-␥ mRNA showed greater overall diagnostic sensitivity (79% versus 70% for ELISA). This result was likely due to the greater analytical sensitivity that can be achieved with qRT-PCR. The easy detection of cytokine mRNA transcripts from a limited number of antigen-specific cells from which the corre-sponding protein can barely be measured is a well-established advantage of the technique. Similarly, the qRT-PCR assay showed the highest level of agreement (kappa) with positive and negative test results compared to the reference standard of mycobacterial culture. Although the sensitivity and kappa val-ues were a composite over the entire infection study, they remain a useful tool for comparing the assays relative to one another.
Although this study demonstrated that qRT-PCR can iden-tify deer experimentally inoculated withM. bovis, this fact is not sufficient evidence to validate this method as a diagnostic test. According to guidelines from the World Organization for Animal Health, estimates of diagnostic sensitivity should be made on populations of animals that are as close as possible to the population on which the test will be used (19); in this particular instance, the population was free-ranging wildlife. This is a significant challenge for developing any new test for the detection of TB in North American wildlife, where it is difficult to test a sufficient number of infected animals to pro-vide a robust estimate of diagnostic sensitivity. Future studies with the qRT-PCR assay could be applied to locations with much greater prevalence of infected wildlife, such as Great Britain, New Zealand, or South Africa.
The amplification of cervine IFN-␥was linear over a wide range of input copies (101to⬎108) and sensitive to as few as
10 molecules. The specificity of the assay for IFN-␥was
virtu-FIG. 4. Immunoassay classification of cervids experimentally in-fected withM. bovis.Heparinized blood samples were obtained at the indicated time points, and isolated PBMCs (lymphoproliferation) or whole-blood cells (IFN-␥assays) were stimulated with mycobacterial antigen (PPD-bovis) or received no stimulation. The LPA sample was incubated for 5 days, and the blood cultures were incubated for 16 h and 48 h for qRT-PCR and ELISA, respectively. The CMI-based assays were performed at 11 time points over the course of a 7-month infection study. CCT indicates skin testing performed at 184 days p.i. Results are presented as the percentage of animals classified asM. bovisreactive by criteria outlined in Materials and Methods.
on August 17, 2020 by guest
http://cvi.asm.org/
ally guaranteed by the use of three oligonucleotides, including a fluorogenic-bound oligonucleotide complementary to the se-quence of the PCR product and localized between two primers that defined the endpoints of the amplicon. When the repro-ducibility of the real-time RT-PCR protocol was evaluated, the interrun and intrarun coefficients of variation were averaged over the whole range of calibration curve to reflect realistic variation over the complete quantification range. The CVs for theCTdata were neglible (⬍4% [Table 2]), which is consistent with the results of previous studies and significantly better than the 14% reported for conventional RT-PCR (36).
For appropriate gene expression analysis as a reflection of biological processes and comparison of expression between samples, differences in the input RNA quantity and in the efficiency of cDNA synthesis are corrected by normalization to appropriate endogenous reference or maintenance genes. Re-cent reports of variation in supposedly stable housekeeping genes, such as glyceraldehyde 3-phosphate-dehydrogenase (GAPDH) indicate that no reference gene should be assumed to be suitable for any given set of conditions (9). Some authors suggest that the use of a single gene to normalize expression is no longer sufficient, whereas others argue that it is preferable to normalize to one gene that shows minimum variation in expression (32). Although using a normalization factor derived from multiple reference genes may be beneficial when a suit-able single reference gene cannot be found, there is a financial consideration of using multiple reference genes over a large data set which, depending on the experimental system, may not be necessary. The choice of the2M housekeeping gene for this study was based on invariance demonstrated in previous studies (8) and verified in our experimental system, with an average change of less than twofold.
The initial assay development and validation was performed using mRNA extracted from mitogen-stimulated PBMCs. To reduce the time, cost, and labor involved with the isolation of PMBCs, a whole-blood assay format was subsequently adopted. Whole-blood aliquots were incubated with PPD-bovis antigen overnight, followed by RNA extraction using a blood-specific RNA extraction kit. In this format, the assay was com-pleted within 24 h and has the potential to become largely automated for testing large numbers of animals. The expres-sion of IFN-␥mRNA was readily detectable fromM. bovis -infected deer as early as 4 h following PPD-bovis stimulation of blood, with peak production occurring by 16 to 24 h. These results are consistent with previous reports of IFN-␥ expres-sion kinetics (30) and supported measuring IFN-␥mRNA re-sponses after 16 to 24 h of PPD-bovis stimulation of blood culture as a promising indicator of mycobacterial sensitization. During the induction or in vitro recall of a CMI response, antigenic stimulation results in the clonal expansion of antigen-specific lymphocytes and the elaboration of type-1 cytokines, including interleukin-2, IFN-␥, and tumor necrosis factor al-pha. These associations are well characterized for mice, hu-mans, and cattle, but are not clear for the response of cervid PBMCs toM. bovisantigen stimulation. The temporal kinetics of recall IFN-␥mRNA and protein production and lymphocyte proliferation in response to mycobacterial antigen stimulation were compared during the 7-monthM. bovisinfection study. Recall responses of inoculated deer were detected by 30 to 44 days p.i., implying that recently infected deer, i.e., those
in-fected for less than 4 weeks, would not be detected by these CMI assays. Responses reached a peak at approximately 3 months p.i., followed by a generalized reduction in CMI re-sponsiveness at 4 to 6 months p.i. A moderate level of corre-lation (r⫽0.214) was noted between lymphocyte blastogenesis and the IFN-␥-based assays. This correlation may not have been greater because as an effector cytokine, IFN-␥ is not directly associated with lymphoproliferation. This is in contrast with interleukin-2, which stimulates the proliferation of lym-phocytes through auto- and paracrine effects following antigen stimulation (11). Additionally, it is likely that as the LPA assay runs for 5 days, other cell populations that are not IFN-␥ producers (such as B cells) are induced to proliferate, reducing the association between proliferation and IFN-␥mRNA and protein production, which were measured at 16 and 48 h, respectively.
In contrast, a higher correlation (r⫽0.613) was noted be-tween IFN-␥mRNA transcripts and the release of IFN-␥ pro-tein in response to ex vivo PPD-bovis stimulation. Because gene expression is controlled at both the transcriptional and posttranscriptional levels, the expression of mRNA does not guarantee that mRNA levels will correspond to protein expres-sion. The association between IFN-␥mRNA and protein noted in this study, however, is consistent with others reporting a correlation between cytokine mRNA expression and protein production or biological activity (13).
Despite alterations in immune responsiveness observed over time, skin testing produced a significant enhancement or boost of lymphocyte proliferation, IFN-␥mRNA, and IFN-␥protein recall responses during the 1- to 4-week period post-skin test. This phenomenon, in which the inoculation of mycobacterial antigens affects the subsequent reactivity to the same antigens has been known for more than a century. Both experimentally and naturally infected animals have demonstrated such anam-nestic responses. This phenomenon may be exploited to en-hance the separation between the response of infected and noninfected subpopulations and thus improve the accuracy of testing (35). Further studies are required to characterize the full duration of the effect in cervids, whether it occurs through-out the disease process, and whether it also occurs in naturally infected animals.
The kinetics of CMI-based reactivity over the course of the infection study impacted the diagnostic performance of all assays. The reduced CMI responses at 4 to 6 months p.i. translated into the failure of the LPA and IFN-␥ assays to consistently classify infected deer as positive reactors during this period. This finding is consistent with the well-recognized observation that there is a failure of animals with advanced infection to respond to CMI-based assays (34). Such an alter-ation in the nature of the immune response is an inherent limitation of CMI-based assays that may impact the diagnosis and control of the infection in the field. If CMI-based assays are combined with serological tests, however, infected animals in which CMI is waning could be identified. This waning effect was abrogated in this study during the post-skin testing period, where analogous to the increased magnitude of the CMI re-sponses, there was improved detection of M. bovis-infected deer.
Given the central importance of robust IFN-␥production to the antimycobacterial immune response, it is not surprising
on August 17, 2020 by guest
http://cvi.asm.org/
that diagnostic assays for TB have exploited this aspect of the immune response. This study demonstrates the broad potential application of IFN-␥ mRNA analysis to TB diagnosis. The exposure of wildlife to M. avium and other nontuberculous
Mycobacteriumspp., however, may induce cross-reactive
sen-sitization toM. bovisantigens, impacting the specificity of the test. Further studies are necessary to assess positive test inter-pretation based upon increased IFN-␥responses withM. bovis
tuberculin relative to that observed withM. aviumtuberculin analogous to commercial bovine TB ELISA assays. Actual application to any particular species requires confirmation by independent study as was recently performed for European badgers (27). Ultimately, the main usage of such tests may be to monitor the prevalence of disease in various wildlife popu-lations, to screen animals prior to entry into disease-free herds, or to monitor the spread of infection in zoological parks.
ACKNOWLEDGMENTS
Financial support for this study was provided by the Canadian Food Inspection Agency.
We acknowledge the assistance of Jim Algire and the animal care staff for blood collection and animal handling at the Ottawa Labora-tory Fallowfield and Parks Canada Agency staff from Riding Mountain National Park for blood collection and handling of free-ranging elk. We also gratefully acknowledge the technical assistance of Wendy Monagle, Jessica Pollock, Anna Romanowska, and Erin Tangorra.
REFERENCES
1.Clifton-Hadley, R. S., J. W. Wilesmith, M. S. Richards, P. Upton, and S. Johnston.1995. The occurrence ofMycobacterium bovisinfection in cattle in and around an area subject to extensive badger (Meles meles) control. Epi-demiol. Infect.114:179–193.
2.Coleman, J. D., and M. M. Cooke.2001.Mycobacterium bovisinfection in wildlife in New Zealand. Tuberculosis (Edinb.)81:191–202.
3.Cousins, D. V., and N. Florisson.2005. A review of tests available for use in the diagnosis of tuberculosis in non-bovine species. Rev. Sci. Tech.24:1039– 1059.
4.de la Rua-Domenech, R., A. T. Goodchild, H. M. Vordermeier, R. G. Hewinson, K. H. Christiansen, and R. S. Clifton-Hadley.2006. Ante mortem diagnosis of tuberculosis in cattle: a review of the tuberculin tests, gamma-interferon assay and other ancillary diagnostic techniques. Res. Vet. Sci.81:190–210. 5.Desem, N., and S. L. Jones.1998. Development of a human gamma
inter-feron enzyme immunoassay and comparison with tuberculin skin testing for detection ofMycobacterium tuberculosisinfection. Clin. Diagn. Lab. Immu-nol.5:531–536.
6.Flynn, J. L., J. Chan, K. J. Triebold, D. K. Dalton, T. A. Stewart, and B. R. Bloom.1993. An essential role for interferon gamma in resistance to Myco-bacterium tuberculosisinfection. J. Exp. Med.178:2249–2254.
7.Griffin, J. F. T., J. P. Cross, D. N. Chinn, C. R., Rodgers, and G. S. Buchan.
1994. Diagnosis of tuberculosis due toMycobacterium bovisin New Zealand red deer (Cervus elaphus) using a composite blood test and antibody assays. N. Z. Vet. J.42:173–179.
8.Hamalainen, H. K., J. C. Tubman, S. Vikman, T. Kyrola, E. Ylikoski, J. A. Warrington, and R. Lahesmaa.2001. Identification and validation of endog-enous reference genes for expression profiling of T helper cell differentiation by quantitative real-time RT-PCR. Anal. Biochem.299:63–70.
9.Huggett, J., K. Dheda, S. Bustin, and A. Zumla.2005. Real-time RT-PCR normalisation; strategies and considerations. Genes Immun.6:279–284. 10.Katial, R. K., J. Hershey, T. Purohit-Seth, J. T. Belisle, P. J. Brennan, J. S.
Spencer, and R. J. Engler.2001. Cell-mediated immune response to tuber-culosis antigens: comparison of skin testing and measurement of in vitro gamma interferon production in whole-blood culture. Clin. Diagn. Lab. Immunol.8:339–345.
11.Kumar, A., W. Weiss, J. A. Tine, S. L. Hoffman, and W. O. Rogers.2001. ELISPOT assay for detection of peptide specific interferon-gamma secreting cells in rhesus macaques. J. Immunol. Methods247:49–60.
12.Lalvani, A., A. A. Pathan, H. McShane, R. J. Wilkinson, M. Latif, C. P. Conlon, G. Pasvol, and A. V. Hill.2001. Rapid detection ofMycobacterium tuberculosis infection by enumeration of antigen-specific T cells. Am. J. Respir. Crit. Care Med.163:824–828.
13.Listvanova, S., S. Temmerman, P. Stordeur, V. Verscheure, S. Place, L.
Zhou, C. Locht, and F. Mascart.2003. Optimal kinetics for quantification of antigen-induced cytokines in human peripheral blood mononuclear cells by real-time PCR and by ELISA. J. Immunol. Methods281:27–35.
14.Livak, K. J., and T. D. Schmittgen.2001. Analysis of relative gene expression data using real-time quantitative PCR and the 2⫺⌬⌬CT
method. Methods
25:402–408.
15.Michel, A. L., R. G. Bengis, D. F. Keet, M. Hofmeyr, L. M. Klerk, P. C. Cross, A. E. Jolles, D. Cooper, I. J. Whyte, P. Buss, and J. Godfroid.2006. Wildlife tuberculosis in South African conservation areas: implications and chal-lenges. Vet. Microbiol.112:91–100.
16.Monaghan, M. L., M. L. Doherty, J. D. Collins, J. F. Kazda, and P. J. Quinn.
1994. The tuberculin test. Vet. Microbiol.40:111–124.
17.Nishi, J. S., T. Shury, and B. T. Elkin.2005. Wildlife reservoirs for bovine tuberculosis (Mycobacterium bovis) in Canada: strategies for management and research. Vet. Microbiol.112:325–328.
18.Nolan, T., R. E. Hands, and S. A. Bustin.2006. Quantification of mRNA using real-time RT-PCR. Nat. Protoc.1:1559–1582.
19.Office International des Epizooties.2004. Manual of diagnostic tests and vaccines for terrestrial animals. Office International des Epizooties, Paris, France.
20.Outteridge, P. M., and A. W. Lepper.1973. The detection of tuberculin-sensitive lymphocytes from bovine blood by uptake of radio-labelled nucleo-sides. Res. Vet. Sci.14:296–305.
21.Pai, M., L. W. Riley, and J. M. Colford, Jr.2004. Interferon-gamma assays in the immunodiagnosis of tuberculosis: a systematic review. Lancet Infect. Dis.4:761–776.
22.Palmer, M. V., W. R. Waters, D. L. Whipple, R. E. Slaughter, and S. L. Jones.
2004. Evaluation of an in vitro blood-based assay to detect production of interferon-gamma by Mycobacterium bovis-infected white-tailed deer (Odocoileus virginianus). J. Vet. Diagn. Investig.16:17–21.
23.Payeur, J. B., J. L. Jarnagin, and J. C. Marquardt.1992. Laboratory meth-ods in veterinary mycobacteriology for the isolation and identification of mycobacteria. United States Department of Agriculture, National Veteri-nary Services Laboratories, Ames, IA.
24.Pfaffl, M. W., G. W. Horgan, and L. Dempfle.2002. Relative Expression Software Tool (REST) for group-wise comparison and statistical analysis of relative expression results in real-time PCR. Nucleic Acids Res.30:e36. 25.Rothel, J. S., S. L. Jones, L. A. Corner, J. C. Cox, and P. R. Wood.1990. A
sandwich enzyme immunoassay for bovine interferon-gamma and its use for the detection of tuberculosis in cattle. Aust. Vet. J.67:134–137.
26.Rozen, S., and H. Skaletsky.2000. Primer3 on the WWW for general users and for biologist programmers. Methods Mol. Biol.132:365–386. 27.Sawyer, J., D. Mealing, D. Dalley, D. Dave, S. Lesellier, S. Palmer, J.
Bowen-Davies, T. R. Crawshaw, and M. A. Chambers.2007. Development and evaluation of a test for tuberculosis in live European badgers (Meles meles) based on measurement of gamma interferon mRNA by real-time PCR. J. Clin. Microbiol.45:2398–2403.
28.Schmitt, S. M., S. D. Fitzgerald, T. M. Cooley, C. S. Bruning-Fann, L. Sullivan, D. Berry, T. Carlson, R. B. Minnis, J. B. Payeur, and J. Sikarskie.
1997. Bovine tuberculosis in free-ranging white-tailed deer from Michigan. J. Wildl. Dis.33:749–758.
29.Slobbe, L., E. Lockhart, J. Kelly, and G. Buchan.2000. The production and biological assessment of cervine interferon gamma. Cytokine12:1211–1217. 30.Stordeur, P., L. Zhou, B. Byl, F. Brohet, W. Burny, D. de Groote, T. van der Poll, and M. Goldman.2003. Immune monitoring in whole blood using real-time PCR. J. Immunol. Methods.276:69–77.
31.Thoen, C. O., J. L. Jarnagin, C. C. Muscoplat, L. S. Cram, D. W. Johnson, and R. Harrington, Jr.1980. Potential use of lymphocyte blastogenic re-sponses in diagnosis of bovine tuberculosis. Comp. Immunol. Microbiol. Infect. Dis.3:355–361.
32.Vandesompele, J., K. De Preter, F. Pattyn, B. Poppe, N. Van Roy, A. De Paepe, and F. Speleman.2002. Accurate normalization of real-time quanti-tative RT-PCR data by geometric averaging of multiple internal control genes. Genome Biol. 3:RESEARCH0034.1–034.11. http://genomebiology .com/2002/3/7/research/0034.
33.Waters, W. R., M. V. Palmer, R. E. Slaughter, S. L. Jones, J. E. Pitzer, and F. C. Minion.2006. Diagnostic implications of antigen-induced gamma in-terferon production by blood leukocytes fromMycobacterium bovis-infected reindeer (Rangifer tarandus). Clin. Vaccine Immunol.13:37–44.
34.Welsh, M. D., R. T. Cunningham, D. M. Corbett, R. M. Girvin, J. McNair, R. A. Skuce, D. G. Bryson, and J. M. Pollock.2005. Influence of pathological progression on the balance between cellular and humoral immune responses in bovine tuberculosis. Immunology114:101–111.
35.Wood, P. R., and S. L. Jones.2001. BOVIGAM: an in vitro cellular diag-nostic test for bovine tuberculosis. Tuberculosis (Edinb.)81:147–155. 36.Zhang, J., M. Desai, S. E. Ozanne, C. Doherty, C. N. Hales, and C. D. Byrne.
1997. Two variants of quantitative reverse transcriptase PCR used to show differential expression of alpha-, beta- and gamma-fibrinogen genes in rat liver lobes. Biochem. J.321:769–775.