A Comprehensive Filter Feature Selection
for Improving Document Classification
Le Nguyen Hoai Nam
Ho Bao Quoc
School of Information Technology
School of Information Technology
VNUHCM - University of Science
VNUHCM - University of Science
Ho Chi Minh City, Vietnam
Ho Chi Minh City, Vietnam
[email protected]
[email protected]
Abstract
High dimension of bag-of-words vectors poses a serious challenge from sparse data, overfitting, irrelevant features to document classification. Filter feature selection is one of effective methods for dimensionality reduction by removing irrelevant features from feature set. This paper focuses on two main problems of filter feature selection which are the feature score computation and the imbalance in the feature selection performance between categories. We propose a novel filter feature selection
method, named ExFCFS, to
comprehensively resolve these problems. We experiment on related filter feature selection methods with two benchmark datasets - Reuters-21578 dataset and Ohsumed dataset. The experimental results show the effectiveness of our solutions in terms of both Micro-F1 measure and Macro-F1 measure.
Keywords— bag-of-words vector, filter feature selection, document classification
1 Introduction
Document classification is to assign documents to predefined categories based on their text contents (Sebastiani 2002). It is a useful tool for managing the organization of a large set of documents. In the document classification, a bag-of-words vector is usually used for presenting a document (Yang et al. 2012), (Joachims 1996). Concretely, a document
is shown in the form of a vector in which each term appearing in the document is considered as a feature.
However, with a large set of documents, the dimension of a bag-of-words vector can reach thousands (Fragoudis et al. 2005), (Yang et al. 2012). Therefore, it poses a serious challenge from sparse data, overfitting, irrelevant features to document classification (Fragoudis et al. 2005), (Sebastiani 2002). In (Bellman 1961), the author referred it to as "the curse of dimensionality". Thus, dimensionality reduction is a major research area.
The aim of dimensionality reduction is to decrease the number of features without degrading the performance of the system (Sebastiani 2002). An efficient approach for dimension reduction is Feature Selection (FS) (Yang and Pedersen 1997). Feature selection eliminates irrelevant features to select a good subset of the original feature set. A strong point of FS is that the interpretation of the important features in the original set is not altered in dimensionality reduction process.
Two main types of FS are wrapper methods (Bermejo et al. 2014) and filter methods (Yang and Pedersen 1997). Wrapper methods select a subset of features which is the most suitable with a specific classification algorithm. Conversely, filter methods do not depend on any classification algorithms. It relies on a function for evaluating the importance of a feature in the classification process. A subset of features is selected by simply ranking the value of every feature on the evaluation function. Therefore, it is commonly used in document classification (Fragoudis et al. 2005), (Yang et al. 2012).
169
known method of this approach (Yan et al. 2005). It optimizes the separation of categories (clusters) in the filter FS process. It is implemented into
of a term as following:
( )
= ( )− ( )
| |
(2)
Where is the number of documents in training set; is the mean vector of all documents in training set; is the number of documents in category ; is the mean vector of all documents in ; ( ) denotes the feature value of term in global centroid vector ; ( ) denotes the feature value of term in category centroid vector
According to (Yang and Pedersen 1997), a way for computing the global score of term for the
category prediction, ( ), is the
average of the category-specific scores of term over the different categories as following:
( )
= ( ) ( , )
| |
(3)
From Eq. (2) and Eq. (3), ( , )
can be presented as following:
( , )
= ( )− ( ) (4)
2 Approach
In this section, we analyze two filter feature selection approaches which are the frequency-based approach and the cluster-frequency-based approach. Our aim is to point out their weak points and strong points to propose a filter feature selection method for improving the performance of document classification.
For the frequency-based approach,
( , ) is a comprehensive combination of the frequency-based intra-category condition, which is ( | ), and the frequency-based inter-category condition, which is
( | ). Regarding the frequency-based inter-category condition, ( | ) is rewritten according to conditional probability theory as following:
( | ) = ( , ) + 1
( ) + | |
Where ( , ) is the frequency of term in category ; ( ) is the frequency of term in the training set; | | is the number of categories. For ( | ), the greatness of the proportion of the frequency of term in category to the frequency of term in the other categories is utilized to present the contribution of term for discriminating category from the other categories. However, this is not really perfect because a term almost never showed in category but often appearing in the other categories is still useful for classifying a document into category
.
Therefore, an inter-category condition in ( , ) is presented more clearly under the view point of clustering. Concretely, this is the deviation of the representative of term in category/cluster , which is the centroid value of term in ( ( )), to the representative of term in the training set, which is the centroid value of term in the training set ( ( )) as shown in ( , ). In the other hand, ( , ) presents such a good inter-category condition but does not mention any conditions of term for intra-category . Therefore, according to the conclusion of CMFS (Yang et al. 2012), this is not good for a filter FS process.
Based on this observation, we propose a novel filter feature selection approach for the combination of the cluster-based inter-category
condition, which is ( , ) as Eq.
(4), and the frequency-based intra-category condition, which is the first part of Eq. (1). The formula of FCFS is as following:
( , )
= ( | ). ( )− ( )
= ( , ) + 1 ( , ) + | |.
( )− ( )
Where ( , ) is the sum of the frequency of all terms in category ; | | is the number of terms in the bag-of-words vector.
3.4 Experimental Result and Discussion
Table 5-8 show the experimental results of the filter feature selection methods in our study. It can be noted from these tables as following:
In terms of Macro-F1, the best filter selection methods are FCFS and ExFCFS. In comparison between them, ExFCFS products better result than FCFS.
Regarding Micro-F1, ExFCFS attains the most favourable result. FCFS is often superior to IG, CHI, OCFS, CMFS, but at the large number of selected features, their differences are rather small.
An exact explanation for the goodness of FCFS and ExFCFS is the effective combination of the clustered-based inter-category condition and frequency-based intra-category condition in the computation of their term score. This lends support to the theory of CMFS (Yang et al. 2012).
To observe detailed performance of filter feature selection methods, we present F1-measure of each category with CMFS, IG, FCFS, and ExFCFS at 60 features in Fig. 1-2. Specifically, FCFS and ExFCFS show the effectiveness with rare categories as “Ship, Trade, Grain, Interest, Money-Fx, Crude” of Reuters-21578 dataset and “C01, C06, C08, C10, C12, C20, C21” of Ohsumed dataset in comparison with IG and CMFS. This occurs due to the reason that in case of IG, CMFS, the score of a term with respect to a category is based on the greatness of the frequency of a term in the entire category, while the frequency of a term in rare categories is very low. Conversely, FCFS and ExFCFS only use the centroid value of a term in every category and in the training set for
term score computation. Therefore,
they preliminarily improve the feature selection performance of rare categories.
Next, we consider the correlation between performance of FCFS and ExFCFS. ExFCFS is actually an extended version of FCFS for radically overcoming the imbalance of classification performance between categories after filter feature selection process. As analyzed in this paper, this problem is directly caused by the imbalance of the number of training documents between categories and the imbalance of the separation degree between categories. Therefore, in ExFCFS, we adjust FCFS score of a term with respect to a
category in inverse proportion to these factors in order to improve the classification performance of rare categories and poor separation categories after filter feature selection process. Especially, both of these two factors are occurred in Reuters-21578 datset and Ohsumed dataset. Under these properties of two experimental datasets, the performance of ExFCFS is superior to that of FCFS. This accounts for the effectiveness of our adjustments in ExFCFS formula.
Fig. 1: F1-measure of CMFS, IG, FCFS, and ExFCFS on Reuter dataset at 60 features
Fig. 2: F1-measure of CMFS, IG, FCFS, and ExFCFS on Ohsumed dataset at 60 features
0 10 20 30 40 50 60 70 80 90 100
CMFS IG FCFS ExFCFS
0 10 20 30 40 50 60 70 80
C01 C04 C06 C08 C10 C12 C14 C20 C21 C23
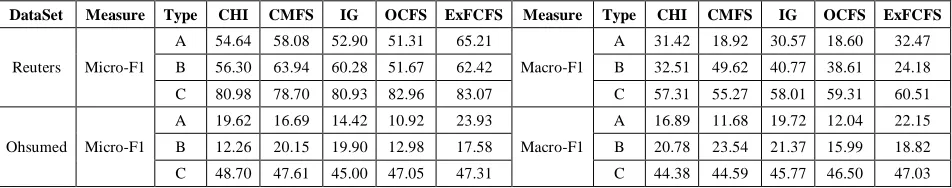
Table 9 shows the performance of dissimilar terms and similar terms selected by filter FS methods. For the comparison between two FS methods, similar terms are terms selected by both of them, while dissimilar terms are terms selected by only one of them. Clearly, dissimilar terms are the most important for considering two FS methods. The result listed in Table 9 shows that at top-60 selected terms, dissimilar terms of FCFS are superior to those of CHI, IG, CMFS, and OCFS but is inferior to those of ExFCFS. This is one of strong evidences for the superiority of ExFCFS and FCFS over the other methods.
Regarding dimension reduction rate, due to the best Micro-F1 and Macro-F1 results of ExFCFS, it produces better dimension reduction rate than the other methods in all two datasets as shown in Fig. 3-4. FCFS is superior to CHI, IG, CMFS and OCFS at the small number of selected features and they show the competition at the larger number of features. However, based on dimension reduction rate formula presented in Eq. (10), FS methods having better performance at smaller number of selected features are preferred. Therefore, dimension reduction rate of FCFS is better than that of CHI, IG, CMFS, and OCFS as presented in Fig. 3-4.
(a) (b)
Fig. 3. Dimension Reduction Rate on Reuters-21578 dataset: (a) for Macro-F1; (b) for Micro-F1
(a) (b)
Fig. 4. Dimension Reduction Rate on Ohsumed dataset: (a) for Macro-F1; (b) for Micro-F1
400 500 600 700 800 900 1000
CHI CMFS ExFCFS FCFS IG OCFS 768.33
659.84 901.04
837.27
740.61 781.94
900 950 1000 1050 1100 1150 1200
CHI CMFS ExFCFS FCFS IG OCFS 1100.40
1033.14 1142.53
1109.80
1084.12 1094.67
400 450 500 550 600 650 700
CHI CMFS FxFCFS FCFS IG OCFS 559.26 558.39
677.27
610.63
563.74 581.50
400 450 500 550 600 650 700
CHI CMFS ExFCFS FCFS IG OCFS 626.57
589.69 685.25
637.59
FS 20 60 100 200 400 600 800 1000 1200 1400 1600 1800 2000
CHI 48.88 58.12 62.21 64.91 64.22 65.03 66.24 67.97 65.95 66.53 67.32 66.91 66.67 CMFS 35.82 55.83 61.3 63.44 64.56 65.92 67.53 66.01 65.85 67.78 67.53 66.43 66.46 ExFCFS 58.89 67.08 73.83 72.57 73.35 70.72 71.53 71.15 71.75 71.64 71.86 71.67 71.18
FCFS 53.55 62.00 70.12 71.75 71.85 67.74 68.9 68.58 68.24 70.62 69.8 69.52 69.37
IG 45.45 58.56 61.23 63.99 64.18 64.6 65.48 66.7 67.39 66.8 67.3 67.39 66.36 OCFS 49.66 60.00 63.02 64.43 67.36 66.65 66.97 67.13 67.86 67.18 66.95 66.88 66.87
Table 5: Macro-F1 result on Reuters-21578 dataset. Bold numbers are the top 2 performances
FS 20 60 100 200 400 600 800 1000 1200 1400 1600 1800 2000
CHI 72.95 81.93 86.13 86.73 87.14 87.51 88.05 88.23 87.73 87.69 87.76 87.55 87.48 CMFS 65.14 80.45 84.79 85.8 85.91 86.16 88.2 88.05 87.94 88.27 88.05 87.59 87.69
ExFCFS 76.48 85.74 87.15 88.23 89.23 89.94 89.05 88.94 89.20 89.05 89.23 89.09 88.76
FCFS 73.12 84.1 87.06 87.82 87.82 87.97 88.07 88.11 87.11 87.23 87 87.89 87.61 IG 70.88 81.98 85.89 86.41 87.09 87.87 88.02 87.94 87.98 87.66 87.69 87.8 87.33 OCFS 71.36 83.89 86.11 87.73 88.30 88.05 88.23 88.16 88.2 87.94 87.73 87.48 87.51
Table 6: Micro-F1 result on Reuters-21578 dataset. Bold numbers are the top 2 performances
FS 20 60 100 200 400 600 800 1000 1200 1400 1600 1800 2000
CHI 32.59 44.59 49.83 50.71 53.52 54.32 53.82 52.96 52.34 51.59 51.08 50.98 50.37 CMFS 33.72 43.08 47.4 49.69 51.76 51.96 52.65 52.44 52.74 52.5 52.27 51.91 51.66 ExFCFS 43.93 51.66 53.33 54.33 56.40 56.75 56.15 56.51 55.97 55.02 54.79 54.36 54.29
FCFS 37.26 49.21 50.82 51.8 54.07 54.49 54.2 54.13 53.47 53.28 52.78 52.37 52.23 IG 33.07 45.34 48.8 51.28 53.43 54.44 53.82 52.98 52.34 51.6 51.1 50.98 50.36 OCFS 34.53 46.68 49.8 51.88 53.77 54.2 54.54 54.03 53.59 53.46 52.65 52.02 52.3
Table 7: Macro-F1 result on Ohsumed dataset. Bold numbers are the top 2 performances
FS 20 60 100 200 400 600 800 1000 1200 1400 1600 1800 2000
CHI 39.69 48.8 50.71 51.8 52.88 54.04 53.43 52.79 52.44 51.94 51.37 51.45 50.88 CMFS 38.23 43.91 44.9 48.01 50.68 51.56 51.63 52.69 53.15 53.04 52.94 52.57 52.39 ExFCFS 45.22 51.60 52.97 53.06 55.54 56.22 55.96 56.67 56.09 55.43 55.37 55.21 54.99
FCFS 41.35 47.97 50.51 50.97 53.2 53.85 53.87 54.24 53.75 54.76 53.35 53.19 52.9
IG 39.79 44.31 48.78 50.65 52.99 54.15 53.42 52.81 52.43 51.93 51.39 51.45 50.87 OCFS 40.66 47.24 49.83 50.61 53.02 53.63 54.39 54.12 53.97 54.08 53.4 52.96 52.34
Table 8: Micro-F1 result on Ohsumed dataset. Bold numbers are the top 2 performances
DataSet Measure Type CHI CMFS IG OCFS ExFCFS Measure Type CHI CMFS IG OCFS ExFCFS
Reuters Micro-F1
A 54.64 58.08 52.90 51.31 65.21
Macro-F1
A 31.42 18.92 30.57 18.60 32.47 B 56.30 63.94 60.28 51.67 62.42 B 32.51 49.62 40.77 38.61 24.18 C 80.98 78.70 80.93 82.96 83.07 C 57.31 55.27 58.01 59.31 60.51
Ohsumed Micro-F1
A 19.62 16.69 14.42 10.92 23.93
Macro-F1
A 16.89 11.68 19.72 12.04 22.15 B 12.26 20.15 19.90 12.98 17.58 B 20.78 23.54 21.37 15.99 18.82 C 48.70 47.61 45.00 47.05 47.31 C 44.38 44.59 45.77 46.50 47.03
Table 9: Micro-F1 and Macro-F1result of similar terms and dissimilar terms selected by FCFS and the other FS methods at top-60 selected terms. A, B, and C indicate dissimilar terms of the corresponding FS, dissimilar terms of FCFS, and their similar terms respectively.
4 Conclusion
This paper propose a comprehensive filter FS method, named ExFCFS, for computing feature score and overcoming the imbalance of FS performance between categories. In ExFCFS, the feature score with respect to a specific category is the combination of the cluster-based inter-category condition and the frequency–based intra-category
References
Aggarwal, C. C., & Zhai, C. (2012). A survey of text classification algorithms. In Mining text data (pp. 163-222). Springer US.
Asuncion, A., & Newman, D. (2007). UCI machine learning repository.
Bermejo, P., Gámez, J. A., & Puerta, J. M. (2014). Speeding up incremental wrapper feature subset selection with Naive Bayes classifier. Knowledge-Based Systems, 55, 140-147.
Bellman, R., (1961). Adaptive control processes: a guided tour (Vol. 4). Princeton: Princeton university press.
Chakraborti, S., Mukras, R., Lothian, R., Wiratunga, N., Watt, S. N., & Harper, D. J. (2007, January). Supervised Latent Semantic Indexing Using Adaptive Sprinkling. In IJCAI (pp. 1582-1587).
Friedman, J., Hastie, T., & Tibshirani, R. (2001). The elements of statistical learning (Vol. 1). Springer, Berlin: Springer series in statistics
Fragoudis, D., Meretakis, D., & Likothanassis, S. (2005). Best terms: an efficient feature-selection algorithm for text categorization. Knowledge and Information Systems, 8(1), 16-33.
Gomez, J. C., & Moens, M. F. (2012). PCA document
reconstruction for email
classification. Computational Statistics & Data Analysis, 56(3), 741-751.
Gunal, S., & Edizkan, R. (2008). Subspace based feature selection for pattern recognition. Information Sciences, 178(19), 3716-3726.
Hall, M., Frank, E., Holmes, G., Pfahringer, B., Reutemann, P., & Witten, I. H. (2009). The WEKA data mining software: an update. ACM SIGKDD explorations newsletter, 11(1), 10-18.
Howland, P., & Park, H. (2004). Generalizing discriminant analysis using the generalized singular value decomposition. Pattern Analysis and Machine Intelligence, IEEE Transactions on, 26(8), 995-1006.
Joachims, T. (1996). A Probabilistic Analysis of the Rocchio Algorithm with TFIDF for Text Categorization (No. CMU-CS-96-118).
Joachims, T. (1998). Text categorization with support vector machines: Learning with many relevant features (pp. 137-142). Springer Berlin Heidelberg.
Liu, H., & Motoda, H. (Eds.). (1998). Feature extraction, construction and selection: A data mining perspective. Springer Science & Business Media.
Platt, J. (1999). Fast training of support vector machines using sequential minimal optimization. Advances in kernel methods—support vector learning, 3.
Porter, M. F. (1980). An algorithm for suffix stripping. Program, 14(3), 130-137.
Quinlan, J. R. (1986). Induction of decision trees. Machine learning, 1(1), 81-106.
Sebastiani, F. (2002). Machine learning in automated text categorization. ACM computing surveys, 34(1), 1-47.
Taşcı, Ş., & Güngör, T. (2013). Comparison of text
feature selection policies and using an adaptive framework. Expert Systems with Applications, 40(12), 4871-4886.
Yan, J., Liu, N., Cheng, Q., ... & Ma, W. Y. (2005, August). OCFS: optimal orthogonal centroid feature selection for text categorization. In Proceedings of the 28th annual international ACM SIGIR conference on Research and development in information retrieval (pp. 122-129). ACM.
Yang, J., Liu, Y., Zhu, X., Liu, Z., & Zhang, X. (2012). A new feature selection based on comprehensive measurement both in inter-category and intra-category for text categorization. Information Processing & Management, 48(4), 741-754.
Yang, J., Liu, Z., Qu, Z., & Wang, J. (2014, June). Feature selection method based on crossed centroid for text categorization. In Software Engineering, Artificial Intelligence, Networking and Parallel/Distributed Computing (SNPD), 2014 15th IEEE/ACIS International Conference on (pp. 1-5). IEEE.