Android Malware Detection using Decision Trees
and Network Traffic
Nancy, Dr. Deepak Sharma
Department of CSE, Kurukshetra Institute of Technology and Management Kurukshetra, India
Abstract— Growing popularity of Android mobile operating system has not only attracted user community but also the malware developers towards this platform. Large number of malicious apps have been detected in the past years in Google Play Store and third party app markets. Many detection techniques have been proposed in the literature for Android malware detection but network traffic analysis of malwares has not been explored as compared to other parameters like permissions or system calls. In this paper we propose a technique for detecting malwares based upon network traffic of malwares. We compare network traffic of malwares with that of normal apps and find the features which distinguish both types of traffic. Based upon these features we build a decision tree classifier to detect normal and malicious apps from the testing dataset. Results show that such network traffic analysis is highly efficient in detecting Android malwares and accuracy of more than 90% is achieved by our experiments.
Keywords— Android Malware, Malware Detection, Network Traffic, Decision Trees.
I. INTRODUCTION
Android platform has beaten other mobile platforms like iOS, Windows etc. in terms of popularity which can be seen from the fact that more than 80% of the users have Android smartphones [1]. Even Google Play Store has more number of applications than Apple Play Store. Anything that gains popularity in this computing world soon becomes the target of malware attackers as well and the same trend followed with Android. Android malwares were first detected back in 2010 and since then they have been increasing in number. These malwares exist in the form of Android apps; as malware developers insert their malicious component inside the legitimate apps, repackage it and distribute it within official as well as third party app stores. This technique is commonly known as repackaging. Millions of malicious apps have been detected in both official and third party app stores of Android. Apart from repackaging, many other techniques like update attacks and drive by downloads are also ways of propagation of malware in Android system. These malwares pose various threats like financial loss to users, privacy leakage from the device, mobile devices remotely controlled as bots etc. amongst all mobile platforms, Android is the target for malware developers because of the reasons like: large number of users provide motive for malware developers; availability of app markets which provide easy distribution of malicious apps and open kernel policy of Android which is easy to understand from developer point of view. Hence it is easy for malware developers to make and propagate malicious apps for Android. According to the statistics
given in [2] “among all malwares targeting mobile devices, the share of Android malwares is higher than 46%”. Another recent report also alerts that “Android malwares have grown around 400 percent since summer 2010” [3].
Of all the android malwares which have been detected till date, some malwares are more dangerous than others because of the fact that they not only steal private information of the users but also send this information to some remote server and they are remotely controlled by the server. Given this significant growth in number of Android malware, there is a pressing need to effectively mitigate or defend against them. This work aims at detecting the presence of android malwares focusing on those malwares which are remotely controlled by some server to get the commands or those malwares who periodically connect to remote server to send private information of users or device itself. Not much work has been explored in this field of detection based upon network traffic for Android malwares. Such type of network traffic analysis based detection mechanism will help in building stronger solutions for detecting android malwares and other malwares for mobile as well as PC platforms.
The rest of the paper is organized as follows: in section II related work in the field of Android malware detection is discusses. Overall detection methodology which has been used in this work is discussed in section III. Detection results are presented in section IV. We conclude with advantages, limitations and future work directions of this work in section V.
II. RELATED WORK
[4] is a static technique which looks for risky APIs / risky keywords within java code of the application. They collected malware samples and created the database of risky APIs found in malwares and further searched for presence of such APIs in the public sector related apps like banking, flight booking etc. [5] is other such mechanism which does two order risk analysis of the applications collected from the official play store. First order analysis consists of analysing permissions within the manifest file i.e. what dangerous permissions are present in the application and second order analysis consists of heuristics based filtering in which heuristics like run time download of component by the application is considered to be malicious. [6] found set of permissions which can distinguish between normal apps and malicious apps. They used hierarchical bi-clustering technique to cluster the permissions in two groups i.e. normal and malwares. And then filtered out those permissions sets that are clearly distinguishable i.e. they are present in malicious apps but missing in normal apps. [7] evaluated potential risks hidden within the ad libraries of the applications. They extracted the ad libraries within the application and looked for dangerous permissions present within them. Dangerous permissions could lead to leakage of private information of the user. [8] is the tool available in the market for performing static analysis.
[9] is a dynamic approach which uses thread grained system call sequences rather than process grained system call sequences. The authors believed that malicious behaviour of the application is hidden within the single thread activity nor the across multiple threads. So thread grained system calls could give individual thread’s activity which is easier to analyse for signs of suspicious behaviour. [10] collected logs of system calls generated from the applications and applied clustering to differentiate between normal apps and the malicious ones. All this analysis of system calls are done at remote server. [11] collected parameters from PCB (process control block) of each process like page frames, page numbers, virtual memory, context switches etc. and mechanisms like fragmentation and frequent component analysis of data and time series logging have been used for analysis. [12] is a dynamic tool to check whether apps have information leakage capability or not. [13] considered network traffic as the feature for detection. They used emulator to capture the traffic of malwares and normal apps and rule based classifier was used for the detection purpose. This technique also used network traffic feature but it sued emulators for capturing the network traffic. Our work however uses actual smartphone to capture the traffic because of the fact that many malwares wait for system, related events like dialling a phone number, receiving a SMS etc. to trigger their malicious payloads. Such system related events are not possible in the emulator hence we have used actual smartphones in place of emulator. Moreover we have used decision trees to build our detection model. In the next section we explain the methodology.
III. METHODOLOGY
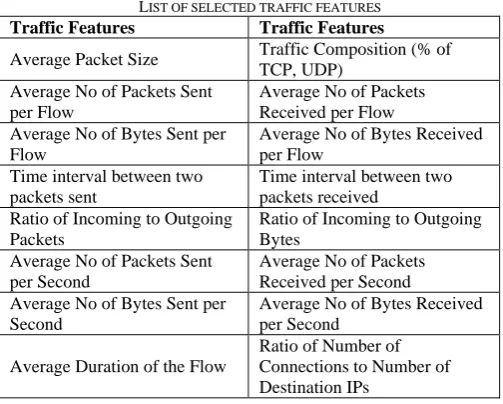
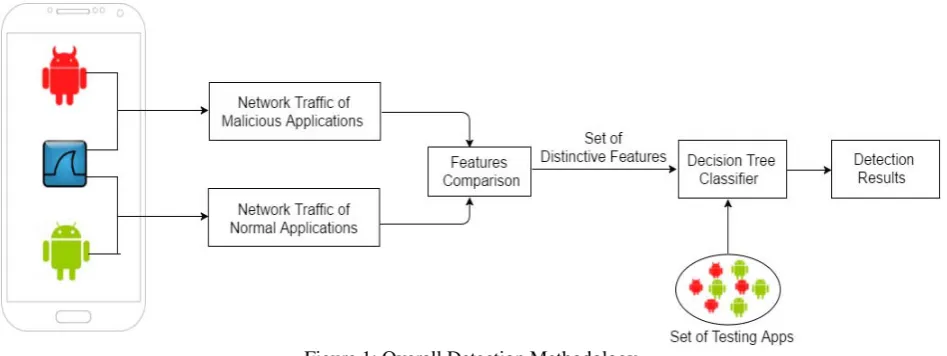
The methodology has been explained in figure 1. We start with capturing network traffic of malicious as well as normal apps. We use actual smartphones rather than the emulator as there are some malwares like AnserverBot or BaseBridge which do not trigger their malicious payloads until some system related events are complete. These events could be receiving a SMS, dialling a phone number or rebooting a phone etc. Since these events are not feasible in the emulator, we use actual smartphones for capturing smartphones. From the dataset of Android malware samples we take one by one a malicious sample, install it on the phone and run the tpacketcapture app to capture the application traffic. tpacketcapture app is available freely on the google play store which is used to capture network traffic on the smartphones. We have total of 100 malware samples and we capture traffic of samples one by one. After capturing traffic of malicious samples, we also capture traffic of normal samples so that we can distinguish traffic between these two categories. Normal apps like online dictionary, online gaming apps and normal web browsing like social networking etc. are used to capture normal traffic from smartphones. After capturing traffic from both malicious and normal apps we start analysis of traffic in terms of network traffic features. We select the following network traffic features mentioned in table I which we compare with both types of traffic. These traffic features are selected based upon the fact that these features have been useful in intrusion detection on desktops / PCs. So we assume same set or some subset of features can be used for malware detection on mobiles as well. Like average packet size of malicious traffic on desktops is low, so we expect this feature can result as a distinguishing feature for mobile environment as well. List of traffic features which have been selected for analysis is given in table I.
TABLE I
LIST OF SELECTED TRAFFIC FEATURES
Traffic Features Traffic Features
Average Packet Size Traffic Composition (% of TCP, UDP)
Average No of Packets Sent per Flow
Average No of Packets Received per Flow Average No of Bytes Sent per
Flow
Average No of Bytes Received per Flow
Time interval between two packets sent
Time interval between two packets received
Ratio of Incoming to Outgoing Packets
Ratio of Incoming to Outgoing Bytes
Average No of Packets Sent per Second
Average No of Packets Received per Second Average No of Bytes Sent per
Second
Average No of Bytes Received per Second
Average Duration of the Flow
Figure 1: Overall Detection Methodology
Android malware samples have been collected from Android Malware Genome Project []. Since our focus is on capturing network traffic of malwares, there may be some malwares which do not produce any network connectivity. So we filter out the malicious samples which have network connectivity: they may be leaking information to the server, or may be remotely controlled by the server. So the malicious samples which are used in our experiments are given in table II.
TABLE II MALWARE DATASET
AnserverBot BaseBridge Pjapps Plankton DroidDream DroidDreamLight BgServ RogueLemon DroidKungfu1 DroidKungfu2 DroidKungfu3 Droidkungfu4 DroidKungfuupdate GoldDream jSMSHider ADRD YZHC Geinimi GingerMaster DroidCoupon
The 16 features mentioned in table I are calculated for all the traffic samples captured: for both malwares as well as normal applications. Then from those features, set of distinguishing features are found. The feature is said to be distinguishing if it can clearly differentiate between malicious traffic and normal traffic. For example if for a particular feature F1, value of F1 for malicious traffic is between 10-20 and for normal it is between 30-40 so the ranges do not overlap and hence the feature F1 is distinguishing. If for any other feature values for malicious and normal samples overlap, then it is not a distinguishing feature. So from the 16 feature set we find out the features which are distinguishing features.
After finding out the distinguishing feature our aim is to build a detection model; we have used Decision Trees as the detection model. Decision trees are the supervised learning techniques used for classification. The goal of decision trees is to construct a model that can predict the value of a testing application based upon the simple decision rules inferred from the tree. There are several advantages offered by decision trees which is the reason for selecting this as decision classifier like: (a) constructing or
training the decision tree model is quick and easy; (b) fast prediction based upon the nodes of the tree; (c) they can easily handle irrelevant attributes; (d) robust against skewed distributions etc. In the next section we discuss the results achieved: what are the values of the traffic features; what are the distinguishing features and what is the accuracy of decision tree model.
IV. RESULTS AND DISCUSSION
features, our next step is to construct the decision tree based upon these distinct features only. We capture a separate set of testing apps which is a combination of malwares and normal apps. Again we capture traffic for each of the sample in the testing dataset. And we evaluate those 8 features again for every sample captured.
TABLE III
VALUES OF FEATURES FOR MALWARE AND NORMAL TRAFFIC
Traffic Feature Malware Traffic
Normal Traffic
Average Packet Size 90-40 600-700
Traffic Composition (% of TCP, UDP)
More than 90% TCP
More than 90% TCP Average No of Packets
Sent per Flow 10-12 20-30
Average No of Packets
Received per Flow 10-20 30-50
Average No of Bytes Sent
per Flow 500-2000 3000-6000
Average No of Bytes
Received per Flow 500-10000 40000-60000 Time interval between two
packets sent 0.3-100 0.5-1
Time interval between two
packets received 0.1-80 0.5-1.5
Ratio of Incoming to
Outgoing Packets 0.4-2 0.9-1.5
Ratio of Incoming to
Outgoing Bytes 0.5-5 7-8
Average No of Packets Sent
per Second 0.5-40 10-20
Average No of Packets
Received per Second 0.5-45 10-25
Average No of Bytes Sent
per Second 10-1000 17-2000
Average No of Bytes
Received per Second 15-2000 4000-5000
Average Duration of the
Flow 1-400 5-15
Ratio of Number of Connections to Number of Destination IPs
30-50 5-9
Since decision tree is built on only 8 distinguishing features, so we need not calculate all the 16 features again for the testing samples, we need to find out the values of 8 features only for all the applications whose decision needs to be made in the testing database. We capture 167 malicious traffic samples for testing and 50 normal samples for detection. Detection results are given in the table IV. Number in the bracket shows the number of samples for that malware family.
For example AnserverBot (10) shows we captured 10 samples of AnserverBot malware and all 10 were detected as malwares hence giving accuracy of detecting this malware as 100%. So we can see which malware family is getting detected by what accuracy. Malwares like AnserverBot, Plankton, RogueLemon, DroidKungFu1, DroidKungFuupdate, GoldDream and DroidCoupon achieve higherst accuracy of 100% as all of their samples get detected as malwares. On the other hand malwares like
DroidDream, DroidDreamLight and GingerMaster achive low accuracy in malware detection. Few of their samples get detected as normal. Whereas out of 50 normal traffic samples, 49 get detected corrected as normal giving high accuracy of 98%. The reason that few malwares were wrongly detected as normal could be the fact that these malwares might be using encryption techniques for obfuscation. Malwares try to evade detection by such techniques like encrypting their malicious payloads and look like normal traffic. So our technique achieves overall accuracy of more than 90% as total of 196 samples are correctly classified (147 correctly malware and 49 correctly normal) out of total of 217 samples. So we can conclude that our technique gives good results and it only fails in the cases when malwares use encryption for their network traffic activity.
V. CONCLUSION
In this paper we have used network traffic as the dynamic feature for Android malware detection. Network traffic has been used in previous works as well but rather than using emulators, we have used actual smartphones for capturing network traffic for malwares. Set of features which can distinguish between normal and malicious traffic are determined. Decision tree classifier is built on top of these distinguishing features only and set of 217 samples are given as input to the classifier. The model predicts more than 90% of the traffic samples correctly. It provides high accuracy and fails only in cases where there is some obfuscation techniques like encrypting the traffic used by malwares. In the future work we will focus on the deep packet analysis for detecting these obfuscated malwares as alone network traffic features cannot detect them.
TABLE IV
DETECTION RESULTS
Sample Detected
Malware
Detected
Normal Accuracy
AnserverBot (10) 10 0 100% BaseBridge (10) 9 1 90% Pjapps (10) 8 2 80% Plankton (10) 10 0 100% DroidDream (10) 7 3 70% DroidDreamLight (10) 5 5 50% BgServ (9) 8 1 88% RogueLemon (2) 2 0 100% DroidKungFu1 (10) 10 0 100% DroidKungFu2 (10) 9 1 90% DroidKungFu3 (10) 8 2 80% DroidKungFu4 (10) 8 2 80% DroidKungFuupdate
(1) 1 0 100%
GoldDream (10) 10 0 100% jSMSHider (10) 9 1 90% ADRD (10) 8 2 80% YZHC (10) 9 1 90% Geinimi (10) 9 1 90% GingerMaster (4) 4 3 75% DroidCoupon (1) 1 0 100% NORMAL (50) 1 49 98%
REFERENCES
[1] IDC, “Smartphone OS Market Share, 2015 Q2”, [Online]. Available. http://www.idc.com/prodserv/smartphone-os-market-share.jsp
[2] Number of the Week: at Least 34% of Android Malware Is Stealing
Your Data., [Online].Available http://www.kaspersky.com/about/news/ virus/2011/Number_of_the
Week at Least 34 of Android Malware Is Stealing Your Data
[3] Malicious Mobile Threats Report 2010/2011.
http://www.juniper.net/us/en/company/press-center/press-releases/2011/pr 2011 05 10-09 00.html.
[4] S.H. Seo, A. Gupta, A.M. Sallam, E. Bertino, K. Yim,, “Detecting mobile malware threats to homeland security through static analysis,”, Journal of Network and Computer Applications, vol. 38, pp.43-53.
[5] M. Grace, Y. Zhou, Q. Zhang, S. Zou, X. Jiang, “RiskRanker: Scalable and Accurate Zero-day Android Malware Detection”, In 10th International Conference on Mobile Systems, Applications and Services, June 2012 (2002) The IEEE website. [Online]. Available: http://www.ieee.org/
[6] V. Moonsamy, J. Rong, S. Liu “Mining permission patterns for contrasting clean and malicious android applications” Future Generation Computer Systems, vol. 36, September 2013, pp.122-132.
[7] M. Grace, W. Zhou, X. Jiang A. Sadheghi “Unsafe Exposure Analysis of Mobile In-App Advertisement”, In Proceedings of the
5th ACM Conference on Security and Privacy in Wireless and Mobile Networks (2012), ACM WiSec 2012.
[8] . BlackHat, Reverse Engineering with Androguard, [Online]. Available:
https://code.google.com/androguard
[9] Y. Lin, Y. Lai, C. Chen, H. Tsai, “Identifying android malicious repackaged applications by thread-grained system call sequences”, Computers & Security, vol. 39, pp.340-350.
[10] I. Burguera, U. Zurutuza, and S. Nadjm-Tehrani. “Crowdroid: Behavior-Based Malware Detection System for Android”. In Proceedings of the 1st Workshop on Security and Privacy in Smartphones and Mobile Devices CCS-SPSM’11, 2011.
[11] Shahzad, F., Akbar, M., Khan, S., Farooq, M.: Tstructdroid: Realtime malware detection using in-execution dynamic analysis of kernel process control blocks on android. Technical Report.National University of Computer & Emerging Sciences, Islamabad, Pakistan, (2013)
[12] William E, Peter G, Byunggon C, Landon C: “TaintDroid: An information flow tracking system for realtime privacy monitoring on smartphones” in Proceedings of 9th USENIX Symposium on
Operating Systems Design and Implementation.