132
The Material Composition and Technological
Characteristics of Ores in Chovdar Gold-Ore Deposit
(Lesser Caucasus)
Sh.F. Abdullayeva*, V.M. Baba-zadeh*, Sh.D. Musayev**, A.Z.Akhmedov***, N.A. Imamverdiyev*, A.E.Romanko****
Baku State University, Azerbaijan*
Azerbaijan International Mineral Resource Operating Company LTD**
Institute of Mineral Raw Materials of the Ministry of Ecology and Natural Resources of Azerbaijan*** Geological Institute, Academy of Sciences, Moscow, Russian Federation****
The material composition and technological peculiarities of the new morphogenetic type of gold ore mineral raw materials of one of the prospective gold ore deposits of Azerbaijan have been studied in detail by the example of seven laboratory technological samples.
Two natural types of ores have been established in Chovdar gold ore deposit: oxidized and primary sulphide that are delimited by the mixed semi-oxidized ores and have been provided for development together with oxidized ores in the future. Laboratory technological samples have been taken from core material representing different areas and types of deposit’s ores. Composite samples of Chovdar (with 700 kg weight) are mixture of deposit’s ores taken from various points and the occurrence depths of deposit. Other six compositions of Composite A (C1, C2, C3) and Composite B (C4, C5, C6) of the core samples, with 150 kg weigh of eachsamples , were intended to investigation of the technological features of this mineral raw materials and development of rational technological scheme of its processing. The chemical composition of ores and their total mineral composition including sulfur-containing mineral forms, mineral forms of copper, forms of separations and associations of the main ore minerals, forms of separations and associations of the precious metals have been investigated. The mineral composition of the samples’ material has been studied by the QEMSCANP
TM
P
operating system allowing determining their chemical composition and grain sizes along with quantitative assessment of the revealed mineral forms.
The gold is characterized by native state with a relatively small grain size, the principal amount of which (more than 80%) is closely associated with the non-metallic minerals in the oxidized ores (Composite A). Seven grains of the native gold, six of which with size - 2-8 µm, one relatively large - 30 µm have been revealed in water separation products of the heavy fraction. High-grade gold is 86.6-100.0% (average 96.7%). A significant part of the discovered grains of the silver minerals (they are 16 in all, their average size - 5 µm) includes in barite and is characterized as Ag-Cu alloy, native form, copper-containing minerals of silver sulfide – jalpaite Ag3CuS2 and shtromeyerite AgCuS. Nearly all these compounds as well as gold grains are closely associated and are partially covered by iron oxides.
Gold in the primary sulphide ores (Composite B) is also characterized mostly by small native grains, half of them (53%) is closely associated with sulphides of iron and copper, and the rest - with light non-metallic minerals. There have been found 21 grains of gold, one of them being relatively large (61 µm) has been presented in free state, three grains have been confined and the other 17 as small inclusions (1-8 µm) have been included in pyrite and copper sulfides (chalcopyrite, chalcocite, covelline) in the gravitational concentrated product (gold “head”/gold gravity concentrate) of this sample. The native gold in the primary ores is characterized by lower quality (average Au - 91,8%) than in the sample of the oxidized ores.
Low-sulfide quartz gold-containing ores are characterized with minimum amount of harmful impurities (As, Sb, F, Cl and Hg, CRorgR – it has been carried out by special analysis for
133 The revealed gold speciation in primary ores suggest that the most complete extraction of this metal can be provided due to the effective recovery of iron and copper sulfides from this type of ore. The last one may be carried out by flotation method.
Key words: Chovdar deposit, gold, material composition, mineral raw material, technological sample, oxidized ore, primary sulphide ore, mineral form.
INTRODUCTION Chovdar ore field with an area of about 350-400 kmP
2
P
is situated in the north-east and north flanks of the Dashkesan ore region. It is known the large Chovdar gold-sulphide deposit discovered relatively recently in the ore field where gold-contained secondary quartzites with area type of development especially “Central” area with near-surface occurrence of ore body providing its open development, hydrothermal-changed gold-bearing zones with vein and lenticular bodies, Danayerichay-Gartal Mountain – Pirinyal upstanding block with massive vein-disseminated ores of pyrite-chalcopyrite-galenite-sphalerite composition containing the precious metal within 0.2-6.0 ppm and et al. according to preliminary data are commercial. The abandoned Chovdar barite deposit is located within the ore field.
Chovdar gold-ore deposit area is composed of Upper Bajocian-Bathonian formations of Middle Jurassic which are crumpled into small isoclinal folds of the high-orders oriented in submeridional direction. The brachsynclinal and brachyanticlinal structures especially Chovdar volcanogenic brachyanticline have been revealed as well.
The dislocations with a break in continuity have a main role in the distribution of the deposit ore bodies. The main submeridional ore-controlling faults are located in the reduced zone with 2-3 km width and they are accompanied by a number of the parallel small disturbances and often healed with quartz, barite, quartz-calcite mineralization. The repeated tectonic activation of the area resulted in renewal of the ancient fractures and the formation of new ones predominantly north-easterly direction that provided rocks blocks movement. Therefore it has been revealed three major blocks (Shadakh-Chovdar-Chaykend, Danayerichay-Gartal Mountain-Pirinyal, Kyzylja-Laish) in the territory within which the fragments of the volcanic-tectonic structures, the areas of the consedimentary downwarping and etc. are preserved.
The material composition of the natural ores varieties of Chovdar gold ore deposit has been detail analyzed according to the results of the chemical analytical, mineralogical and other multi-method investigations of this work. The above-mentioned studies have mainly been carried out by SGS Mineral Services UK LTD (Ontario, Canada).
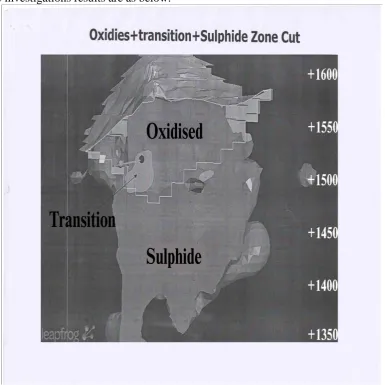
Two natural ores types: oxidized and primary sulphide are differentiated by complex semi-oxidized (transition zone) ores have been determined in Chovdar gold-ore deposit (Fig. 1). The investigations considered in this work have been carried out on seven technological laboratory samples taken from core material representing different areas and ores types of deposit [6, 7].
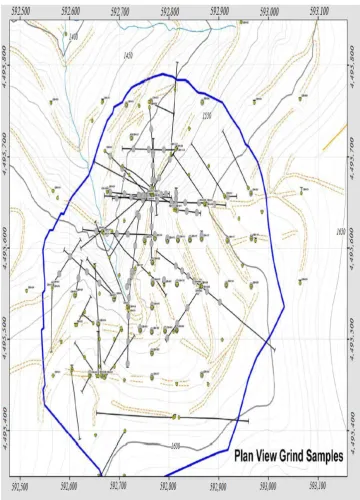
One of the samples - Chovdar Composite (with 700 kg weight) was ores mixture of deposit sampled evenly from various points and depths of the ore body occurrence (180 ordinary core samples taken from 69 drill holes) over the whole mineralized zones. The sample was intended for estimation of the crushability and grindability of the mineral raw materials. It was characterized the deposit in whole taking into consideration the ores proportionality according to lithology, texture, metasomatism and mineralization type in the ore field. The places and intervals of the material sampling (Chovdar Composite) from the core of the appropriate drill holes have been presented in Table 1 and Figure 2.
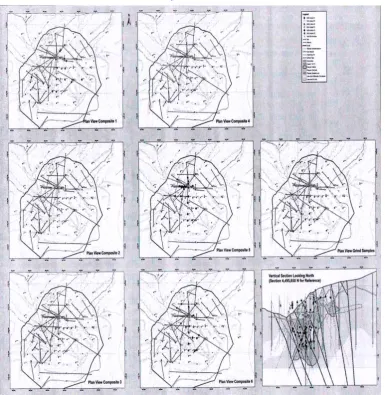
134 characterized the ores of the oxidation zone of the deposit in various parts and the depths of the ore body occurrence taking into account the ratios of gold and copper contents in them. Another three samples (C4, C5, C6) characterized the zone of primary sulphide ores of the deposit. They were also taken from different parts and the depths of the ore body occurrence taking into account the ratios of gold and copper contents in them. The places and intervals of the core material sampling of six technological samples taken from 234 points (intervals) of 44 drill holes have been presented in Table 2 and Figure 3.
Moreover the compositions in equal proportions: separately oxidized - Composite A (C1+C2 + C3) and primary (sulphide) - Composite B (C4+C5+C6) ores were composed of the above-mentioned six technological samples whereon state and occurrence forms of Au and Ag were studied in detail [7].
All above-mentioned samples were subjected to chemical and mineralogical analyses. These investigations results are as below.
135 Fig. 2. Places and intervals of “Chovdar Composite” material sample taken from core
136 Fig. 3. Places and intervals of core material sampling of six technological samples taken
from 234 points (intervals) of 44 drill holes
1. Chemical composition of the technological samples
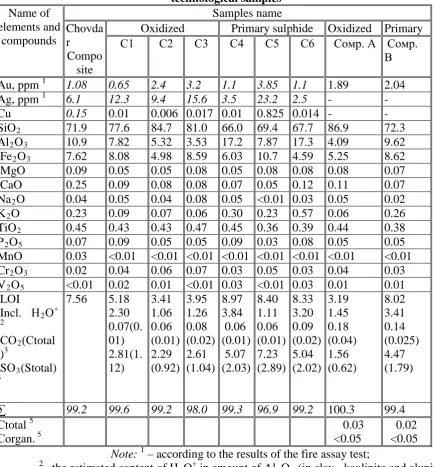
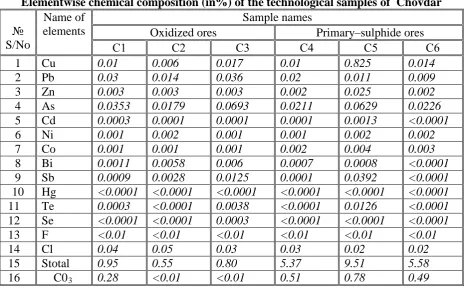
For research of the chemical composition of the considered laboratory technological samples it was carried out complete silicate (for rock-and ore-forming compounds - oxides), elementwise analysis for a number of practically important elements and also fire assay test for gold and silver. The results of chemical composition analysis according to main elements and compounds (oxides) contained in all above-mentioned technological samples have been presented in Table 1 but the results of the elementwise analysis of six main technological samples (C1-C6) have been presented in Table 2.
According to the Tables data the gold with content ranging from 0.65 to 3.85ppm is the main commercially valuable component in all considered technological samples. Silver with contents ranging from 2.5 to 23.2ppm is of certain interest for following extraction. Moreover it should be noted that relatively high content of copper - 0.825% has been revealed in one of the samples characterizing the primary ores (C5). It allows to suggest the possibility of the followingefficient extraction of the metal from the primary-sulphide ores type of the deposit.
137 Table 1
Chemical composition (in %) of the main elements and the compounds in the technological samples Name of elements and compounds Samples name Chovda r Compo site
Oxidized Primary sulphide Oxidized Primary С1 С2 С3 С4 С5 С6 Сомр. А Сомр.
В
Au, ppm P 1
1.08 0.65 2.4 3.2 1.1 3.85 1.1 1.89 2.04
Ag, ppm P 1
6.1 12.3 9.4 15.6 3.5 23.2 2.5 - -
Cu 0.15 0.01 0.006 0.017 0.01 0.825 0.014 - -
SiOR2 71.9 77.6 84.7 81.0 66.0 69.4 67.7 86.9 72.3
AlR2ROR3 10.9 7.82 5.32 3.53 17.2 7.87 17.3 4.09 9.62
FeR2ROR3 7.62 8.08 4.98 8.59 6.03 10.7 4.59 5.25 8.62
MgO 0.09 0.05 0.05 0.08 0.05 0.08 0.08 0.08 0.07 CaO 0.25 0.09 0.08 0.08 0.07 0.05 0.12 0.11 0.07 NaR2RO 0.04 0.05 0.04 0.08 0.05 <0.01 0.03 0.05 0.02
KR2RO 0.23 0.09 0.07 0.06 0.30 0.23 0.57 0.06 0.26
TiOR2 0.45 0.43 0.43 0.47 0.45 0.36 0.39 0.44 0.38
PR2ROR5 0.07 0.09 0.05 0.05 0.09 0.03 0.08 0.05 0.05
MnO 0.03 <0.01 <0.01 <0.01 <0.01 <0.01 <0.01 <0.01 <0.01 CrR2ROR3 0.02 0.04 0.06 0.07 0.03 0.05 0.03 0.04 0.03
VR2ROR5 <0.01 0.02 0.01 <0.01 0.03 <0.01 0.03 0.01 0.01
LOI Incl. НR2RОP
+ 2
СОR2R(Сtotal
)P 3
SOR3R(Stotal)RR
P
4
7.56 5.18 2.30 0.07(0. 01) 2.81(1. 12) 3.41 1.06 0.06 (0.01) 2.29 (0.92) 3.95 1.26 0.08 (0.02) 2.61 (1.04) 8.97 3.84 0.06 (0.01) 5.07 (2.03) 8.40 1.11 0.06 (0.01) 7.23 (2.89) 8.33 3.20 0.09 (0.02) 5.04 (2.02) 3.19 1.45 0.18 (0.04) 1.56 (0.62) 8.02 3.41 0.14 (0.025) 4.47 (1.79)
∑ 99.2 99.6 99.2 98.0 99.3 96.9 99.2 100.3 99.4
Сtotal P 5 Соrgan.P 5 0.03 <0.05 0.02 <0.05 Note:P 1 P
– according to the results of the fire assay test;
P
2
P
–the estimated content of HR2ROP +
P
in amount of AlR2ROR3R (in clay - kaolinite and alunite
according to data of the quantitative mineralogical analysis);
P
3
P
- the estimated content of COR2R in amount of MgO and CaO (in carbonates - MgCOR3R,
CaCOR3R);
P
4
P
– the estimated content of SOR3R included in the index of theLOI: SOR3R = LOI- (HR2RO + COR2R)
P
5
P
– according to the results of special analysis for carbon.
138 Table 2
Elementwise chemical composition (in%) of the technological samples of Chovdar
№ S/No
Name of elements
Sample names
Oxidized ores Primary–sulphide ores
С1 С2 С3 С4 С5 С6
1 Cu 0.01 0.006 0.017 0.01 0.825 0.014
2 Pb 0.03 0.014 0.036 0.02 0.011 0.009
3 Zn 0.003 0.003 0.003 0.002 0.025 0.002
4 As 0.0353 0.0179 0.0693 0.0211 0.0629 0.0226
5 Cd 0.0003 0.0001 0.0001 0.0001 0.0013 <0.0001
6 Ni 0.001 0.002 0.001 0.001 0.002 0.002
7 Co 0.001 0.001 0.001 0.002 0.004 0.003
8 Bi 0.0011 0.0058 0.006 0.0007 0.0008 <0.0001
9 Sb 0.0009 0.0028 0.0125 0.0001 0.0392 <0.0001
10 Hg <0.0001 <0.0001 <0.0001 <0.0001 <0.0001 <0.0001
11 Te 0.0003 <0.0001 0.0038 <0.0001 0.0126 <0.0001
12 Se <0.0001 <0.0001 0.0003 <0.0001 <0.0001 <0.0001
13 F <0.01 <0.01 <0.01 <0.01 <0.01 <0.01
14 Cl 0.04 0.05 0.03 0.03 0.02 0.02
15 Stotal 0.95 0.55 0.80 5.37 9.51 5.58
16 C0R3 0.28 <0.01 <0.01 0.51 0.78 0.49
Assessing the chemical composition of the considered ores samples it is necessary to note a very positive factor - small content of the harmful impurities such as As, Sb, F, Cl and Hg in them which are usually negatively reflected on processing technology of such gold-contained ores. Furthermore it is also necessary to note that this harmful material contents in both types of ores are small - <0.05% according to special analysis results for the organic carbon that carried out on the mixed samples of oxidized (Comp.A) and primary (Comp.B) ores (Table 1).
As expected it has been determined relatively high contents of the total sulphur (5.4 - 9.5%) in the primary sulphide ores samples in comparison with the oxidized ores samples (0.55 - 0.95%). Moreover relatively high contents of arsenic (0.063%) and antimony (0.039%) are observed in the primary ore sample (C5) with relatively high copper content (0.825%). This factor allows to suggest the existence of some (small) quantity of arsenic and antimony-containing possibly copper sulphide minerals in the considered ores.
Estimating the results of the chemical analysis for rock-and ore-forming compounds (Table 1) it should be noted that oxide silicon is main rock-forming compound in both oxidized and primary ores samples. Thereby the quantity of the mentioned compound (77.6 - 84.7%) in the oxidized ores is slightly higher than in the primary ores (66.0 - 69.4%).
Moreover slightly high contents of the clay-forming compound- AlR2ROR3R are observed in
the samples of both ores types. In addition considerably higher contents of the mentioned compound have been revealed in the primary ores samples (7.9 - 17.3%). This factor can have a negative effect on the ores treatment technology.
The low contents of the carbonate-forming compounds - CaO and MgO in the considered samples are positive factor especially for hydrometallurgical treatment technology of both oxidized and primary ores types. The contents limits of last ones are only 0.05- 0.12%.
139 ones then the limits of this element contents are ten times bigger - 5.4-9.5% in the second ones. Thereby iron oxide quantities (FeR2ROR3R) in the samples of both ores types are
approximately identical limits: in the oxidized ores - 5.0-8.6%, and in the primary ones - 4.6-10.7% (Table 1). This factor indicates that the main iron mass has presented by its oxide minerals with small quantity of iron sulphides in the oxidized ores samples (according to Table 2 data the presence of significant sulphides contents of other metals is very limited).
In primary ores samples with relatively low contents of copper (with the exception of C5 sample) and other non-ferrous metals in them the main iron quantity has most probably been represented by its sulphides. It allows to characterize the material of these samples as the primary - sulphide ore.
The presence of titanium oxide (TiOR2R) with contents ranging from 0.36 to 0.47% has
also been determined in the considered samples of both ores types that is probably connected with the presence of titanic iron ore - ilmenite (FeTiOR2R) and perhaps certain amount of rutile
and titanomagnetite in these ores.
The mineral composition of the investigated ores samples and characteristics of the detected minerals are considered in more detail below.
2. Mineralogical and petrographic investigations
The mineral composition of the samples material has been studied by QEMSCANP TM
P
operating system. This system has been based on the quantitative estimation of matter by scanning electron microscopy of the polished sections. This system together with quantitative estimation of the revealed mineral forms allows to determine their chemical composition and grains sizes.
2.1. Total mineral composition
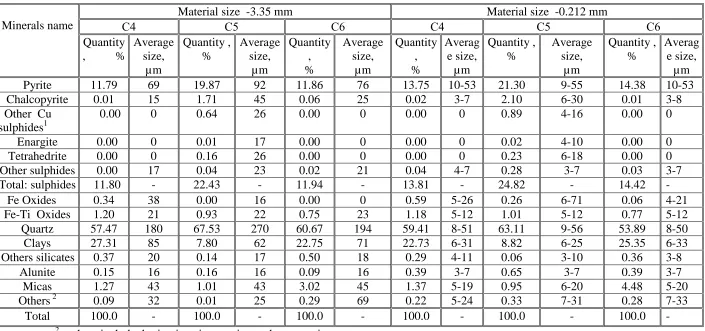
Total approximately quantitative mineral composition of the considered technologic samples and state (dimension) of the revealed minerals grains were studied on these samples materials which were crushed up to 2 sizes: -3.35 mm and -0.212 mm (Table 3.4).
According to the data presented in Table 3, quartz with mass fraction in the range of 74 - 88%, at average grains size - 0.22 - 0.34 mm (at the size of the investigated samples material -3.35 mm) is the main rock-forming mineral of the oxidized ores samples. On more finely crushed material (-0.212 mm) of these samples the quartz grains size is significantly decreased (up to 0.009-0.068 mm) by slight increasing this mineral mass fraction that is natural i.e. its attachments with other minerals are released and accordingly mass fraction of the analyzed mineral is more precisely characterized.
Relatively significant quantities of clay minerals (6-16%) with average grains size - 0.04-0.05mm and also slight quantities of other silicates (0.1- 0.4%), alunite (0.1- 0.7%), mica (0.05- 0.1%) and etc. including barite, jarosite, apatite, carbonates, zircon (summarily 0.4- 1.0%) have also been revealed from the rock-forming minerals in the oxidized ores samples.
According to semi-quantitative X-ray diffraction analysis (X-ray Diffraction) data the clays have mostly been represented by kaolinite (> 30 rel.%), partially dickite (10-30%) in small quantities – by illite, plagioclase, potassium feldspar (2-10 rel.%) in the considered samples.
Considering ore-forming minerals we note that they have represented in a greater degree by iron and iron-titanium oxides (summarily 3.6-6.1 abs.%)than by the sulphides of iron and copper (summarily 1-2.3 abs.%) in the samples of the oxidized ores.
140 Table 3 Approximately-quantitative mineral composition (%) and grains dimensionality (µm) of the revealed minerals
in the oxidized ores samples
Note:P 1
P
- other Cu sulphides include: chalcocite, covellite, bornite; P
2
P
– others include: barite, jarosite, apatite, carbonates, zircon. Minerals name
Material size -3.35 mm Material size -0.212 mm
С1 С2 С3 С1 С2 С3
Quantity , % Average size, µm Quantity , % Average size, µm Quantity , % Average size, µm Quantity , % Average size, µm Quantit y , % Average size, µm Quantity , % Average size, µm
Pyrite 2.57 57 1.35 45 2.16 47 1.67 9-38 0.98 9-28 2.13 8-35
Chalcopyrite 0.02 16 0.01 16 0.03 20 0.02 4-7 0.02 3-8 0.02 3-9
Other Cu sulphidesP
1
P
0.00 0 0.00 15 0.04 71 0.04 3-19 0.00 6-23 0.02 8-26
Enargite 0.00 0 0.00 0 0.00 0 0.00 0 0.00 0 0.00 0
Tetrahedrite 0.00 0 0.00 0 0.00 15 0.00 0 0.00 0 0.00 0
Other sulphides 0.00 16 0.05 34 0.02 16 0.02 3-8 0.02 3-8 0.11 4-8
Total: sulphides 2.59 - 1.41 - 2.25 - 1.75 - 1.02 - 2.28 -
Fe Oxides 5.40 50 1.81 49 3.40 52 4.11 8-30 2.23 6-32 4.07 7-29
Fe-Ti Oxides 1.13 21 1.23 21 1.52 21 1.95 5-13 1.37 5-12 2.09 5-12
Quartz 73.56 223 87.73 339 81.05 281 74.27 9-54 88.18 9-68 84.30 9-59
Clays 16.12 51 7.53 48 8.90 37 16.09 6-31 6.53 6-15 5.64 5-18
Others silicates 0.62 22 0.08 22 1.62 27 0.43 4-13 0.11 4-11 0.30 5-11
alunite 0.37 40 0.07 17 0.11 18 0.67 4-33 0.12 3-8 0.25 3-8
Micas 0.02 17 0.02 18 0.02 17 0.08 5-10 0.08 5-11 0.05 5-10
OthersP 2
0.18 27 0.13 40 1.14 74 0.65 7-37 0.38 5-28 1.00 6-39
141 Table 4 Approximately-quantitative mineral composition (%) and minerals grains dimensionality (µm) revealed in the primary sulphides ores
samples Note:P
1
P
- other Cu sulphides include: chalcocite, covellite, bornite;
P 2
P
- others include: barite, jarosite, apatite, carbonates, zircon. Minerals name
Material size -3.35 mm Material size -0.212 mm
С4 С5 С6 С4 С5 С6
Quantity , % Average size, µm Quantity , % Average size, µm Quantity , % Average size, µm Quantity , % Averag e size, µm Quantity , % Average size, µm Quantity , % Averag e size, µm
Pyrite 11.79 69 19.87 92 11.86 76 13.75 10-53 21.30 9-55 14.38 10-53
Chalcopyrite 0.01 15 1.71 45 0.06 25 0.02 3-7 2.10 6-30 0.01 3-8
Other Cu sulphidesP
1
P
0.00 0 0.64 26 0.00 0 0.00 0 0.89 4-16 0.00 0
Enargite 0.00 0 0.01 17 0.00 0 0.00 0 0.02 4-10 0.00 0
Tetrahedrite 0.00 0 0.16 26 0.00 0 0.00 0 0.23 6-18 0.00 0
Other sulphides 0.00 17 0.04 23 0.02 21 0.04 4-7 0.28 3-7 0.03 3-7
Total: sulphides 11.80 - 22.43 - 11.94 - 13.81 - 24.82 - 14.42 -
Fe Oxides 0.34 38 0.00 16 0.00 0 0.59 5-26 0.26 6-71 0.06 4-21
Fe-Ti Oxides 1.20 21 0.93 22 0.75 23 1.18 5-12 1.01 5-12 0.77 5-12
Quartz 57.47 180 67.53 270 60.67 194 59.41 8-51 63.11 9-56 53.89 8-50
Clays 27.31 85 7.80 62 22.75 71 22.73 6-31 8.82 6-25 25.35 6-33
Others silicates 0.37 20 0.14 17 0.50 18 0.29 4-11 0.06 3-10 0.36 3-8
Alunite 0.15 16 0.16 16 0.09 16 0.39 3-7 0.65 3-7 0.39 3-7
Micas 1.27 43 1.01 43 3.02 45 1.37 5-19 0.95 6-20 4.48 5-20
OthersP 2
0.09 32 0.01 25 0.29 69 0.22 5-24 0.33 7-31 0.28 7-33
142 Assessing the sulphides grains sizes we note that with size of the samples material -3.35 mm the average size of pyrite grains in them is 45-57 µm, chalcopyrite - 16-20 µm, other sulphides - 16-34µm. With material size - 0.212mm the pyrite grains size is decreased up to 8-38 µm, chalcopyrite up to 3-9 µm and other sulphides up to 3-8 µm. This factor is indicative of some sulphides overgrinding especially chalcopyrite even during fine ores crushing.
Considering the approximately-quantitative mineral composition of the primary-sulphide ores samples (Table 4) we note that the rock-forming minerals have mainly been represented by quartz in them as well as in the oxidized ores samples. However quartz quantity in these samples (54-63%) is significantly lower (at 20-25%) than in the oxidized ores samples. Moreover significant clay contents (23-27%) have been revealed in separate samples of the primary ores (C4, C6). It should also be noted that mica contents are higher than in the oxidized ores (1.4-4.5 %). The quantities of other rock-forming minerals (silicates, alunite and etc.) are almost at the same level as in the oxidized ores samples. Thereby list and size of minerals of the mentioned mineral matters (clays, silicates and etc.) are also nearly equal.
Considerably large quantity of the ore-forming minerals, the main of which is pyrite, has been revealed in the primary ores. Thereby pyrite quantity is more than 21% in the separate sample of the mentioned ores type (C5). In the same sample it has been defined the greatest quantity of different copper sulphides (3.2 %). The copper sulphides quantity (0.01-0.02%) is of no practical importance in other two samples (C4, C6).
It should be noted that the chemical analysis results for total sulphur content (Table 2) in the considered samples of the primary ores are slightly out of keeping with assay grade of this element according to the cumulative quantity of sulphides mentioned in Table 4. In the last one sulphides quantity has probably overestimated. However it should be noted that the mineral composition of the samples presented in Table 4 is approximately-quantitative.
Relatively low contents of iron oxides and titanium (summarily 0.8-1.7%) have been determined in the samples of the considered ores types. Thereby the mass fraction of the iron oxide itself is maximum in one of the samples (C4) only 0.59% but in the other two - 0.06-0.26%. This factor confirms the primary - sulphide nature of these samples ores.
The grains size of pyrite (70-90µm) and chalcopyrite (15-45µm) is slightly higher in the primary ores samples than in the oxidized ores ones. During relatively fine material crushing (up to -212 mm) there are observed some overgrinding of these minerals especially chalcopyrite as well as in the oxidized ores. This factor should be taken into account during development of flotation treatment technology of this ores type.
2.2. Sulphur-containing mineral forms
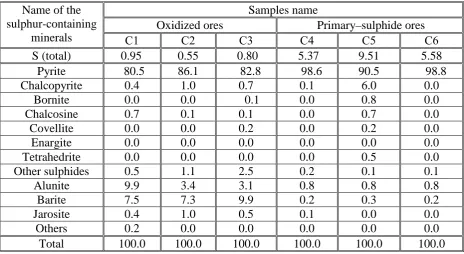
143 According to the presented data (Tab. 5) the main sulphur-containing mineral is pyrite in all considered samples. The largest pyrite quantity has been observed in the primary ores (90.5-98.8%).
Relatively high contents of alunite (3.1-9.9%), barite (7.3-9.9 %) and some quantity of jarosite (0.4-1.0 %) have been revealed from the sulphur-containing minerals in oxidized ores samples. The last one is usually characterized for oxidation zone ores of sulphide deposits.
The considerably lesser quantities of alunite (0.8%) and barite (0.2-0.3%) have been observed in the primary ores samples. The sulphur-containing mineral composition of these samples is generally characteristic of the primary ores of sulphide deposits. The list and quantitative relationships of copper sulphides in the samples are considered below in the appropriate section.
Table 5 The sulphur-containing minerals and their quantitative ralationships
in the technological samples (relative % from total sulphur content)
Name of the sulphur-containing
minerals
Samples name
Oxidized ores Primary–sulphide ores
С1 С2 С3 С4 С5 С6
S (total) 0.95 0.55 0.80 5.37 9.51 5.58
Pyrite 80.5 86.1 82.8 98.6 90.5 98.8
Chalcopyrite 0.4 1.0 0.7 0.1 6.0 0.0
Bornite 0.0 0.0 0.1 0.0 0.8 0.0
Chalcosine 0.7 0.1 0.1 0.0 0.7 0.0
Covellite 0.0 0.0 0.2 0.0 0.2 0.0
Enargite 0.0 0.0 0.0 0.0 0.0 0.0
Tetrahedrite 0.0 0.0 0.0 0.0 0.5 0.0
Other sulphides 0.5 1.1 2.5 0.2 0.1 0.1
Alunite 9.9 3.4 3.1 0.8 0.8 0.8
Barite 7.5 7.3 9.9 0.2 0.3 0.2
Jarosite 0.4 1.0 0.5 0.1 0.0 0.0
Others 0.2 0.0 0.0 0.0 0.0 0.0
Total 100.0 100.0 100.0 100.0 100.0 100.0
2.3. The mineral forms of copper
The mineral forms of copper and their relative quantitative relationships (at % from the total content of Cu in the sample) were also estimated in all six technological samples. The results of these investigations have been presented in Table 6. The initial copper contents in the analyzed sample determined by elementwise chemical analysis have been presented in this Table. (See. Table 2).
144 especially in the primary ores.
According to the conducted research results (Table. 6) it has been defined that the copper in the sample of C5 (at 49%) has represented by its primary sulphide - chalcopyrite and it is characterized totally almost at 45% by its secondary sulphides - chalcocite (25%), bornite (17%), and covellite ( 2.6%). Additionally small quantities of copper sulphides containig antimony - tetrahedrite (5.6 rel.%) and arsenic - enargite (0.5 rel.%) have been revealed in this sample. The small quantities of tetrahedrite and enargite have also been defined in other samples of the primary ores (C4, C6) characterized by low copper contents. Moreover nearly 30% of this metal has been presented by tetrahedrite in C5 sample with 0.014% copper content.
Assessing the presence of tetrahedrite and enargite in the oxidized ores samples we note that a small amount of tetrahedrite has been discovered only in one of these samples (C3).
Generally the mineral copper forms in the primary ores samples are characteristic of the mentioned natural type of the mineral raw materials of sulphide deposits. Slightly increased contents of the secondary copper sulphides (chalcocite and bornite) in C5 sample allow to suggest that probably some part of this sample has been taken from the mixed ores zone of deposit or from zone close to the oxidized ores.
Low copper contents in the considered samples of the oxidized ores don’t allow to justify sufficiently convincingly the oxidation degree of these samples material according to its mineral forms.
2.4. The forms of separations and assemblages of the main ore minerals
The forms of separations and assemblages of the main ore minerals are extremely important for technological assessment of ore mineral raw materials both among themselves and with host rocks minerals at a certain size of ore grinding. This factor allows to estimate the possible degree of the appropriate mineral component extraction from ore. The operating system (QEMSCANP
TM
P
) used for the considered mineralogical and petrographic investigations allows to carry out such investigations.
Table 6 The mineral forms of copper and their quantitative relationships
in the technological samples (at % from total content of Cu)
Name of the copper
minerals
Samples name
Oxidized ores Primary–sulphide ores
С1 С2 С3 С4 С5 С6
Cu total 0.01 0.006 0.017 0.01 0.825 0.014
Chalcopyrite 14.5 74.6 34.7 91.1 49.2 61.6
Bornite 0.1 0.0 18.3 0.4 16.9 4.3
Chalcosine 85.4 25.4 20.6 7.7 25.2 5.2
Covellite 0.0 0.0 25.2 0.0 2.6 0.0
Enargite 0.0 0.0 0.0 0.6 0.5 0.0
Tetrahedrite 0.0 0.0 1.1 0.2 5.6 28.9
145
Total 100.0 100.0 100.0 100.0 100.0 100.0
The investigations considered in this section have been carried out on the samples materials with size - 0.212 mm (50% -0.075 mm). Thereby the classes -0.212 +0.025 mm and - 0.025 mm +0.0 mm obtained by screen assay of the appropriate sample were separately investigated. Then the research results of the above-mentioned classes were combined and average grade (%) of the analyzed mineral form in the ore with size -0.212 mm was estimated in accordance with their yields.
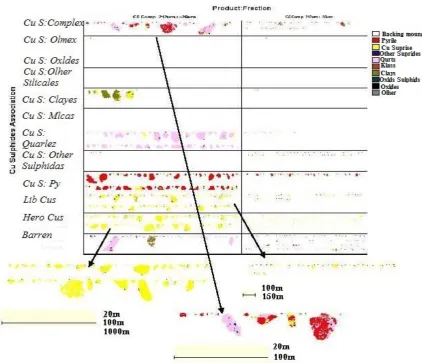
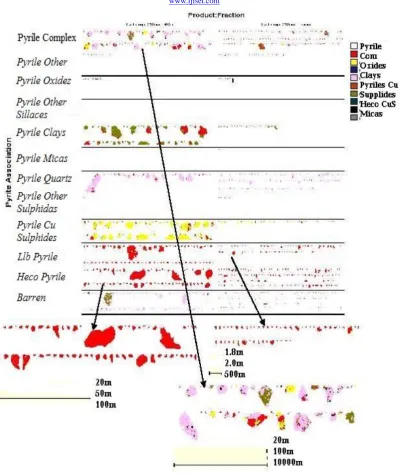
The research results of the separations forms and corresponding assemblages of copper sulphides in the combined material (with size - 0.212 mm) of the appropriate sample have been shown in Table 7 and similar investigations carried out for the iron sulphide - pyrite have been presented in Table 8. Moreover Figures 4 and 5 characterized different separations forms of copper sulphides (Figure 4) and pyrite (Figure 5) in this sample have been presented by the example of the most typical sample of the primary ore - C5 for visual estimation of this work.
Table 7 Quantitative relationships (relative %) of separation forms
and assemblages of copper sulphides
Name
of the copper sulphides assemblages
Samples name
Oxidized ores Primary–sulphide ores
С1 С2 С3 С4 С5 С6
Completely free 0.3 8.5 24.3 0.0 48.0 2.4
Mainly free 2.1 7.1 0.0 0.0 26.8 1.5
in association with pyrite 0.0 1.8 2.2 11.3 6.7 5.1
--«-- with other sulphides 0.0 0.0 0.4 0.0 2.9 0.0
--«-- with quartz 0.4 3.1 3.5 0.8 2.2 1.7
--«-- with mica 0.0 0.0 0.0 0.0 0.0 3.2
--«-- with clays 0.0 0.0 0.7 4.1 1.6 8.6
--«-- with other silicates 0.0 0.0 0.0 0.0 0.0 0.0
--«-- with Fe and Ti oxides 0.2 0.0 2.0 0.0 0.0 0.0
--«-- with other minerals 2.7 3.3 0.7 3.6 0.2 0.0
--«-- complicated complexes 94.2 76.3 66.4 80.2 11.6 77.5
146 Fig. 4. The forms of copper sulphides separations in the primary ore sample – C5
The data presented in Table 7 indicate that the copper sulphides in the samples with low contents of the mentioned metal both in the oxidized (C1-C3) and in primary (C4, C6) ores have mainly been presented (at 66-94 rel.%) by finely dispersed forms in close association with the complicated (hard diagnosable) complexes. In this regard the selective separation of copper minerals from such ores varieties seems both technologically and economically unreasonable.
The copper sulphides with the above-mentioned material size have mainly been represented (at 75%) by free forms in the primary ore sample (C5) with relatively high copper content (0.825%); about 10% of the mentioned minerals are characterized as assemblages with pyrite and other sulphides. This factor allows to suggest that during some material size reduction of such ores of deposit (up to 75-80% -0.074 mm) it is technologically possible to obtain sufficiently high indices of selective separation of copper minerals from them (up to 90%).
Assessing mineralogical state of pyrite (Table 8) we note that this mineral in the samples of both ores types is mostly characterized by free form. Thereby the total quantity and mainly free pyrite grains range from 53 to 76% in the oxidized ores samples but - 80-82% in the primary ores samples. Lower quantity of relatively free pyrite grains in oxidized ores samples is caused by comparatively high quantity of this mineral being in close association with quartz (6.5-30%) and with complex (difficult diagnosable) complexes (10-33%).
147 Table 8 Quantitative relationships (relative %) of separation forms
and assemblages of pyrite
Name
of the pyrite assemblages
Samples name
Oxidized ores Primary–sulphide ores
С1 С2 С3 С4 С5 С6
Completely free 68.5 48.1 45.4 58.3 65.6 57.9
Mainly free 7.8 11.2 7.7 22.1 16.6 22.4
in association with Cu sulphides 0.0 0.0 0.0 0.0 0.7 0.0
--«-- with other sulphides 0.0 0.0 0.0 0.0 0.0 0.0
--«-- with quartz 6.5 29.8 12.9 6.8 10.3 4.7
--«-- with mica 0.0 0.1 0.0 0.0 0.0 0.0
--«-- with clays 1.5 0.0 0.1 2.7 0.6 3.5
--«-- with other silicates 0.0 0.0 0.0 0.0 0.0 0.0
--«-- with Fe and Ti oxides 0.4 0.1 0.3 0.0 0.0 0.1
--«-- with other minerals 0.3 0.9 0.5 0.1 0.1 0.1
--«-- complicated complexes 15.0 10.0 33.1 10.0 6.2 11.2
148 Fig. 5. The forms of pyrite separations in the primary ore sample – C5
Generally the considered forms of pyrite separation indicate the possibility of its sufficiently effective separation from the primary ores of deposit (85%) by flotation enrichment method. Taking into account that the gold part in these ores can be closely associated with pyrite, this factor should be considered positive.
3. The forms of separations and assemblages of the precious metals
3.1. Material composition of the mixed samples of the oxidized and primary ores
149 samples (C4 + C5 + C6 - Composite B).
According to the fire assay test results the gold content in the mentioned mixed samples was: Composite A - 1.89 ppm; Composite B - 2.04 ppm. The complete chemical composition of the samples according to the rock- and ore-forming chemical compounds has been presented in above-mentioned Table 1.
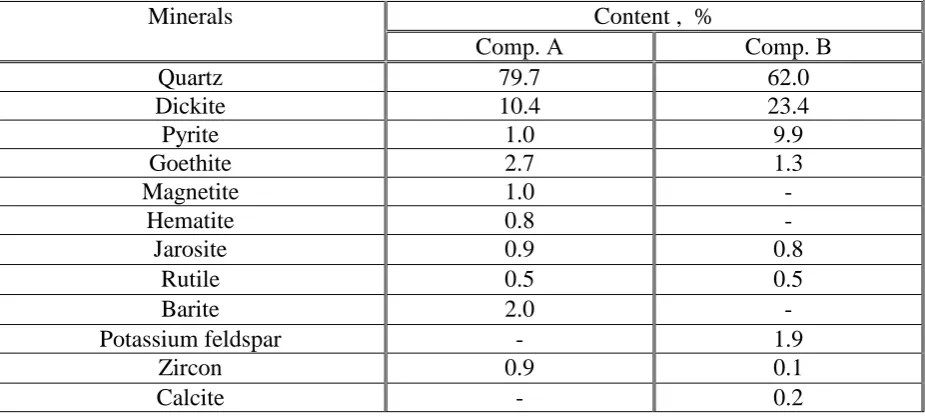
The semi-quantitative X-ray diffraction (XRD) mineralogical analysis was carried out on these materials of the mixed samples. Its preliminary results have been presented in Table 9 and approximately estimated contents of all revealed minerals have been shown in Table 10.
Table 9 Approximate results of the semi-quantitative X-ray diffraction (XRD) mineralogical
analysis of the mixed samples
According to the conducted investigations results (Table 9, 10) the mineral composition of both mixed samples is mainly equal. As expected the difference is only in that the pyrite quantity is considerably larger in primary ores sample (Comp. B) than in the oxidized ores sample (Comp. A). Conversely, the hydroxides and iron oxides (goethite, magnetite, hematite) and barite are relatively larger in the last one.
Generally the mineral compositions of the mixed samples - Comp.A and Comp.B are separately characteristic of the oxidized and primary ores of the moderately sulphide deposits. At the same time we note that the primary ores of Chovdar are excessively enriched by clay mineral - dickite (mineral with kaolinite composition - AlR2RSiR2ROR5R(OH)R4R).
Table 10 Approximately-estimated results of the semi-quantitative X-ray diffraction (XRD)
mineralogical analysis of the mixed samples
Minerals Content , %
Comp. А Comp. В
Quartz 79.7 62.0
Dickite 10.4 23.4
Pyrite 1.0 9.9
Goethite 2.7 1.3
Magnetite 1.0 -
Hematite 0.8 -
Jarosite 0.9 0.8
Rutile 0.5 0.5
Barite 2.0 -
Potassium feldspar - 1.9
Zircon 0.9 0.1
Calcite - 0.2
Samples name Content, %
Main (>30 rel.%)
Moderate (10-30 rel.%)
Small (2-10 rel.%)
Slight (<2 rel.%)
Composite A Quartz Dickite Goethite,
barite
Pyrite, magnetite, hematite, rutile,
zircon, jarosite
Composite В Quartz Dickite Pyrite
Goethite, rutile, jarosite, potassium
150
Total 99.9 100.0
3.2. Scheme of the mixed samples preparation for mineralogical investigations The investigations according to Au and Ag occurrence forms in the considered mixed samples A and B were carried out on the material of these samples (with 1.0 kg weight) crushed up to size -0.15 mm (80% -100 mesh). The samples preparation for mineralogical investigations was carried out according to the scheme (Fig. 6) including the preliminary separation of the сrushed material (-0.15mm) of the appropriate sample (about 0.45 kg) in the heavy liquid with a specific gravity of 3.1g/cmP
3
P
. Then for separation of the potentially free gold particles the obtained heavy fraction containing mainly the sulphides, iron oxides and heavy silicate minerals were subjected to thorough washing (separation) in the special pan with separation of 3 products: gold-containing “head”; iron oxides product; tailings separation sequentially for the sample the oxidized ore (A). 4 products: gold-containing “head”; sulphides product; product of the demolish minerals/(secondary); tailings of separation were distinguished in this operation for sulphide ore sample (B).
From all separation products (including ones from the light fraction due to heavy liquid separation) 13 polished sections, 7 of which presented the sample A and 6 - sample B were prepared and studied under an electron microscope. Moreover all separation products were subjected to gold assay test and it was estimated the distribution of this metal in them. The part of the separation products was also subjected to chemical analysis for Ag, Fe, As and S (Table 11).
Sample (-0.015 mm)
Heavy liquid separation (3.1g/smP 3
P
)
UHeavy fraction
Water separation in the pan
Fig. 6. Scheme of samples preparation for mineralogical investigations on gold
Research results (Table 11) carried out on the oxide ore sample (Comp.A) show that only about 16 % of the gold contained in the sample is distributed in the heavy fraction. During following water separation of this fraction in the pan only about 3% of mentioned ore metal is separated in so-called “gold head” (Au concentrate) with potentially possible presence of free grains of gold particles and about 11% of this metal is separated in Fe-Ti oxides product. These factors allow to suggest that the main quantity of the gold in the oxidized ores of deposit has been represented by small – fine-dispersed forms that can be closely associated with light non-metallic minerals. A small part of gold is closely associated with Fe-Ti oxides.
The investigations on the primary ore sample (Comp.B) have showed that more than 53% of the gold contained in the sample is distributed in the heavy fraction (with material yield – about 11%). The following water separation of the heavy fraction in the pan has
Light fraction
Sulphide product Fe oxides Au
concentrate demolish
minerals
Separations
151 allowed to receive “gold head” (Au concentrate with potentially possible presence of free gold grains) with distribution of only 3.5% of the mentioned metal in its. Moreover there was also obtained product of nearly pure iron sulphides (S-44.3%, Fe-40.9%) with extraction of gold (up to 43%) of this ore sample from its. These factors allow to suggest that the main quantity of the gold has been presented by small - fine-dispersed forms both in the primary ores of deposit and in the oxidized ores thereby almost half of them are closely associated with iron sulphides and the other half - with light non-metallic minerals.
Table 11 The gold distribution over separation products of the oxidized (Comp.A) and
primary (Comp.B) ores samples (see Fig. 6)
3.3.Mineralogical research of the polished sections
As it was noted for the assessment of Au and Ag occurrence forms in the considered mixed samples from all obtained separation products (see Fig. 6) 13 polished sections including 7 from the oxidized sample (Comp.A) and 6 from the primary ores sample (Comp.B) were prepared and examined under an electron microscope. At the same time it was carried out scanning and it was examined the revealed grains states of Au and Ag minerals including their sizes (length, width, surface area, estimated diameter), forms of the associations with other minerals (free, confined or enclosed inside the respective mineral) and also their chemical composition (spectral sounding) allowing to determine variety of the evaluated mineral compound.
3.3.1. Oxidized ores sample – Composite A
Only 7 signs (grains) of gold and 16 silver signs and its minerals were revealed in the mentioned material of the oxidized ores sample (Comp.A). Locations (names of ore concentration products), sizes and assemblages forms of the detected gold grains are shown in
Samples name
Separation products
Yield, %
Content, ppm, % Distribution Au, % Au,
ppm Ag, ppm
Fe, %
As, %
S, %
Oxidized Соmрosite
А
Au concentrate 0.15 35.3 - - - - 2.8
Fe-Ti oxides products 3.22 6.23 - 25.6 0.31 5.35 10.6 Water separation
tailings
0.72 6.23 - - - - 2.4
Total heavy fraction 4.09 7.30 - - - - 15.8 Light fraction 95.91 1.66 9.6 2.67 0.03 0.58 84.2 Initial ore sample 100.0 1.89 - - - - 100.0
Primary Соmрosite
В
Au concentrate 0.16 44.6 - - - - 3.5
Sulphides product 8.34 10.5 - 40.9 0.19 44.3 42.9 Product of the
demolish minerals
1.64 8.0 - 24.5 0.16 - 6.4
Water separations tailings
0.80 1.07 - - - - 0.4
152 Table 12 but their chemical composition (on Au and Ag) – in Table 13. Similar data on silver are presented in Tables 14 and 15. Moreover microphotographs (optical image) detected in the considered gold grains sample are shown in Fig. 7 and 8 but Ag minerals - in Fig. 9.
Table12 The sizes and forms of the gold assemblages in the oxidized ores sample
№
grains Product of Au grain detection
Grains sizes of Au, µm
Assemblages forms Length
Width Area, µmP
2 Estimated
diameter of grain
1 Fe oxides 12 5 60 8 Free
2 Fe oxides 12 6 72 8
Confined to chalcopyrite/covellite
3 Fe oxides 3 3 9 3 Enclosed in goethite
4 Water separation tailings
30 30 900 30 Free
5
Light fraction
7 2 14 4
Confined to undetermined mineral
6 Light fraction 2 2 4 2 --«--
7
Light fraction
2 2 4 2
Enclosed in the undetermined mineral/limonite
Limits of the estimated diameter of grains
2-30
Average diameter of all grains 8
The presented results of electron microscopy (Table 12) confirm previously stated suggestions concerning presence of the fine gold in the considered ores type. From 7 detected grains of the metal only one grain can be characterized as relatively large with the estimated diameter of 30 µm (0.03 mm). Moreover this grain is porous (Fig. 7a) and probably fine – “floating” because i.e. it has been discovered in the water separation tailings from ore heavy fraction. The rest of the grains are characterized by rather small forms with size of 2-8 µm. A part of very small almost dispersed grains (2-3 µm) is covered (enclosed) by iron oxides (Fig. 8, c).
Spectral sounding of the revealed gold grains (Table 13) has showed that according to the chemical composition (semi-quantitative analysis) all 7 grains are mainly characterized as high-standard native gold with basic metal contents in the range of 86.6 - 100.0%, on average - 96.7%. The grains numbers presented in Table 13 correspond to the above-mentioned ones in Table 12.
Table 13 The spectral zoning results of the revealed grains Au (Сомр.А)
№ grains
Content, % Compound name
153
1 100.0 - 100.0 Native Au
2 100.0 - 100.0 Native Au
3 87.7 12.3 100.0 Native Au
4 93.4 6.6 100.0 Native Au
5 100.0 - 100.0 Native Au
6 99.6 0.4 100.0 Native Au
7 86.6 13.4 100.0 Native Au
On average 96.7 3.3 100.0 Native Au
Table 14 The sizes and forms of the silver assemblages in the oxidized ores sample
№ grai ns Product of Ag grain detection
Grains sizes of Ag minerals, µm
Assemblages forms
Mineral name Length Width Area,
µmP
2 Estimated
diameter of grain
1 Fe oxides 12 2 24 5 Enclosed in
barite
Cu-Ag mineral
2 Fe oxides 10 4 40 6 Enclosed in
barite
Cu-Ag mineral
3 Fe oxides 14 3 42 6 Enclosed in
barite
Cu-Ag mineral
4 --«-- 15 4 60 8 Enclosed in
barite
Cu-Ag mineral
5 --«-- 10 2 20 4 Enclosed in
barite
Cu-Ag mineral
6 --«-- 7 2 14 4 Enclosed in
barite
Cu-Ag mineral
7 --«-- 4 2 8 3 Enclosed in
barite
Cu-Ag mineral
8 --«-- 4 0.5 2 1 Enclosed in
barite
Cu-Ag mineral
9 --«-- 10 2 20 4 Enclosed in
barite
Cu-Ag mineral
10 --«-- 4 2 8 3 Enclosed in
barite
Cu-Ag mineral
11 --«-- 8 3 24 5 Enclosed in
barite
Jalpaite-AgR3RCuSR2
12 --«-- 2 1 2 1 Enclosed in
barite
Jalpaite - AgR3RCuSR2
13 --«-- 8 3 24 5 Enclosed in
barite
Cu-Ag mineral
14 Light fraction
8 6 48 7 Enclosed in
barite
Native. Ag
15 Light fraction
12 3 36 6 Enclosed in
barite
Native Ag
16 Light fraction
16 2 12 3 Enclosed in
barite
154 Limits of the estimated diameter of
grains
1-8
Average diameter of all grains 5
Estimating occurrence forms the silver minerals in the oxidized ores sample (Table 14, Fig. 9) we note that all revealed grains of these minerals are characterized by rather small (1-8 µm) almost dispersed forms included in barite. According to the chemical composition (Table 15) determined by the spectral sounding the main quantity of these grains (7 signs) are characterized by Ag-Cu alloy, 2 grains – by native form of Ag, 2 more grains with copper-containing silver sulphide - jalpaite (AgR3RCuSR2R) and also one grain – by copper-containing
sulphide mineral- by stromeyerite (AgCuS).
Table 15 Resulting data of the spectral zoning of the detected Ag minerals grains in the oxidized
ores (Соmр.А)
Grains quantity
Elements contents, %
Ag minerals name
Ag Cu
S Limits Average
value
Limits Averag e value
2 84.1-96.7 90.4 3.3-15.9 9.6 - Native Ag
7 41.3-73.8 62.0 26.0-58.7 37.8 - Ag - Cu alloy 2 49.7-61.9 55.7 26.6-32.9 29.7 14.5 Jalpaite –
AgR3RCuSR2
1 55.1 28.6 16.33 Stromeyerite -
AgCuS
c d
Au
NOP
a b
Au
Au Py
155 Fig.7 Photographies of gold grains (yellow) in the oxidized ore sample 17T(17TСоmр.А) a) – big free and partially porous grain; b) – free grain near pyrite (Pv); c) – confined to
covellite (CV) and to dark (undetermined) minerals (NOP); d) – free (outlined by red), confined to dark (undetermined) minerals.
Fig.8. Photographies of small gold grains (outlined by red) in the oxidized ores sample (Соmp.А)
a and c) – enclosed in goethite; b) – enclosed in dark (undetermined) mineral (NOP)
a b
Goe NOP
c
156 Fig. 9. Photographies of Ag minerals grains in the oxidized ores sample 17T(17TСоmр.А)
All minerals enclosed in barite:
а) – Ag alloy (outlined by red) and stromeyerite -AgCuS (outlined by yellow); b) – Cu-Ag alloy (outlined by red) and jalpaite Cu-AgR3RCuSR2R (outlined by green); с) – Cu-Ag alloy
(outlined by red) and native silver (outlined by blue); d) – Cu-Ag alloy (outlined by red).
3.3.2. The primary ores sample - Сомрosite В
21 gold grains were revealed during microscopic investigations of six polished sections of the sample (Comp.B). All of them were found in the previously enriched sample material - Au concentrate. Locations (name of ore concentration product), the sizes and assemblages forms of the detected gold grains have been presented in Table 16 but their chemical composition (according to microspectral sounding data on Au and Ag) - in Table 17. In addition the microphotographs (optical image) of some revealed gold grains in the considered sample have been shown in Fig. 10.
Table 16 The sizes and forms of the gold assemblages in the primary ores sample (Соmр.В)
№ grains
Product of Au grain detection
Au grains sizes, µm
Assemblages forms Len
gth
Width Area,P 2
P
µm
Estimated diameter of
grain
1 Au concentrate 2 1 2 1 Enclosed in pyrite
2 Au concentrate 1 1 1 1 Enclosed in pyrite
3 Au concentrate 2 1 2 1 --«--
4 Au concentrate 6 2 12 3 --«--
5 Au concentrate 1 1 1 1 --«--
6 Au concentrate 7 4 28 5 Confined to pyrite
c d
a b
Au
Ba
Ba
Ba
157
7 Au concentrate 3 1 3 2 Enclosed in bornite/
Chalcocite/covellite
8 --«-- 2 2 4 2 --«--
9 --«-- 2 1 2 1 --«--
10 --«-- 5 2 10 3 --«--
11 --«-- 2 2 4 2 --«--
12 --«-- 1 1 1 1 --«--
13 --«-- 2 1 2 1 --«--
14 --«-- 5 4 20 4 --«--
15 --«-- 6 4 24 5 --«--
16 --«-- 2 1 2 1 --«--
17 --«-- 3 3 9 3 --«--
18 --«-- 7 3 21 5 --«--
19 --«-- 10 8 80 9
Confided to in bornite/chalcocite/ covellite
20 --«-- 4 3 12 3 --«--
21 --«-- 75 50 3750 61 Free
Limits of the estimated diameter of grains 1 - 61 Average diameter of all grains 6
Table 17 Resulting data of spectral sounding of some revealed gold grains
in the primary ores (Соmр.В)
Grains quantity
Elements content, %
Compounds name
Au Ag
Limits Average value
Limits Average value
3 85.7-95.3 91.8 4.7-14.3 8.2 Native Au
According to the carried out research results (Table 16) the main quantity of gold grains detected in this ores sample are characterized by very small, almost dispersed forms included in iron sulphides (pyrite) and copper (chalcopyrite, covellite, chalcocite). Only one grain from 21discovered grains is characterized as relatively large (61 µm) - free (Fig. 9, 1), three grains (with grain size of 3-9 µm) are evaluated as confided to the sulphides of copper and iron but the rest - 17 signs are presented by very small forms (mainly 1-3 µm) included (covered) in the mentioned sulphides.
According to microspectral sounding results of 3 gold grains (Table 17) they are classified as native gold. The content of the base metal in them ranges between 85.7 - 95.3 %, on average - 91.8%. It should be noted that this index of gold fineness is slightly lower than in the oxidized ores sample (96.7%, Table 13).
1 2
Au
Py
Py
158 Fig. 10. Photographies of gold grains (yellow and outlined in red) in the primary ores sample
(Comp.B) 1) - free; 2) - enclosed in pyrite (Py); 3) - enclosed in chalcopyrite/covellite/chalcocite (Cp/Cv/Cc)
CONCLUSION
Generally according to the mineralogical and petrographic investigations results of the mixed samples of the oxidized (Composite A) and primary sulphide ores (Composite B) can make the following conclusions.
The oxidized ores sample (Composite A)
1. The sample material is mainly presented by quartz (~ 80%), some quantity of the clay mineral - dickite (10%), iron oxide (5.5%) and by titanium (0.5%), barite (2%) and in small amount – by pyrite (1%).
2. Gold is characterized by the native state with a relatively small grains size in the sample material. Their main quantity (80%) is closely associated with light - non-metallic minerals (Table 11, the light fraction from separation of the sample material in heavy liquid).
3. 7 signs (grains) of native gold have been revealed in the water separation products of the heavy fraction, 6 of which are characterized by size in the range of 2-8 µm and one relatively large - 30 µm with a very porous structure.
4. According to assemblages forms two detected relatively large gold grains (8 and 30 µm) have been presented in free condition but the rest of them are in close assemblages and are partially covered (enclosed) by iron oxides.
5. According to microspectral sounding results almost all revealed native gold grains are characterized as high-standard ones with the base metal contents within 86.6-100.0% (on average 96.8 %).
6. 16 small grains of silver minerals (on average 5 µm) enclosed in barite have been discovered in the material of sample. The considerable part of these grains are characterized as Ag-Cu alloy, 2 grains - native form, 3 grains - copper-containing
NOP 3
Au Py
159 minerals of silver sulphide: jalpaite and stromeyerite.
7. The determined Au and Ag occurrence forms allow to suggest with great probability that the most complete separation of gold from the oxidized ores can be provided only with relatively fine comminution of these ores (in the range of 80 - 90% -75 µm). In this regard the use of heap leaching method for this mineral raw material seems ineffective and unpractical. As for silver that the effective separation of this metal is unlikely.
The primary sulphide ores sample of (Composite B)
1. The mineral composition of the sample is mainly identical with the oxidized ores sample (Comp.A) at considerably higher content of pyrite (10%) and slight presence of iron oxides (1.3%) which allows characterizing it’s as primary sulphide ore. It should be noted higher content of clay mineral - dickite (23%) in this sample. 2. Gold in the sample is also characterized mainly by small native grains, half of them (53%) is closely associated with iron sulphides and copper but the others - with light - non-metallic minerals.
3. 21 signs (grains) of gold have been detected in the gravity concentration product (gold “head”) of the sample. Only one relatively large (61 µm) is presented in free state, 3 grains are confined and other 17 in the form of small inclusions are enclosed (1- 8 µm) in pyrite and copper sulphides (chalcopyrite, chalcocite, covellite).
4. According to microspectral sounding results of 3 grains the native gold is characterized by lower quality (on average Au - 91.8%) in the primary ores than in the oxidized ores sample (96.8%).
5. The detected occurrence forms of Au in the primary ores allow to suggest that the most complete extraction of this metal can be provided due to the effective separation of the iron sulphides and copper from this ores type. The last one can be carried out by flotation method of concentration. Moreover it should be noted that relatively large free grain of Au detected in the considered ores allows to suggest the possibility of their separation by gravitational methods of concentration before sulphides flotation.
Reference
1. Azadaliyev J.D., Musayev Sh.F., Mammadova T.A. The characteristic features of Chovdar gold-ore deposit (Lesser Caucasus, Azerbaijan) // News of Baku University, Natural sciences series. 2013, №2, pp.117-130.
2. Baba-zadeh V.M., Musayev Sh.D., Nasibov T.N., Ramazanov V.G. Gold of Azerbaijan. Azerbaijan Milli Ensiklopediyasy (Azerbaijan National Encyclopedia). Baku, 2003, p.424. 3. Baba-zadeh V.M., Abdullayeva Sh.F. Precious metal ore-magmatic systems: Chovdar deposit, Somkhito-Garabakh region// News of Baku University, Natural sciences series. 2009, №3, pp.138-158.
4. Baba-zadeh V.M., Abdullayeva Sh.F. Precious metal ore-magmatic systems. Baku: BSU, 2012, 276 p.
5. Baba-zadeh V.M., Kekeliya S.A., Abdullayeva Sh.F., Kekeliya M.A. Gold-containing sulphide deposits of the island-arc paleosystems, their metallogenic peculiarities and geodynamic development conditions. Baku,“SVS”,2015, 400 p.
160 7. A Gold deportment study of two composite samples from the Chovdar deposit. Prepared for SGS MINERAL SERVICES UK LTD. 39TProject 12278-002–MI5011-JAN10.39T January 2,