ISSN 2348 – 7968
Real-Time Clustering for Big Data Streams
Bhavik C. Patel1
1
ME Wireless & Mobile Computing, GTU PG SCHOOL Ahmedabad, Gandhinagar, Gujarat, India
Abstract
Big data is a recent term Appeared that has to define the very large amount of data that surpass the traditional storage and processing requirements. Each and every growing volume of data generation is the reality. Today we are living in Social networks, smart cities, telephone networks, the internet are hand Reviews some of the data in the modern world and much of this information is discarded due to the high storage space. It Would require Relevant data can be extracted from this large amount of information and to be used to build better cities, offers better services, make predictive analysis, group similar information and many more applications. All of this is possible, due to machine learning and data mining can be found where patterns in the ocean of data generated every Second in order to cope with the volume, velocity and variety of data produced a streaming model has-been Studied. Were analysis of data has to uses low memory and process items only once.
Currently we are taking the advance of grid and cloud computing the missing component to help crunch this large amount of data is the power of distributed computing. Stream Processing Engines (SPE) have revealed to be a more flexible and powerful tool for dealing with Big Data.
This project merges the concepts of machine learning, streaming model and distributed computing to build a framework for developing, Testing and applying algorithms on large volume of data streams.
Keywords: Big Data , Big Data Clustering , Real Time Streaming , Clustering Technique , K-means Algorithm , MapReduce Algorithm.
1. Introduction
The Internet is a worldwide platform for sharing information and making business. It has become a crucial medium for people and companies to connect and present themselves to the world. In this heterogeneous scenario
data is represented in many forms and created by many sources. The large amount of information stored and produced is increasing every day and pushing the limits of storage and processing. Only in 2012 there was a rate of 2.5 quintillion bytes of data (1 followed by 18 zeros) created per day. Social networks, sensor networks, e-commerce and other data producing systems generate massive amounts of bytes per second. All of this information can and should be used for analyzing customer behavior, predicting trend and decision-making.
MapReduce is a programming model presented by Google for processing large amounts of data in a distributed fashion that can be run on commodity resources, thus scaling the processing power to hundreds or thousands of machines. MapReduce is and innovative way of parallelizing processing jobs where every problem has to be adapted into a two-step process: a mapping phase and a reducing phase. The mappers takes an input key/value pair and produce a set of key/value pairs that are passed to the reducing job, which will merge the values into a smaller set. The open source \twin brother" of Google/MapReduce and GFS are the Apache Hadoop1 and Hadoop Distributed File System (HDFS) projects started at Yahoo!. A next level of the MapReduce model are platforms for processing data in streaming where disk I/O operations are reduced for not using less as its source and storage.
ISSN 2348 – 7968
data and the complexity of the data. This works will focus on the volume and use some data mining techniques that use one common clustering algorithm - the k-means.
The scope of real time big data analysis deals with using machine learning algorithms on unbounded streams of data. Data streams can be generated by many different sources such as social networks, sensors, internet traffic, video and many others. To deal with this large volume of possibly unbounded flow of data some distributed stream processing platform has been implemented such as Apache S43 and Twitter Storm 4. These platforms can be considered an evolution of the batch, MapReduce, distributed file system model in the sense that they process owing data instead of always writing and reading from files.
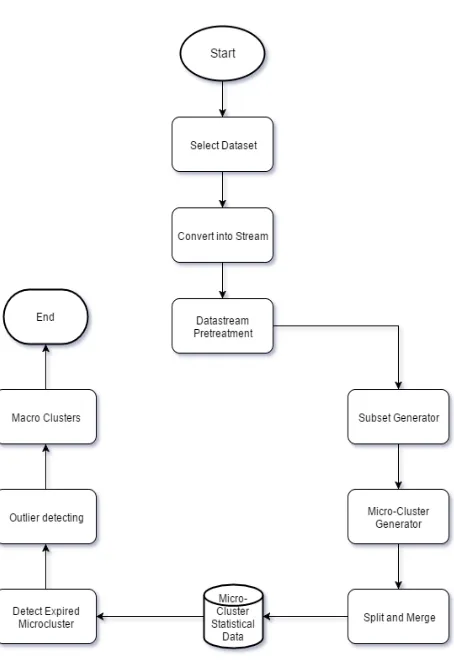
2. Proposed Work Flow
Figure 2.1 Flow Diagram
3. Flowchart Description
The proposed method is to cluster huge datasets using data stream clustering which is based on Divide-AND-Conquer k-Means algorithm. The whole study of research is partitioned into two main components which are online and offline. It is noticeable that the online component strongly affects the offline component. Study use window of data for online processing as the size of the window should be determined by the user and depends on the available memory.
Afterward, data pretreatment in data stream mining system reformat the original data file to prepare data for clustering. It includes feature selection, feature reduction, data cleaning and data transforming. Although these pretreatment tasks are the same for any data stream mining problems, it does not under this study; therefore, we apply general methods in this task whereby feature selection and reduction have been done manually, missing values are ignored and normalizing the data if necessary.
Online component:-
This module contains three Components. 1)Subset Generator, 2) Micro cluster Generation and 3) Split and merge for micro cluster. The k-Means algorithm has been applied for generating micro-clusters.
Offline Component:-
This component is used for further analysis and providing a hierarchical structure for clusters by statistical database that is created by online component. For this, three main tasks have been identified. 1) Macro-cluster generator, 2) Outlier detecting, 3) Novel and expired micro-clusters. The main task is macro-cluster generator which is simply as same as micro-cluster generator in online component. The only difference is macro-clustering process takes place in offline situation. Since the stream clustering process should provide a greater level of importance to recent clusters.
4. Evaluation Criteria for Clustering
ISSN 2348 – 7968
into account the matching against some external structure, whereas the internal only uses its internal attributes for validation. An external structure can be represented by the ground truth, present on synthetic data but not often found on real data. For the purpose of this project the measures chosen was that of cohesion and separation that can both be used as internal and external evaluations by following some conditions.
Figure 4.1 SAMOA Clustering Task topology
The following items describe in details the measures: Cohesion is the measure of how closely related are the items in a cluster. It is measured by the sum of square error (SSE) between each point x in a cluster C and the cluster mean mi.
(4.1)
Separation measures how distant the clusters are from each other. This is achieved by calculating the between-cluster sum of squares (BSS), taking into account the overall clustering mean m. This measure is also directly related to the weight (amount of points) in a cluster Ci.
(4.2)
Highly cohesive clusters might be considered better than less cohesive. With these measures some actions can be taken, such as splitting less cohesive clusters and merging not so separate ones. An interesting property of these measures is that they are complementary and their sum renders a constant. Therefore the measures for a clustering with k = 1 will give a value of BSS equal to zero, therefore the value of SSE will be the constant. Taking this into
account the measures are good candidates for evaluating the SAMOA distributed clustering design. Since the cohesion can only be measured if all the points available, it can only be assessed when the evaluation components are active. On the global phase of the clustering the separation factor (BSS) can be found because the final clustering are weighted clusters. Further on the cohesion (SSE) can be inferred by calculating the difference between the constant and BSS. When the ground truth is available it is possible to find the value of SSE and BSS by using the real clustering centroids.
5. Experiments and Evaluation
The experiments on the SAMOA distributed clustering algorithm were done with the goal of assessing two main criterions: scalability and clustering quality. In order o evaluate the scalability the algorithm will be run with an increasing amount of resources, thus the performance can be analyzed in different environment configurations. The expected behaviour should be an increase in performance while scaling up the system. The clustering quality will be assessed with different dataset configuration, where a noise factor will be added to the data stream. It is known that the k- means clustering algorithm is sensitive to outliers, therefore the clustering algorithm might find poor results in face of increasing noise in the dataset.
1. Test Environment
The experiments will conducted on a cluster of four high memory server. Each server is equipped with a dual-quadcore Intel Xeon processor of type E5620 with clock speed of 2.4MHz and hyperthreading, which provides the processing power of 16 cores, and 48GB of RAM. Synthetic datasets of evolving data streams were used to validate the algorithm. The data set generator takes as input the k amount of clusters, the dimensionality of points, the noise threshold and the speed of cluster movement. The clustering algorithm also takes as input the k amount of final clusters to be found, the amount of intermediary microclusters and the parallelism level. The SAMOA framework will have as input the amount of nodes to be launched.
All experiments will conducted with node parallelism of four, which means that the parallel processes are distributed amongst the available nodes.
ISSN 2348 – 7968
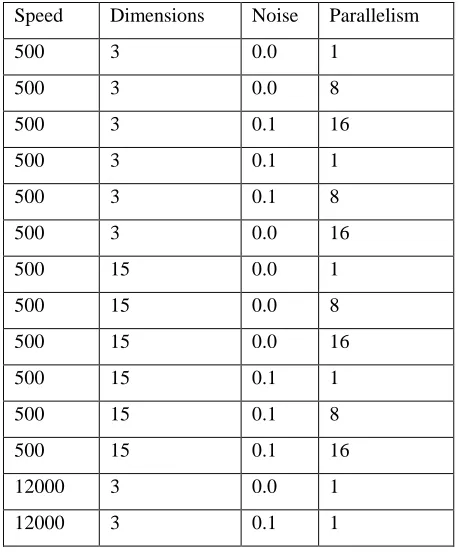
k amount of final clusters to be found, the amount of intermediary micro-clusters and the parallelism level. The SAMOA framework will have as input the amount of nodes to be launched. All experiments were conducted with node parallelism of four, which means that the parallel processes are distributed amongst the available nodes. The parameters used for the experiments are listed in the Table 6.1. A special attention on the experiments with different speeds.
The speed mechanism moves the cluster kernel a predefined distance of 0.1 units every N points. The value of the last experiments was set 12000 so that the clusters would move slower and the cohesion and separation measures could be better visualized. The experiments with speed 500 were evaluated every 5 seconds and the last two were taken every 2 seconds.
The speed does not interfere on the results because the scalability evaluation can be measured separately from the clustering quality. The data set generator creates a stream of random instances and a predefined amount of instances limit can be defined. For the purpose of the experiments the limit used was of 5 million instance, which made the experiments last enough time to gather relevant results
6. Simulation Result
Speed Dimensions Noise Parallelism
500 3 0.0 1
500 3 0.0 8
500 3 0.1 16
500 3 0.1 1
500 3 0.1 8
500 3 0.0 16
500 15 0.0 1
500 15 0.0 8
500 15 0.0 16
500 15 0.1 1
500 15 0.1 8
500 15 0.1 16
12000 3 0.0 1
12000 3 0.1 1
Table 6.1 Simulation Scenario Drop Packet Result
Measuring scalability is essential for evaluating distributed systems and how well a system scales will determine the amount of maximum resources that can be allocated for a task. The Figures 6.1, 6.2 and 6.3 show the results on the scalability level. In order to determine the ground level of SAMOA we tested the algorithm against a well known stream machine learning tool – MOA.
Figure 6.2 Baseline results in comparison with MOA
The next step in the experiments was to measure the overall average throughput over a period of time and increase the parallelism level using instances with dimensions 3 and 15. The results are illustrated in the bar chart on Figure 6.2. The first bars shows values that can relate to the base-line, where the processing of instances with dimensions 3 and 15 renders a throughput of around 10 thousand and 2 thousand respectively. The bars of parallelism level 8 and 16 show an increase in the performance. Increasing the parallelism from 8 to 16 gives almost a 2x performance increase. The maximum average performance is seen with parallelism 16 where the
ISSN 2348 – 7968
SAMOA clustering algorithm reaches 20 thousand instances per second with 3 dimensional instances and 5 thousand for dimension 15.
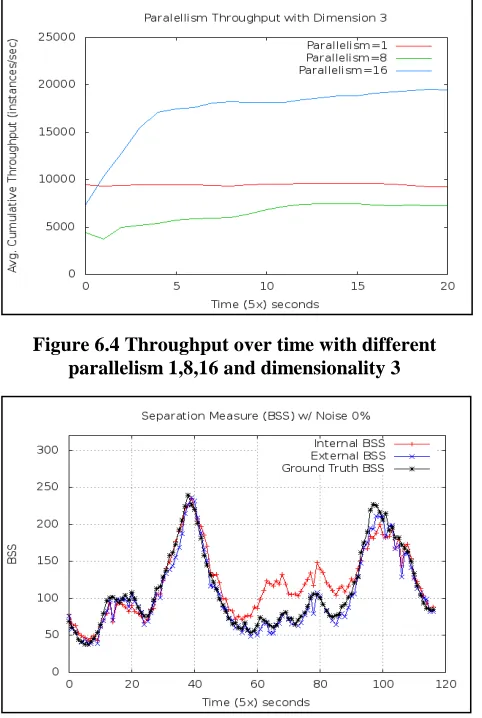
A good way to visualize the performance of the algorithm on a stream model is to see its behavior over time. The line plot on Figure 6.4 shows the average cumulative throughput over time with different parallelism levels for 3 dimensional instances. All three configurations reach a plateau indicating the threshold presented on Figure 6.3. The line representing the parallelism level 8 has a stable performance since the beginning of the execution, whereas the other two have a time span of increasing performance until reaching a stable threshold.
Figure 6.4 Throughput over time with different parallelism 1,8,16 and dimensionality 3
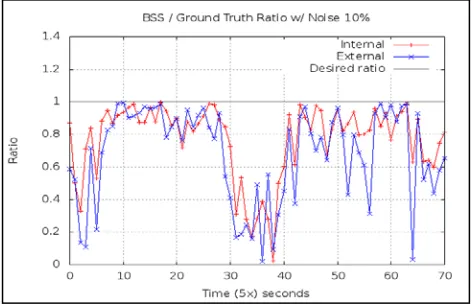
Figure 6.5 BSS separation value over time for clustering generation with noise 0%
Figure 6.5 shows the BSS, which is the between-cluster separation factor for internal, external and ground truth measures. In spite of the confusing overlapping of results, it shows that on a dataset with 0% of noise the SAMOA
clustering can follow relatively well the ground truth. For external measures, where the algorithm uses all the instances received to calculate the BSS it is quite accurate, as can be seen by the overlapping lines. On the other hand, the internal evaluation - where only the weighted micro-clusters are used - deviates from the ground truth from time steps 50 to 90. This behavior can happen once clusters start getting closer to each other.
Figure 6.5 Ratio of external and internal separation with the ground truth BSS on a dataset with 0% noise.
Figure 6.6 BSS separation value over time for clustering generation with noise 10%.
ISSN 2348 – 7968
which reflects the gap present in Figure 6.4 during the same period.
The previous experiment and measures can be viewed as the baseline for clustering quality. In cases where there are gaps is where decision should be taken as in merging clusters that are too close to each other. The next plots show the algorithms behavior under a more “polluted" dataset, where a noise factor of 10% is introduced. Adding noise produces some outliers that can affect the clustering results; outliers are quite common in real datasets. Both plots in Figure 6.6 and 6.7 present the same metrics as in Fig 6.4 and 6.5 respectively, but with an additional noise factor.
Figure 6.7 Ratio of external and internal separation with the ground truth separation on a dataset with 10% noise
By looking at the BSS plot one can see that the internal and external measures take very different paths from the ground truth and from each other, although they follow similar overall wavy movement. In this case the internal evaluation renders a smooth path due to the fact that it uses the weighted centroids as items and is less affected by the noise present, whereas the external is more affected by the presence of outliers arriving. Figure 6.7 shows a relative similar behavior on the ratio values between internal and external measures. The large amount of deep drops on the ratio shows a poor approximation to the ground truth.
7. Conclusions
The SAMOA project is a distributed streaming platform-independent machine learning framework used to develop and test algorithms in large scale infrastructures. SAMOA will be released as an open-source project for the
community to extend experiment and use it to its fullest capacity.
In this paper we have developed the integration of SAMOA to the Apache S4 distributed streaming platform using the SAMOAs adapter layer and tested it by implementing a distributed clustering algorithm based on Aggarwal CluStream algorithm. The SAMOA Clustering was developed using the SAMOA API for creating data flow topologies, which can be deployed on any distributed SPE that can be plugged to SAMOA. Based on the SAMOA API and the concepts of the actors model, the algorithms have to be designed to work asynchronously and have its logic implemented using processing item components. By connecting the processing items to streams a data flow topology can be built to tackle the most diverse problems in distributed stream machine learning.
This flexibility has an advantage over the MapReduce programming model, where problems and algorithms can be designed with any kind processing elements configuration besides mappers and reducers. By conducting experiments we have tested SAMOAs scalability and SAMOAs clustering quality. The results showed that the algorithms perform well in a distributed environment and can scale-up to support higher loads.
References
[1] P. Hunt, M. Konar, F. P. Junqueira, and B. Reed, “Zookeeper: wait free coordination for internet-scale systems," in Proceedings of the 2010 USENIX conference on USENIX annual technical conference, USENIXATC'10, (Berkeley, CA, USA), pp. 11{11, USENIX Association, 2010.
[2] J. Dean and S. Ghemawat, “Mapreduce: simplified data processing on large clusters," Commun. ACM, vol. 51, pp. 107{113, Jan. 2008.
[3] K. Shvachko, H. Kuang, S. Radia, and R. Chansler, “The hadoop distributed system," in Proceedings of the 2010 IEEE 26th Symposium on Mass Storage Systems and T Technologies (MSST), MSST '10, (Washington, DC, USA), pp. 1{10, IEEE Computer Society, 2010.
[4] K. Tretyakov, “Machine learning techniques in spam filtering," tech. rep., Institute of Computer Science, University of Tartu, 2004.
ISSN 2348 – 7968
[6] S. Lloyd, “Least squares quantization in pcm," Information Theory, IEEE Transactions on, vol. 28, no. 2, pp. 129{137, 1982.
[7] E. Forgy, “Cluster analysis of multivariate data: Efficiency versus in terpretability of classification," Biometrics, vol. 21, no. 3, pp. 768{769, 1965.
[8] H. P. Friedman and J. Rubin, \On Some Invariant Criteria for Grouping Data," Journal of The American Statistical Association, vol. 62, pp. 1159{1178, 1967.
[9] J. MacQueen, “Some methods for classification and analysis of multi-variate observations," in Proc. Fifth Berkeley Symp. on Math. Statist. and Prob., vol. 1, pp. 281{297, Univ. of Calif. Press, 1967.
[10] T. Kanungo, D. M. Mount, N. S. Netanyahu, C. D. Piatko, R. Silverman, and A. Y. Wu, “A local search approximation algorithm for k-means clustering," in Proceedings of the eighteenth annual symposium on Computational geometry, SCG '02, (New York, NY, USA), pp. 10{18, ACM, 2002.
[11] D. Arthur and S. Vassilvitskii, “k-means++: The advantages of careful seeding," in Proceedings of the eighteenth annual ACM-SIAM symposium on Discrete algorithms, pp. 1027{1035, 2007.
[12] M. Mahajan, P. Nimbhorkar, and K. Varadarajan, “The planar k- means problem is np-hard," in WALCOM: Algorithms and Computation (S. Das and R. Uehara, eds.), vol. 5431 of Lecture Notes in Computer Science, pp. 274{285, Springer Berlin Heidelberg, 2009.
[13] M. Inaba, N. Katoh, and H. Imai, “Applications of weighted voronoi diagrams and randomization to variance-based k-clustering: (extended abstract)," in Proceedings of the tenth annual symposium on Computational geometry, SCG '94, (New York, NY, USA), pp. 332{339, ACM, 1994.
[14] D. J. Abadi, D. Carney, U. Cetintemel, M. Cherniack, C. Convey, S. Lee, M. Stonebraker, N. Tatbul, and S. Zdonik, “Aurora: a new model and architecture for data stream management," 2003.
[15] S. Chandrasekaran, O. Cooper, A. Deshpande, M. J. Franklin, J. M. Hellerstein, W. Hong, S. Krishnamurthy, S. Madden, V. Raman, F. Reiss, and M. Shah, “Telegraphcq: Continuous dataow processing for an uncertan world," 2003.
ACKNOWLEDGEMENT
Though only my name appears on the cover of this Report, a great many people have contributed to its production. I owe my gratitude to all those people who have made this dissertation possible and because of whom my Dissertation experience has been one that I will cherish forever.
I am extremely grateful to my coordinator Mr. Gardas Naresh Kumar (C-DAC) for being a source of inspiration and for their constant support in the Design and Evaluation of the Dissertation. They have been the constant constructive force throughout my pursuit of Masters Degree at GTU-CDAC and I am sure that their active and passive teachings will always inspire me throughout my life.
I will always remain indebted to my guide at Shankersinh Vaghela Bapu Institute of Technology, Gandhinagar, Honorable to Mr. Nitin Pandya. I am thankful to him for his constant constructive criticism and invaluable suggestions, which benefited me a lot while doing research on Real-Time Clustering for Big Data Streams. He has been always there to support me whenever I felt down or lost my way and always led me on right path.
I also express my gratitude to Mr. Bhadreshsinh Gohil (GTU PG School), for providing me the infrastructure to carry out the Dissertation and to all staff members who were directly and indirectly instrumental in enabling us to stay committed.