IJEDR1602236
International Journal of Engineering Development and Research (www.ijedr.org)2236
Highly Reliable Transmission Line Fault Detection
and Classification Technique Using Hybrid
Wavelet-PCA Feature and KNN Classifier
1
Manish Kurre,
2Shailesh.M.Deshmukh
1PG Scholar, 2Assistant. Professor & Head of Department
Department of Electrical and Electronics Engineering,
1Disha Institute of management and technology, Raipur, India
1[email protected],2[email protected]
________________________________________________________________________________________________________
Abstract - In the present era, the power generation has become a vital part to provide continuous supply of power to the consumers. The efficiency of a power system depends on how a fault is accurately detected and classified, so that quick restoration and maintenance of power is accomplished. Fault detection, fault classification, needs to be performed using a fast and responsive algorithm at different levels of a power system. The significant factors which affect the operation of power line during the occurrence of faults are mainly; fault impedance, fault inception angle (FIA), and fault distance. These factors can be analyzed to detect the occurrence of the disturbance in the power line operation. Various techniques like Fourier transform, short time Fourier transform (STFT) and wavelet transform have been used in past to detect and classify the different faults occurred in the transmission line. However these conventional features based techniques especially wavelet transform based technique provides good fault detection and classification accuracy but highly suffers from the influence of system parameters. The main limitation of the conventional techniques is the selection of system dependent threshold value for the detection and classification of faults. The proper selection of threshold value is a very tedious and time consuming task and also requires brief knowledge of the system configuration. To avoid the drawbacks of conventional fault detection and classification techniques, this paper proposed, an efficient and robust fault detection and classification technique using hybrid wavelet-PCA feature along with efficient K- Nearest Neighbor (KNN) classifier. The advantage of the proposed technique is that; it doesn’t require any threshold selection for the detection and classification of faults. The fault detection and classification accuracy o f proposed technique has been verified using MATLAB/Simulink 2013(a) software. The obtained results shows that the proposed technique is efficient in detection and classification of all type of faults and hence reliable tool for detection and classification of faults occurred in transmission line.
Index Terms - Transmission line, fault detection and classification, wavelet feature, multi-resolution analysis.
________________________________________________________________________________________________________
1.INTRODUCTION
Transmission line is a vital part in power system. Faults in transmission line causes instability and damage to equipment. Therefore, it is necessary to protect the electric power system from faults. For efficient protection, fault should be detected quickly for immediate isolation of faulty line from the system. Subsequently fault classification must be performed for restoration and speed recovery of the system. In order to reduce damage of transmission line due to fault and reliability, high-speed, sensitive protection system is a primary requirement of today’s interconnected power system. According to fault transients, there are number of algorithms have been developed for detection of faults and its classification.
Ben Hessine et al. [19], proposed an approach based on the artificial neural networks (ANN) for the fault detection and classification. This technique is reliable but requires off line training of ANN for detection and classification which is time consuming part. Ferraz et al. [20], presented a new contribution for high impedance fault location for short transmission lines. The basic idea consists in solving an overestimated system using the method of the least square to locate the fault point. To evaluate the proposed approach, high impedance faults are simulated in a 100 km/230 kV transmission line. Yadav and Swetapadma [21], proposed a combined discrete wavelet transform (DWT) and Naive Bayes (NB) fault classifier for protection of double circuit transmission line. This technique provides 99% accurate but threshold dependent. Mahamedi and Zhu [22], proposed a new approach to fault location for double-circuit transmission lines based on only the voltage data of both ends of the faulted circuit. The ratio between the magnitudes of negative-sequence voltages measured at both ends of the faulted circuit is utilized to estimate the fault location. Unlike the iterative methods, this method is fully analytical and does not cause much computing burden to the line relays. The accuracy and practicality of this method make it an attractive function to implement in numerical relays.
IJEDR1602236
International Journal of Engineering Development and Research (www.ijedr.org)1330
transients and is unaffected by the transient magnitude. The proposed algorithm based on both MRA and WSE based fault detection and classification methods are practically feasible and reliable. The only problem related with this technique is that it is highly dependent of threshold selection for detection and classification of line faults.The Wavelet Transform (WT) [18] conducts both time and frequency domain analysis of current signals and transients in voltage waveforms and hence provides a tool for detection and classification of faults. It is usually observed that, the overhead lines are affected by transients, due to the travelling wave phenomenon after the inception of fault. With the analysis of the faults due to induced transients one can gather handy information or features which covers a wide range of aspects like detection and classification of faults. Wavelet based multi-resolution analysis (MRA) has been utilized since a long time for feature extraction of transmission lines to detect and classify various type of faults. This technique is a good tool but makes use of larger feature space along with system dependent threshold selection process.
The proper selection of threshold value is a very tedious and time consuming task and also requires brief knowledge of the system configuration. In the threshold selection process each fault condition along with no fault situation must be analyzed to obtain proper threshold value and this is the strong reason it is vary time consuming process. To avoid these drawbacks of conventional wavelet transform based MRA fault detection and classification techniques, this paper proposed, an efficient and robust fault detection and classification technique using hybrid wavelet-PCA feature along with K-Nearest Neighbor (KNN) classifier. The Principle Component Analysis (PCA) has been integrated over wavelet features to reduce the feature space dimension and KNN classifier is proposed to efficiently classify the PCA features.
In case of signal decomposition using wavelet transform the identification of mother wavelet signifies the preciseness of wavelet analysis. The choice of the appropriate mother wavelet depends on the nature of the signal and on the type of information to be extracted from the signal. In this paper, Wavelet family, dB4 (Daubechies) is used as the mother wavelet. By applying wavelet MRA technique [6], extraction of third level detailed coefficient from the current signal is performed. The existence of a fault is identified based on the detail coefficients followed by PCA reduction and finally the decision has been taken by the KNN classifier about the occurrence of fault and i
2 .DISCRETE WAVELET TRANSFORM
Filter bank theory [1] is the foundation for the development of the discrete wavelet transform (DWT). At level (k), the wavelet transform coefficients of a signal are determined by using a high pass and a low pass filters. The obtained coefficients of low pass filter from the earlier stage are then down sampled by a factor two to reduce the dimension. The high pass filter is obtained from the mother wavelet function and further measures the details coefficients for the input signal. Similarly, the low pass filter delivers a smoothed version of the input signal and is derived from a scaling function, which is associated to the mother wavelet function [2] & [3]. For a function s(t), its continuous wavelet transform (WT) can be calculated from the following equation:
,
1
( )
( )
r m
t - τ
w
t
s t Ψ
dt
m
m
… (1), 0
'
1
(
)
( )
( )
r mC m,τ
s t W
t dt
m
… (2)Fundamentally, in the wavelet decomposition, the wavelet function generates a detail version of the decomposed signal and the scaling function generates the approximated version of the signal that is decomposed. Consequently, Wavelet transform performs a Conversion of scale versus time signal to amplitude versus time signal. A three level wavelet decomposition tree for multi-resolution analysis is shown in figure (1).
IJEDR1602236
International Journal of Engineering Development and Research (www.ijedr.org)1331
3. SIMULATION STUDY OF DIFFERENT FAULT CASE AND RESULTS
As discussed in the previous sections, this work is aimed to develop a robust and reliable fault detection and classification technique particularly to alleviate the drawbacks of conventional wavelet based MRA technique. A three-phase transmission line of rating 400 kv and line length of 300 km has been considered for the simulation studies of various fault cases; their detection and classification. Figure (2) represents the circuit diagram of simulated system in MATLB Simulink 2013(a). The complete system parameters used for the development of Simulink model are given in appendix A.
Figure (2). Schematic circuit diagram of simulated system
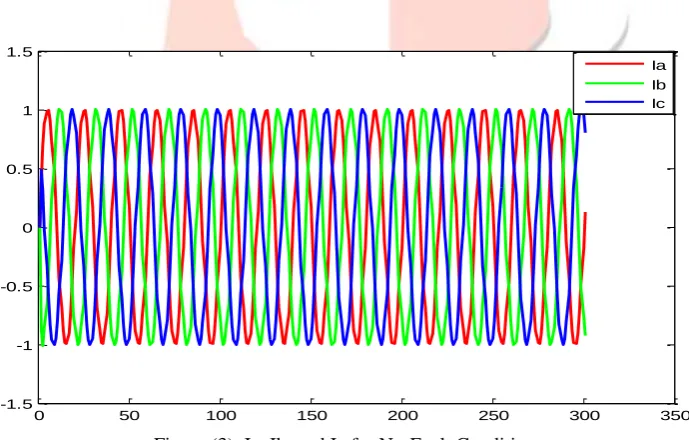
Three phase fault currents obtained at source end for different abnormal conditions along with no fault condition are utilized for the development of feature space. At the starting of feature space creation third level wavelet decomposition has been performed. Sampling time taken for the analysis is 10 ms which relates to sampling frequency of 1 KHz, and the total no of wavelet level consider is three, third level output corresponds to frequency band of 125 – 250 Hz. The detail coefficient of third level wavelet decomposition for the currents in phases A, B and C respectively over different fault inception angle and locations has been extracted. For instance, figure (3) shows the currents in the system under no fault condition. The third level wavelet detail coefficients in this condition for phase A, B and C are plotted in figure (4). Similarly, figure (5) shows the currents of system under phase A to ground fault condition. The third level wavelet detail coefficients in this condition for phase A, B and C are plotted in figure (6).
Figure (3). Ia, Ib, and Ic for No-Fault Condition
0 50 100 150 200 250 300 350
-1.5 -1 -0.5 0 0.5 1 1.5
IJEDR1602236
International Journal of Engineering Development and Research (www.ijedr.org)1332
Figure (4). Detail Coefficients of currents Ia, Ib, and Ic for No-Fault ConditionFigure (5). Ia, Ib, and Ic for AG fault at D= 100 km, FIA = 0°, Rf = 0.001Ὠ
Figure (6). Detail Coefficients of currents Ia, Ib, and Ic for AG fault at D= 100 km, FIA = 0°, Rf = 0.001Ὠ
From the above figures, it is clear that the occurrence of fault in phase A makes variation in the value of detail coefficients of the respective phase only and other two were remains same as in case of no fault condition. To prepare a wavelet based feature we have concatenated all the three obtained detail coefficients in column wise. Although there is a variation on respective phase detail coefficients value but not enough to uniquely represent the condition and also have higher dimension of 47x47.
0 5 10 15 20 25 30 35 40 45
-2 0 2
(a)
Detail coefficients of phase A current
0 5 10 15 20 25 30 35 40 45
-2 0 2
(b)
Detail coefficients of phase B current
0 5 10 15 20 25 30 35 40 45
-2 0
2 Detail coefficients of phase C current
(c)
0 50 100 150 200 250 300
-6 -4 -2 0 2 4 6 8 10
Ia Ib Ic
0 5 10 15 20 25 30 35 40 45
-10 0 10
Detail coefficients of phase A current
(a)
0 5 10 15 20 25 30 35 40 45
-2 0 2
Detail coefficients of phase B current
(b)
0 5 10 15 20 25 30 35 40 45
-2 0 2
Detail coefficients of phase C current
IJEDR1602236
International Journal of Engineering Development and Research (www.ijedr.org)1333
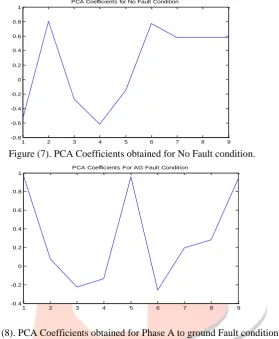
To provide efficient and unique representation of fault and no fault condition to the classifier we have further applied Principle Component Analysis (PCA) to third level detail wavelet coefficients obtained for each phase. Further, a complete feature space has been formed on the basis of PCA feature instead of wavelet feature to uniquely represent each condition of the system. The PCA coefficients obtained for no fault and phase A to ground fault conditions are plotted in figure (7) and figure (8).Figure (7). PCA Coefficients obtained for No Fault condition.
Figure (8). PCA Coefficients obtained for Phase A to ground Fault condition.
From the above figures it is clearly observable that the PCA coefficients uniquely represent both the different fault condition by only using 9 coefficients for each. Now, in the last section of this proposed work we have used K Nearest Neighbour Classifier to efficiently classify the real-time fault condition of the system based on the PCA feature database created for each fault condition including the no fault condition.
A.
K-NN Classifier
Inpattern recognition, theK-Nearest Neighbors algorithm(orK-NNfor short) is anon-parametricmethod used forclassification andregression.In both cases, the input consists of theKclosest training examples in thefeature space.
InK-NN classification, the output is a class membership. An object is classified by a majority vote of its neighbors, with the object being assigned to the class most common among itsknearest neighbors (Kis a positiveinteger, typically small). If K = 1, then the object is simply assigned to the class of that single nearest neighbor. Thek-NN algorithm is among the simplest of allmachine learningalgorithms. Both for classification and regression, it can be useful to weight the contributions of the neighbors, so that the nearer neighbors contribute more to the average than the more distant ones.
Now the complete flow chart representation of the proposed power system protection technique developed in this paper is shown in figure (9).
1 2 3 4 5 6 7 8 9
-0.8 -0.6 -0.4 -0.2 0 0.2 0.4 0.6 0.8 1
PCA Coefficients for No Fault Condition
1 2 3 4 5 6 7 8 9
-0.4 -0.2 0 0.2 0.4 0.6 0.8 1
IJEDR1602236
International Journal of Engineering Development and Research (www.ijedr.org)1334
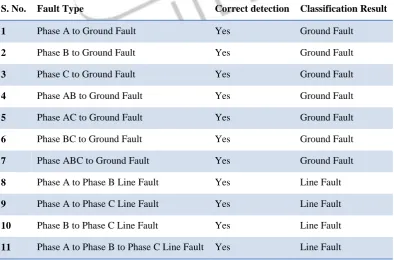
Figure (9). Complete Methodology of the Proposed Power System Protection TechniqueAfter the successful development of the proposed fault detection and classification technique the developed system is tested against various faults on the system and the results of this testing is tabulated in Table-1. The simulation of the proposed fault detection and classification technique has been performed over MATLAB Simulink 2013 (a) software platform.
Table-1 Different fault detection and classification results of proposed technique.
S. No. Fault Type Correct detection Classification Result
1 Phase A to Ground Fault Yes Ground Fault
2 Phase B to Ground Fault Yes Ground Fault
3 Phase C to Ground Fault Yes Ground Fault
4 Phase AB to Ground Fault Yes Ground Fault
5 Phase AC to Ground Fault Yes Ground Fault
6 Phase BC to Ground Fault Yes Ground Fault
7 Phase ABC to Ground Fault Yes Ground Fault
8 Phase A to Phase B Line Fault Yes Line Fault
9 Phase A to Phase C Line Fault Yes Line Fault
10 Phase B to Phase C Line Fault Yes Line Fault
11 Phase A to Phase B to Phase C Line Fault Yes Line Fault Start
Training Phase Testing Phase
Obtain the detail coefficients for each phase currents
Create column wise concatenated matrix of wavelet detail coefficients for each phase
Apply PCA on the concatenated matrix to obtain unique representation of each fault and no fault condition
K-NN Classifier
Analyze the three current components Ia, Ib, and Ic and apply third level wavelet decomposition Apply No fault and all type of fault in the simulation
model one by one.
Create a complete PCA Feature Matrix for classification
Display Fault detection and Classification Result Obtain the detail coefficients for each phase currents
Create column wise concatenated matrix of wavelet detail coefficients for each phase
Apply PCA on the concatenated matrix to obtain unique representation of system condition Analyze the three current components Ia, Ib, and
Ic and apply third level wavelet decomposition Apply No fault and all type of fault in the
IJEDR1602236
International Journal of Engineering Development and Research (www.ijedr.org)1335
Further Table-2 shows the fault detection accuracy analysis of the proposed technique for various types of faults against fault resistance of 0.001 Ω. After the fault has been detected in that line the output value is logic 1 indicates the presence of fault or logic 0 indicates absence of fault.Table-2 Performance of Proposed technique various fault on Fault Resistance 0.001 Ω.
From Table-1 and Table-2 Performance of Proposed technique various fault on Fault Resistance 0.001 Ω., it is clearly observable that the proposed hybrid feature based on KNN classification technique is highly reliable and robust in efficient detection and classification of all types of faults occurred in the transmission line.
4. Conclusions
This paper forwarded a novel fault detection and classification technique for the efficient protection of the 400 kv power system with 300 km length transmission line. The proposed technique was intended to develop efficient feature to uniquely represent each fault condition including no fault condition. To provide efficient feature for each condition a hybrid wavelet-PCA feature has been used. Further an efficient classification technique KNN classifier has been used to accurately classify the system conditions.
The obtained results confirmed the higher protection efficiency of the proposed technique. The proposed technique is efficient and accurately detects and classify all type of faults. Most importantly the mal-functioning or false tripping rate of the proposed technique is zero, while the fault detection and classification efficiency is 100%. In addition to this, the most important advantage of the proposed technique is that, it doesn’t required any threshold selection as required in the conventional wavelet transform based MRA technique.
References
[1] M. Jayabharata Reddy, and D.K. Mohanta, “A wavelet-fuzzy combined approach for classification and location of transmission line faults “,International journal of Electrical Power and Energy system, Volume 29, Issue 9, pp 669-678, November 2007.
[2] Omar AS,” Combined fuzzy-logic wavelet-based fault classification technique for power system relaying”, IEEE Trans. On Power Delivery, Vol.19, No. 2, pp.582-589, July 2004.
[3] Biswarup Das and J.Vittal Reddy, “Fuzzy-Logic-Based Fault classification “, IEEE Trans. On power Delivery, Vol.20, No.2, pp 609-616, April, 2005.
[4] M. M. Tawfik and M. M. Morcos, “ANN-Based Techniques for Estimating Fault Location on Transmission Lines using Prony Method”, IEEE Trans. On Power Delivery, Vol. 16, No. 2, pp. 219-224, April 2001.
[5] Gopalakrishnan, M. Kezunovic, S. M. Mckenna, D. M. Hamai,”Fault Location using the Distributed Parameter Transmission Line Model”, IEEE Trans. On Power Delivery, Vol. 15, pp. 1169-1174, October, 2000.
[6] D. Chanda, N. K. Kishore, A. K. Sinha, “A Wavelet Multi resolution Analysis for Location of Faults on Transmission Lines”, Electrical Power & Energy Systems, Vol. 25, pp.59-69, October, 2003.
[7] H. Osman and O. P. Malik, “Protection of Parallel Transmission Lines using Wavelet Transform”, IEEE Transactions On Power Delivery, Vol. 19, No. 1, pp. 49-55, October, 2004.
For fault resistance case Rf = 0.001 ohm
Fault type
Fault Detection and classification using Proposed Technique
A B C
AG 1 0 0
BG 0 1 0
CG 0 0 1
ABG 1 1 0
BCG 0 1 1
ACG 1 0 1
ABCG 1 1 1
AB 1 1 0
BC 0 1 1
AC 1 0 1
IJEDR1602236
International Journal of Engineering Development and Research (www.ijedr.org)1336
[8] Ferrero A, Sangiovanni S, Zappitelli E, “ A fuzzy-set approach to fault type identification in digital relaying”, IEEETrans. On Power Delivery, Vol. 10, No.1, pp. 169-175, July, 2003.
[9] M. Jaya Bharata Reddy, D. K. Mohanta and B. M. Karan, “Power System Disturbance Recognition using Wavelet and S-Transform Techniques”, International Journal of Emerging Electric Power Systems, Vol. 1, Issue. 2, pp. 1-16, October, 2004.
[10] “Wavelet Toolbox Users Guide” by the Math Works, http//:www.mathworks.com, 2006.
[11]Z. Y. He, X. Q. Chen and G. M. Luo, “Wavelet entropy measure definition and its application for transmission line fault detection and identification (part I: Definition and methodology),” in Proc. IEEE Int. Conf. Power System Technology, Oct. 2006, pp. 1–6.
[12]Zhengyou He, Ling Fu, Sheng Lin, and Zhiqian Bo, “Fault Detection and Classification in EHV Transmission Line Based on Wavelet Singular Entropy”, IEEE Transactions on Power Delivery, Vol.25, No.4, October 2010.
[13]O. A. S. Youssef, “Combined fuzzy-logic wavelet-based fault classification technique for power system relaying,” IEEE Trans. Power Del., vol. 19, no. 2, pp. 582–589, Apr. 2004.
[14]V. C. Klema and A. J. Laub, “The singular value decomposition: Its computation and some applications,” IEEE Trans. Autom. Control, vol. AC- 25, no. 2, pp. 164–176, Apr. 1980.
[15]J. Cadzow, “SVD representation of unitarily invariant matrices,” IEEE Trans. Acoust., Speech Signal Process., vol. 32, no. 3, pp. 512–516, Jun. 1984.
[16]C. E. Shannon, “A mathematical theory of communication,” Bell Syst. Tech. J., vol. 27, pp. 379–423, 623–656, Jul., Oct. 1948.
[17]S. G. Mallat, “A theory for multi-resolution signal decomposition: The wavelet representation,” IEEE Trans. Pattern Anal. Mach. Intell., vol. 11, no. 7, pp. 674–693, Jul. 1989.
[18]Fernando H. Magnago and Ali Abur, “Fault Location Using Wavelets” IEEE Transactions on Power Delivery, Vol. 13, No. 4, October 1998.
[19]K. M. Silva, B. A. Souza, and N. S. D. Brito, ‘‘Fault detection and classification in transmission lines based on wavelet transform and ANN,’’ IEEE Trans. Power Del., vol. 21, no. 4, pp. 2058--2063, Oct. 2006.
APPENDIX -A
Line data of 400-kV, 300 km length.
Line Length = 300 km
1 0.249168 /km
R
1 0.00156277 /km
L H
1 19.469E-9 F/km
C
0 0.60241 /km
R
0 0.004830 /km
L H
0 12.06678E-9 F/km
C
Source impedance
Sending End
17.177 45.5285
1 j
ZS
2.5904 14.7328
0 j
ZS
Receiving End
15.31 45.9245
1 j
ZS
0.7229 15.1288
0 j