https://doi.org/10.5194/nhess-19-181-2019 © Author(s) 2019. This work is distributed under the Creative Commons Attribution 4.0 License.
Laboratory and field tests and distinct element analysis of dry
granular flows and segregation processes
Yung Ming Cheng1,3, Wing Hong Ivan Fung2, Liang Li3, and Na Li1
1Department of Civil and Environmental Engineering, The Hong Kong Polytechnic University, Hong Kong SAR, China 2Department of Architecture and Civil Engineering, City University of Hong Kong, Hong Kong SAR, China
3School of Civil Engineering, Qingdao University of Technology, Qingdao, China
Correspondence:Yung Ming Cheng ([email protected]) Received: 9 February 2018 – Discussion started: 28 February 2018
Revised: 12 December 2018 – Accepted: 17 December 2018 – Published: 22 January 2019
Abstract.Natural as well as fill slopes are commonly found in Hong Kong, China, and many other countries, and slope failures with the subsequent debris flows have caused a seri-ous loss of life and property in the past until now. There are various processes and features associated with debris flow which engineers need to know so as to design for the precau-tionary measures. In this study, experiments on flume tests, friction tests, deposition tests, and rebound tests were carried out for different sizes of balls to determine the parameters required for the modelling of dry granular flow. Different materials and sizes of balls are used in the flume tests, and various flow pattern and segregation phenomena are noticed in the tests. Distinct element modelling (DEM) of dry gran-ular flow is also carried out for the flow process. It is found that for simple cases, the flow process can be modelled rea-sonably well by DEM, which is crucial for engineers to de-termine the pattern and impact of granular flow, which will lead to further study in more complicated debris flow. From laboratory tests, large-scale field tests, and numerical simu-lations of single- and multiple-material tests, it is also found that the particle size will be the most critical factor in the seg-regation process during granular flow. It is also found from the laboratory tests and numerical simulations that a jump in the flume can help to reduce the final velocity of the granular flow, which is useful for practical purposes.
1 Introduction
The terrain of Hong Kong is hilly. Many slopes (fill, cut, and natural) and roads are formed to cope with the rapid develop-ment of Hong Kong, China, and many other developed cities. Hong Kong has a high amount of rainfall, with an annual average of 2300 mm which falls mostly in summer between May and September. The stability of man-made and natural slopes is of major concern to the government and the pub-lic. Landslides and the subsequent debris flows have caused loss of life and significant amounts of property damage in the past. In Hong Kong, for the 50 years after 1947, more than 470 people died due to slope failures and debris flow asso-ciated with man-made cut slopes, fill slopes, and retaining walls.
China. The research works include three-dimensional analy-ses of slope stability, debris flow procesanaly-ses, impact loads on flexible and rigid barriers, and others. An example of a three-dimensional slope stability analysis using 16 000 columns was carried out in 2016–2017, which is shown in Fig. 2a (Lo et al., 2018). The analysis of non-spherical surfaces was achieved by the use of the NURBS function as discussed by Cheng et al. (2005). Upon the determination of the critical failure mass, the flow path of the soil can be estimated from a distinct element analysis using the method discussed by Cheng et al. (2015). The slope failure and the subsequent debris flow (2100 m3of debris) as shown in Fig. 2b are ul-timately controlled by the use of three levels of flexible bar-riers. We also consider using a meshless method in the as-sessment of debris flow, which will be the next stage of the present work (Wong, 2018).
Granular flow, as a pilot study for debris flow, has some fundamental difficulties in the physical tests as well as nu-merical analyses. In general, various particle sizes are present in a flow, and the debris mix is usually far from uniform in composition. For physical tests, it is difficult to apply a rep-resentative debris flow mix, and the flow process is further complicated by the presence of water. For numerical simu-lations, it is virtually impossible to accommodate so many particles in a model when they can range from very small particles to cobbles or even boulders, in the extreme range. Even if such a numerical model can be established, there will be serious numerical problems if the particle sizes differ too much in the system. Granular flow can be induced by gravity, driven by fluid dynamics, or by both factors. The classifica-tion of debris was given by Varnes (1978), and later modified by Furuya (1980), Ohyagi (1985), Pierson and Costa (1987), Coussot and Meunier (1996), Cruden and Varnes (1996), Hungr et al. (2001), Takahashi (2001, 2006), and others. A detailed theoretical treatment of dry granular flow similar to some of the single material tests in the present study was given by Takahashi (2014) and will not be repeated here. In this study, we will concentrate mainly on the force of grav-ity, while the effects of water are under our study as the next stage of research work.
Many scientists have carried out granular flow analyses. Lo (2004) compared different compositions of granular flow in landslides in Hong Kong and examined the coarse and fine particle concentration. Hutter et al. (2005) considered the flow envelops and the deposition of the flow. In year 1991, the US Geological Survey made a large-scale flume for detailed experimental tests on debris flows. Mizuyama and Uehara (1983) made a flume which is 20 cm wide and 25 m long, and the slope angle ranged from 5 to 25◦. Liu (1996) made a 18 cm deep, 16 cm wide, and 150 cm long flume in Yunnan, China, and the flume inclination could be adjusted from 10 to 34◦. Lin et al. (2009) made a 20 cm wide by 8 m long flume with a 2.2 m wide by 3 m long catchment. There are also various flume tests that have been carried out by var-ious researchers in Hong Kong and many other countries.
During the transportation period, segregation occurs when debris starts to flow. Iverson et al. (1997) studied the factors that influence the segregation process. He found that particle size has a great effect on the segregation process, and debris with a larger particle size moves upward while fine particles go downwards. This phenomenon is the opposite of “normal grading”, in which the finer particles are found in the upper layers in the lake or river, and large particles rest at the bot-tom. The main reason for the segregation is kinetic sieving, where finer particles can go through the gaps between parti-cles more easily than the larger particle. Large partiparti-cles can also be found at the front of the flow because of the rela-tively high velocity of the larger particles in the upper layer, compared with the finer particles with lower velocity in the lower layer. When a stable contact network for large particle is formed at the free surface, the segregation ceases to occur and the balls finally deposit at the catchment area.
For distinct element modelling (DEM) of granular flow, Jiang et al. (2003) studied the methods of the generations of balls in PFC2D (Cundall, 1971, 1988; Cundall and Hart, 1992; Cundall and Strack 1979), namely the expansion method and isotropic compression method. Zohdi (2007) and Halsey and Mahta (2002) discussed about the physics of granular flow, the contact model, and the limits of the friction coefficient. Sullivan (2011) also compared the theory and computation in distinct element analysis. It is well known that the use of DEM can only provide qualitative rather than quantitative analysis in studies up to the present (see also the Discussion), so most researchers adopt DEM for qualitative analysis only.
Figure 1.Representative debris flow in Hong Kong and Shenzhen, China(a)Tsing Shan debris flow in 1990 (King, 2013);(b)debris flow in Shenzhen 2015.
Figure 2. Three-dimensional slope stability analysis from Lo et al. (2018) (the triangulation represents the geometry as defined by the geographic information system (GIS) information) and the subsequent debris flow for a slope in Hong Kong that has blocked the Sai Wan Road traffic.
2 Physical flume modelling of granular flow
2.1 Instrumentation and test material
To enhance the knowledge on the granular flow mechanism, many laboratory and large-scale field tests were carried out. The laboratory model is about 1.5 m long and 1.3 m high (ad-justable). The flume in the laboratory is made of polystyrene and is designed to be flexible, and the angle of inclination can be adjusted if necessary. The flume model is 40 cm deep by 40 cm wide by 140 cm long for the upper flume and 100 cm for the lower flume with a 60 cm×60 cm catchment area at the bottom. Figures 3 and 4 show the schematic design of flume and flume model in the laboratory tests. In order to record the motion of the particles, two high-speed cameras are adopted. The first one is mounted on the upper flume while the second one is fixed to the bottom flume. In the
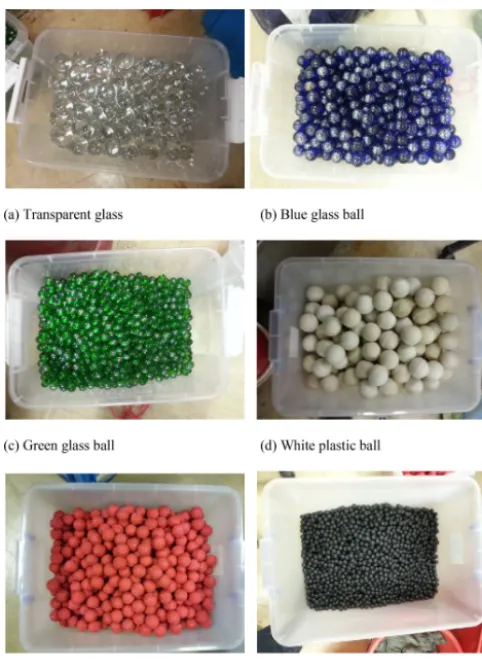
lab-oratory tests, different sizes of glass beads and rubber beads are used to replace the use of sand, and this simplification can help to assess the effects of shape and material on the segregation process. In the large-scale field test, real sand is used. For the material parameters, the dynamic friction angle is measured by using the tilting test (Pudasaini and Hutter, 2007; Mancarella and Hungr, 2010). The properties of the glass and rubber beads are determined experimentally, and the details are given in Table 1.
2.2 Test programme
Table 1.The properties of the glass balls and plastic balls in the laboratory granular flow test.
Plastic D Average Density External friction Internal friction
(mm) weight (kg m−3) coefficient coefficient
White 50 105.35 1609.64 0.781 0.547
Red 30 23.382 1653.97 0.630 0.429
Black 15 2.862 1619.56 0.222 0.365
Glass D Average Density External friction Internal friction
(mm) weight (kg m−3) coefficient coefficient
Transparent 40 78.686 2348.11 0.102 –
Blue 25 21.121 2581.64 0.053 –
Green 16 5.744 2678.28 0.104 –
Figure 3.Schematic design of the flume.
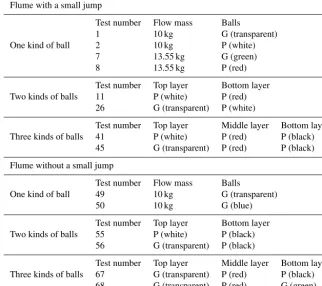
be covered by a separate paper later. A total of 68 labora-tory tests were carried out. The 68 tests are divided into two groups; the first group of tests was conducted on the flume with a small jump, and the second group of tests was car-ried out on the flume without a jump. Such a jump is also commonly adopted in Hong Kong, and this helps to lower the velocity of the granular flow (for small-scale flow). Fig-ure 5 shows the flume in the laboratory with a small jump. The effects of the particle size and the flowing mass are also studied through the use of a combination of balls with differ-ent diameters, and mass. Table 2 shows only some of the test programme. Test 1 to test 48 belong to the first test group with a small flume jump. Test 1 to test 6 were carried out by using six different kinds of balls separately with the same mass of 10 kg. The mass of the balls was then changed to 13.55 kg, and the above tests were repeated again (for tests 7 to 10). In order to study the segregation process for tests 11 to 40, two kinds of balls with different diameters were com-bined, and for the same purpose in tests 40 to 48, three kinds of balls were combined. Test 49 to test 68 belong to the group without a small flume jump. Same as the first group of tests
Figure 4.Flume model in the laboratory.
Figure 5.Flume model with a small jump in the laboratory.
Table 2.Test programme.
Flume with a small jump
One kind of ball
Test number Flow mass Balls
1 10 kg G (transparent)
2 10 kg P (white)
7 13.55 kg G (green)
8 13.55 kg P (red)
Two kinds of balls
Test number Top layer Bottom layer
11 P (white) P (red)
26 G (transparent) P (white)
Three kinds of balls
Test number Top layer Middle layer Bottom layer
41 P (white) P (red) P (black)
45 G (transparent) P (red) P (black)
Flume without a small jump
One kind of ball
Test number Flow mass Balls
49 10 kg G (transparent)
50 10 kg G (blue)
Two kinds of balls
Test number Top layer Bottom layer
55 P (white) P (black)
56 G (transparent) P (black)
Three kinds of balls
Test number Top layer Middle layer Bottom layer
67 G (transparent) P (red) P (black)
68 G (transparent) P (red) G (green)
P refers to plastic balls, G refers to glass beads.
2.3 Test procedure and test results
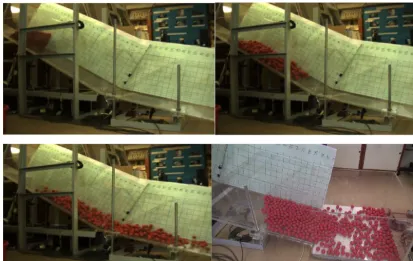
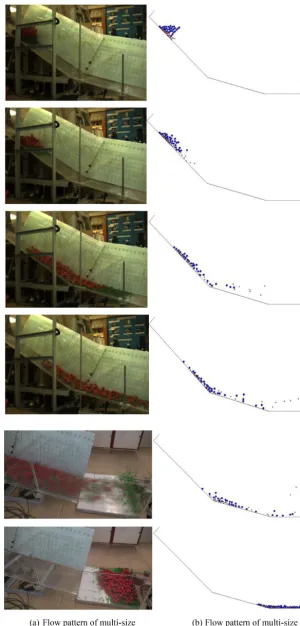
Test materials with different particle size combinations (sin-gle types of balls to multiple types of balls) were put into the container which is on the top of the flume. Figure 7 shows the flow pattern of single-type dry granular material flowing along the flume. The video captured by high-speed camera can show this process clearly. When the gate of the container was pulled up, the front part of the flow mass became loose and started to flow along the upper flume under the force of gravity, while the latter part of flow mass followed be-hind. Flow mass elongated when it moved forward, and the shape of the flow front is wedge-like. At the moment when the particles reached the bottom of the flume, the velocity di-rection of the balls changed because of the angle difference between the upper flume and the lower flume. During the transportation period, a large amount of potential energy of the initial flow mass was transferred to momentum accompa-nied by energy dissipation through the grains’ collision and friction. Particles at the front of the flow reflected back when they impacted on the wall of the deposition zone and collided with the subsequent particles immediately, which consumed the residual momentum of flow particles. Finally, all of the particles rested in the deposition zone.
In reality, there are sediments and water in debris flow. The effect of water is complicated and will not be studied in
the present work. The grain size distribution is usually not uniform as in the present laboratory tests. Consequently, a good understanding of the particle flow under a mixture of ball sizes is important. Particle size is a vital parameter for the good understanding of multi-size particle flow because it not only has an effect on the flow dynamics, but also influ-ences the energy attenuation during the whole flow process. Furthermore, the tilting test that is mentioned above demon-strates that the dynamic friction angle depends on the particle size; specifically, larger particle sizes will have a smaller dy-namic friction angle while smaller particle sizes will have a larger dynamic friction angle. The flow pattern of multi-size particle flow is more complicated when compared with the single-size particle flow.
Figure 6.The plastic and glass balls used in the laboratory tests.
not difficult to find that white plastic balls always stayed at the front of the flow where the velocity was the highest; in other words, the velocities of the white plastic balls with rela-tively larger diameters are higher than the black plastic balls. Besides, at the upper layer where larger white plastic balls are located, the inertial force dominated the flow dynamics and the energy dissipation was less than that of the lower layer where the flow motion is mainly controlled by the contact forces. For the aforementioned reasons, it can be seen that large particle size leads to higher velocity during the flow.
Figure 8b shows the flow pattern of multi-size material composed of green glass balls and black plastic balls. The di-ameter of green glass ball is similar to the didi-ameter of black plastic ball, while the density of green glass balls is almost 2 times larger than black plastic ball. In the upper container, green glass balls were put statically on top of the black plas-tic balls. After pulling up the door, the black plasplas-tic balls flowed out first and stayed in the bottom layer due to the arrangement of the initial position of balls in the container, green glass balls quickly moved downwards under the force of gravity, which led to the green glass balls in the upper layer to be subsequently replaced by black plastic balls. When the black plastic balls form a stable contact network in the
up-per layer of the flow, the position transition or segregation process stopped. In this case, the difference of particle sizes between two kinds of balls is not obvious, and segregation was initiated due to the density difference only. During the segregation process in which green glass balls moved down-wards and black plastic balls migrated updown-wards, the momenta of these two kinds of balls were transferred to each other at neighbouring locations, and therefore green glass balls and black plastic balls arrived at the catchment area almost at the same time. While for the test in which balls were arranged in an opposite order (black plastic balls on top and green glass balls on bottom), the green glass balls moved faster and de-posited earlier at the catchment area compared with the black plastic balls. This was due to the smaller dynamic friction angle as well as the larger kinetic energy of the green glass balls.
Similar to the above two figures, Fig. 7c shows the flow pattern of transparent glass balls and black plastic balls. In this case, both the density and particle size of the transparent glass balls are larger than those of the black plastic balls. As shown in high-speed camera video, during the flow process, the transparent glass balls flowed upwards and moved faster in comparison with the black plastic balls. Hence, although the density of the transparent glass balls is larger than the black plastic balls, the transparent glass balls still stay in the upper layer of the granular flow due to their relatively large particle sizes, which means that particle size has greater con-tribution for the segregation process than density in the anal-ysis of granular flow.
3 Numerical modelling of granular flow 3.1 Model generation
Figure 7.Flow pattern of mono-size particle flow in the physical model.
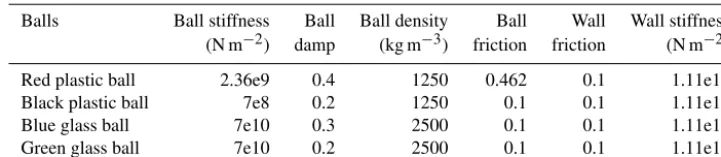
using DEM was adopted to implement the numerical simu-lation of dry granular flow. In total, there are five different methods of model generation in PFC2D program, and based on the consideration of time requirements, the rain method was adopted in the end. The parameters used in the numer-ical simulations are the micro-properties which are difficult to determine. Benchmark tests were carried out in order to calibrate the micro-mechanical properties of the dry granular material. Some of the micro-parameters of the balls are deter-mined through changing their values so that the macroscopic behaviours in numerical simulation are consistent with those in physical tests. The detailed micro-properties of the balls are shown in Table 3. Except for the wall friction (which should be small as the walls are relatively smooth) and wall stiffness, all of the other parameters in Table 3 are determined by laboratory tests. In order to get different frictional coeffi-cients among the balls, two pieces of wood which have plas-tic balls attached to their surfaces regularly and have shear force applied. Furthermore, depositional tests and rebound tests are carried out to measure the frictional angle and re-bound coefficients of the balls. For each parameter, five lab-oratory tests were carried out, and the mean values are pre-sented in Table 3. It should be noted that there is not a wide distribution in the laboratory-determined parameters; hence the range of these parameters is not shown for clarity. The diameters of the particles in the numerical analysis are the same as those used in the physical tests.
3.2 Numerical test results
Table 3.Microscopic parameters of the balls for granular flow analysis.
Balls Ball stiffness Ball Ball density Ball Wall Wall stiffness
(N m−2) damp (kg m−3) friction friction (N m−2)
Red plastic ball 2.36e9 0.4 1250 0.462 0.1 1.11e11
Black plastic ball 7e8 0.2 1250 0.1 0.1 1.11e11
Blue glass ball 7e10 0.3 2500 0.1 0.1 1.11e11
Green glass ball 7e10 0.2 2500 0.1 0.1 1.11e11
Figure 8.Flow pattern of multi-size particle flow.
character of the flow mass where the Savage number is larger than 0.1 (if the Savage number is smaller than 0.1, the flow belongs to frictional flow, Iverson, 1997). The Savage num-ber is the ratio between inertial force and frictional force. The
comparison between Figs. 10 and 9b indicates that the larger the ball size, the more collisional the flow mechanism would be. As a result, the inertial forces dominate the flow dynam-ics compared with the frictional forces in the present tests. Furthermore, the balls in the upper region of the flow asso-ciated with higher velocity had more collisions and moved freely compared with those in the bottom region. The balls in the lower region were compacted with lower flow veloci-ties. By comparison, the numerical simulation results of the flow pattern are in very good agreement with the physical test results when the micro-parameters were selected suitably.
are the largest, which results in the balls with large sizes mi-grating to the front of the flow. The segregation mechanism simulated in the numerical model is consistent with what is mentioned previously in the physical model tests. Ashwood and Hungr (2016), Choi et al. (2014, 2015), Kwan (2012), Lo (2000), and Ng et al. (2014, 2017) have investigated the impact forces on the barrier, which are, however, not consid-ered in the present study, as they are not the main theme of the present work.
3.3 The effect of the flume jump
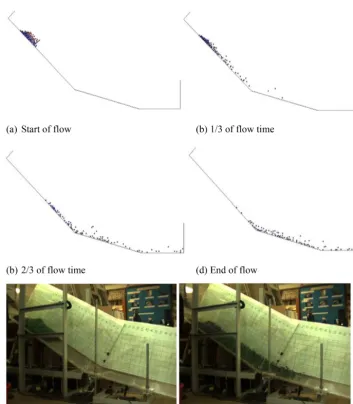
To reduce the impact force and velocity of the granular flow mass, we have proposed to add a jump in the flume as a pilot test in this study. From the results in this study, it is found that the construction of a jump, which has a very low cost, has some small advantage in reducing the impact from de-bris flow. Based on the present results, some rigid barriers in Hong Kong have started to include a jump as a small ben-efit to the control of debris flow, and this is the reason for carrying out such a test in the present research programme which was seldom considered in the past. Figure 11 shows the numerical results of the flow pattern of the blue glass balls flowing on the flume with or without a jump. The flow pattern of the blue glass balls flowing on the flume without a jump in the numerical model is almost the same as the flow pattern of the red plastic balls in the aforementioned physi-cal tests. From the comparison of the flow pattern between Fig. 11a and b, an important phenomenon was observed. The run-up height of the balls flowing on the flume with a jump is obviously lower than the run-up height of the particles flow-ing on the flume without a jump, which indicates that the flume jump is able to facilitate the process of energy attenua-tion and thereby has a good effect on suppressing the run-up height of granular flow.
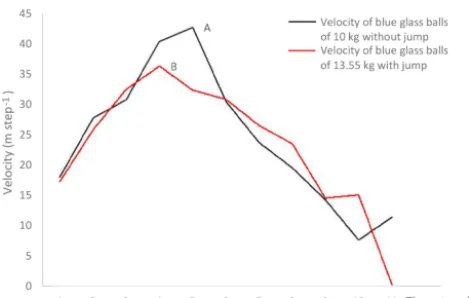
Figure 12 exhibits the velocity of the blue glass balls at dif-ferent time steps. In PFC2D, we developed the code to mon-itor the maximum velocity of the balls for comparison pur-poses, and the monitored results are used to produce Fig. 12. The black line represents the maximum velocity of the blue glass balls of 10 kg weight flowing on the flume without a jump at different time steps, while the red line represents the same kind of balls of 13.55 kg weight on the flume with a jump. The comparison of the velocities at point A and point B indicates that the peak velocity of the balls flowing on the flume with a jump is pronouncedly smaller than that on the flume without a jump, and the peak speeds of the balls on the flume with a jump were achieved earlier than balls on the flume without a jump. It is worth mentioning that the veloc-ity of the balls is independent of the mass of the test material, except at the peak period.
Figure 12.Maximum velocity of blue glass balls in the numerical model.
Figure 13 shows the velocity profile of mono-size par-ticles (blue glass balls) along the flume with or without a flume jump. The length of the velocity vector represents the speed of the particles. From Fig. 13, it can be noticed that the frontal flow velocities are the largest compared with the velocities of the particles at the rear of the flow. When these particles approached the lower part of the flume, the velocity directions changed due to the difference of the flume angles. This is in good agreement with the laboratory results men-tioned above. Figure 13b shows that the velocity of mono-size particles on the flume with a jump increased after the initial state. The largest flow velocity was achieved at the moment when these particles intended to jump into the de-position zone. The directions of flow velocities changed, and the speed of particles decreased as soon as they fell into the deposition zone. As with those particles moving on the flume with a jump, the velocity of the particles flowing along the flume without a jump increased when they approached the deposition zone; however, the velocity of these particles kept increasing when they flowed into the deposition area, and the peak speed was achieved at the moment just before they reached the boundary of the deposition area. When the gran-ular front impacted on the wall of the deposition area, the particles at the front of the flow reflected back and collided with the following particles, and that is the moment when the flow speed decelerated.
According to Figs. 12 and 13, the peak velocity of the balls on the flume with a jump was achieved before they impacted the wall of the deposition zone, contrasting with the balls on the flume without a jump, and this is meaningful to the en-gineers because the flume jump can effectively reduce the impact force on the barrier. Besides, the jump of the flume is capable of reducing the peak velocity of the dry granular par-ticle flow as well. To sum up, flume jumps play a useful role in attenuating granular flow, and therefore flume jumps are recommended to be applied in the design of debris flow bar-riers (which is actually sometimes adopted in Hong Kong).
It should be noted that the actual flow velocity of the balls can be traced back from the high-speed camera photos and the video, but we do not present the results here because it is not the main theme of the present study. Most importantly, DEM usually cannot give a good quantitative prediction un-less the micro-parameters are finely tuned. We do not prefer such tuning of the parameters, as such tuning cannot be per-formed before the tests. However, the qualitative results from the DEM analysis and the laboratory tests are reasonable as found from the present study; hence we can still accept the results from DEM in our discussion. Actually, we have car-ried out limited tuning of the micro-parameters (not shown in this paper) in our internal studies. Since the flow and seg-regation process are practically unaffected by the change of these micro-parameters (but the actual value of the flow ve-locity, run-out, etc. are affected), we have not included these results in the present paper, and we prefer to concentrate on the segregation and jump for a flume test.
4 Large-scale field tests
After the laboratory studies using a 1.5 m long flume and glass and rubber balls, we carried out a large-scale flume test which is shown in Fig. 14. The flume is about 6 m long, and five types of sand, as shown in Fig. 15, are used in the field tests. The particle sizes within each type are relatively uni-form, and they ranged from 1 to 3 (type 1), 3 to 5 (type 2), 5 to 7 (type 3), 7 to 8 (type 4) and above 8 mm (type 5). The friction angles for the five types of sand as determined from the deposition tests as shown in Fig. 15b are given by 28, 30.3, 29.1, 31.5, and 33.7◦respectively.
A series of tests with single, double, and triple types of sand were carried out, and only some of the results are shown in this paper for comparisons with the laboratory tests. As shown in Fig. 16, the final deposition profile using type 1 (1–3 mm) and type 4 (7–8 mm) sands is shown. It is noticed that the coarse-grain sand moves to the top of the flow, which is illustrated by Fig. 17a to c. Such results comply with the laboratory studies well. The control tests using coarse and finer sands are shown in Fig. 18. A closer look into the dif-ference between Figs. 18a and 16 shows that the profile in the rear can reveal an important difference. For granular flow with two types of materials, the difference in the height of the deposit for the first metre as measured from the left is greater than that for the test with a single material (true for all single-sand tests). Such a phenomenon can be attributed to the effect of the difference in the velocity flows between type 1 and 4 materials, with type one material depositing at the bottom during the flow. Based on the field tests, the im-portance of the particle size during the segregation process as derived from the laboratory tests can be further verified.
Figure 13.Velocity profile of blue glass balls in the numerical model.
al. (2012). The surface trajectories of the particles by John-son et al. (2012) are also captured by the high-speed camera in the present laboratory and field tests. A coarse enriched surface layer was obtained by Johnson et al. (2012), and such phenomena are also obtained from the laboratory and field tests and are clearly illustrated in Fig. 17. Iverson (1997) has also found similar segregation from the granular flow in Ore-gon in 1996. It should be noted that for all of the granular flow tests in the present study, such segregation phenomena are always obtained as long as there is more than one material in the problem.
5 Discussion
Figure 14.Large-scale flume for the field test.
Figure 15. (a)Sand used for the granular flow tests.(b)Deposition tests for sand.
internal frictional shear force between real-scale debris flow particles to be relatively large with a lower run-up height. As a consequence, the present tests are a conservative approach to study the flow pattern of granular flow. Such an arrange-ment is necessary to separate the contribution of particle size distribution from other parameters in the segregation process. Physical tests were conducted to study the flow pattern of mono- as well as multiple-size particle flows. In general, the results from the present study comply with those from the lit-erature well. Test results indicate that flow mass is elongated under the action of shear force when the particles flowed on the flume. For particles with different particle sizes, segrega-tion always occurs. Particles with larger diameters migrated upward and small particles moved downwards because parti-cles with smaller diameters can go through the gaps between the larger particles. In addition, the density of the particles is another factor that plays a role in the segregation pro-cess. Under the force of gravity, particles with higher density moved downwards faster, and other particles with lower den-sity were squeezed upwards. For the real scale debris flow, the debris material ranges from clay and silt to boulders,
while the differences in the densities between different types of particles are relatively small; hence, particle size is the most dominant factor which influences the segregation pro-cess. The top view from the high-speed camera indicates that the velocities of the large particles are higher than the ve-locities of the small particles. Granular particles with larger particle sizes travelled to the front of the flow where the ve-locities are higher. Larger particle size is observed to lead to a higher velocity. Such results are also in general agreement with the results by Takahashi (1981).
Figure 16.Final deposition after the granular flow for two types of material (coarse and fine).
as grain movement occurs and controls the flow process for about half of the flow time. The formation of a force chain which actually affects the flow process is also controlled by the grain size distribution. This result has an important im-plication in that most of the natural flow processes involve debris of different grain sizes.
For the flow pattern of dry granular particles simulated through the distinct element method, the simulation re-sults of flow pattern are almost the same as the physical tests. Berger (2016), Chen and Lee (2000), and Ghilardi et al. (2001) also obtained a reasonably good numerical mod-elling of the flow process for the relatively simple flow problem, which supports the use of numerical analysis for the granular flow problem. In the present numerical model, a pronounced segregation process was observed as well, which complies well with many previous studies by Gray et al. (2003), Hákonardóttir et al. (2003), Iverson (1997), John-son et al. (2012), and many others. Large particles went up-wards while small particles went downup-wards. From the ve-locity vector figure, the velocities of the particles in the up-per layer as well as the velocities at the front of the flow were the largest. Savage numbers of the dry granular particles in present tests were larger than 0.1, which represents the col-lisional characteristics of the flow. The flow behaviour was hence more inertial than frictional. Flume jumps have a sig-nificant influence on impeding the granular flow. When the particles flowed through the jump, a large quantity of kinetic energy was consumed during the process. The peak veloci-ties of the particles flowing on the flume with a jump were lower than those without a flume jump. Besides, the peak velocities of the particles on the flume with a jump were
achieved earlier, and after that the flow velocity started to decrease, which make a great contribution for reducing the impact load. The run-up height of the particles on the flume with a jump was apparently lower than that without a jump. Thus, a flume jump can help to reduce the flow velocity as well as suppress the run-up height. In previous sections, de-tailed discussions about the formation of a force chain from DEM are investigated, and such a force chain has a major effect on the flow and segregation processes, which is actu-ally observed from the tests. Without the DEM results, these phenomena cannot be explained clearly. In this respect, the use of numerical modelling has provided an important aid in understanding the flow and segregation processes.
Figure 17. (a)Deposition at the rear of the deposit.(b)Deposition at the front of the deposit.(c)Front view of the deposition (two types of material).
for which the internal forces between the particles cannot be determined.
The flow processes and segregation processes from lab-oratory and field tests are similar in many respects – they are largely controlled by the particle size distribution. This is clearly illustrated from about 50 tests in our study. A limited number of photos are shown in this paper to limit the length of the paper. Thousands of photos and about a hundred video files were obtained from the laboratory and field tests in this study, and only selected photos which are sufficient to illus-trate the main purposes of the present work are shown in the present paper. We are, however, happy to share these materi-als upon request at [email protected].
In the present paper, the effect of the flume inclination has not been investigated. However, we have carried out some other tests on the effects of flume inclination. For the
segre-gation process, the test results indicate that the basic conclu-sions from the present work remains unchanged for practical purposes. Flume inclination has more important effects on the impact forces and erosion, which are to be covered by the next stage of the present research work.
6 Conclusions
Figure 18. (a)Front view of the deposition (type 4 material).(b)Close-up view of the deposition.
Figure 19.Front of the runout.
increase the destructive power of water. For the design of rigid barriers, the use of a suitable water table will also be crucial to maintain an adequate factor of safety of the barrier. Since segregation practically occurs for the majority of the debris flow problems, this effect should be well studied and considered in the design of flexible and rigid barriers.
We chose flexible, spherical rubber beads as well as rigid glass beads for the laboratory, and the range of stiffness was sufficient to cover most of the natural flow materials. The segregation process as found from the laboratory test was actually similar to that in the field tests using non-spherical sand. Through such selection, it is clearly demonstrated that particle size distribution is a very critical factor in the seg-regation process, and it appears that it is more critical than particle shape or stiffness.
To reduce the destructive power of the debris, a small jump in the flow channel is sometimes applied in Hong Kong if
the site conditions allow. In general, the effect of this jump is small, and is effective only for low-volume debris flow, which is the common case for Hong Kong. Nevertheless, such provision can slightly reduce the destructive power of the debris. It is interesting to note that there are virtually no studies about the effect of a jump in the past, and the present study provides some useful pilot work, for which more works may come out in the future.
Nevertheless, the present work will still be useful for many countries where the flow material is mainly granular.
We are currently considering the next stage of field tests, for which the wet test will be carried out (limited tests have been so far), and more equipment and measurements will also be used. Currently, we are constructing a laboratory flume where the base is rough. An investigation of combined effects of base roughness and flume inclination angle will be carried out soon, and hopefully the results will form an ex-tension of the present paper. For the field test, most of the researchers will place a container of a wet sample and let the sample flow down. This approach is simple in execution, but the actual debris flow may not be. From the observations of several debris flows in Hong Kong, we have noticed that erosion processes are sometimes an important phenomenon, which is not simple to reproduce in a field flume. The com-position of the flow material actually changes during the flow process. More thought will be given to the setup of the wet field test in the future, and the base of the flume may be spe-cially prepared with some soil bedding to allow for erosion in the future tests.
Data availability. The materials used in this study, including the pictures and videos, can be accessed upon email request to the au-thors ([email protected], [email protected]).
Author contributions. The authors carried out laboratory and field tests on the segregation process in dry flow and studied the mech-anism of segregation in detail through the test results and distinct element modelling.
Competing interests. The authors declare that they have no conflict of interest.
Acknowledgements. The present project is funded by the Research Grants Council of the Hong Kong SAR Government through the project PolyU 152293/16E, and CityU University of Hong Kong research project no. 7004631, National Natural Science Foundation of China (grant no. 51778313), and Cooperative Innovation Center of Engineering Construction and Safety in Shangdong Blue Economic Zone.
Edited by: Thomas Glade
Reviewed by: two anonymous referees
References
Ashwood, W. and Hungr, O.: Estimating total resisting force in flex-ible barrier impacted by a granular avalanche using physical and numerical modeling, Can. Geotech. J., 53, 1700–1717, 2016. Berger, C.: A comparison of physical and computer-based debris
flow modelling of a deflection structure at Illgraben, Switzerland, Interpraevent, 2016, 212–220, 2016.
Chan, C. P. L.: Runout distance of debris flows: experimental and numerical simulations, Doctoral dissertation, The Hong Kong Polytechnic University, 2001.
Chen, H. and Lee, C. F.: Numerical simulation of debris flow, Can. Geotech. J., 37, 146–160, 2000.
Cheng, Y. M., Liu, H. T., and Au, S. K.: Location of critical three-dimensional non-spherical failure surface with applications to highway slopes, Comput. Geotech., 32, 387–399, 2005. Cheng, Y. M., Li, N., and Yang, X. Q.: Three-dimensional
slope stability problem with a surcharge load, Nat. Hazards Earth Syst. Sci., 15, 2227–2240, https://doi.org/10.5194/nhess-15-2227-2015, 2015.
Choi, C. E., Ng, C. W., Song, D., Kwan, J. H. S., Shiu, H. Y. K., Ho, K. K. S., and Koo, R. C. H.: Flume investigation of landslide debris–resisting baffles, Can. Geotech. J., 51, 540–553, 2014. Choi, C. E., Au-Yeung, S. C. H., Ng, C. W., and Song, D.: Flume
investigation of landslide granular debris and water runup mech-anisms, Geotech. Lett., 5, 28–32, 2015.
Coussot, P. and Meunier, M.: Recognition, classification and me-chanical description of debris flows, Earth-Sci. Rev., 40, 209– 227, 1996.
Cruden, D. M. and Varnes, D. J.: Landslide Types and Processes, Trans. Res. B., 247, 36–75, 1996.
Cundall, P. A.: A computer model for simulating progressive large scale movements in blocky rock systems, in: Proc. Symp. Rock Fracture (ISRM), Nancy, France, 129–136, 1971.
Cundall, P. A.: Formulation of a three-dimensional distinct element model – Part I. A scheme to detect and represent contacts in a system composed of many polyhedral blocks, Int. J. Rock Mech. Min., 25, 107–116, 1988.
Cundall, P. A. and Hart, R. D.: Numerical modelling of discontinua, Eng. Computations, 9, 101–113, 1992.
Cundall, P. A. and Strack, O. D.: A discrete numerical model for granular assemblies, Geotechnique, 29, 47–65, 1979.
Furuya, T.: Landslides and landforms: in: Landslides, slope failures and debris flows, edited by: Takei, A., Kajima Shuppan, Tokyo, 192–230, 1980.
Ghilardi, P., Natale, L., and Savi, F.: Modeling debris flow propaga-tion and deposipropaga-tion, Phys. Chem. Earth, 9, 951–656, 2001. Gray, J. M. N. T., Tai, Y. C., and Noelle, S.: Shock waves, dead
zones and particle-free regions in rapid granular free-surface flows, J. Fluid Mech., 491, 161–181, 2003.
Hákonardóttir, K. M., Hogg, A. J., Batey, J., and Woods,
A. W.: Flying avalanches, Geophys. Res. Lett., 30,
https://doi.org/10.1029/2003GL018172, 2003.
Halsey, T. and Mahta, A.: Challenges in Granular Physics, World Scientific, 2002.
Hutter, K., Wang, Y., and Pudasaini, S. P.: The Savage–Hutter avalanche model: how far can it be pushed?, Philos. T. R. Soc. A, 363, 1507–1528, 2005.
Iverson, R. M.: The physics of debris flows, Rev. Geophys., 35, 245–296, 1997.
Iverson, R. M., Reid, M. E., and LaHusen, R. G.: Debris-flow mobi-lization from landslides 1, Annu. Rev. Earth Pl. Sc., 25, 85–138, 1997.
Jackob, M. and Hungr, O.: Debris flow hazards and related phenom-ena, Springer Praxis, 2005.
Jiang, M., Konrad, J., and Leroueil, S.: An efficient technique for generating homogeneous specimens for DEM studies, Comput. Geotech., 30, 579–597, 2003.
Johnson, C. G., Kokelaar, B. P., Iverson, R. M., Logan, M., LaHusen, R. G., and Gray, J. M. N. T.: Grain-size segregation and levee formation in geophysical mass flows, J. Geophys. Res., 117, F01032, https://doi.org/10.1029/2011JF002185, 2012. King, J. P.: Tsing Shan Debris Flow and Debris Flood, GEO Report
No. 281, Hong Kong SAR Government, 2013.
Kwan, J. S. H.: Supplementary technical guidance on design of rigid debris-resisting barriers, Geotechnical Engineering Office, HK-SAR, GEO Report 270, 2012.
Lin, D. G., Hsu, S. Y., and Chang, K. T.: Numerical simulations of flow motion and deposition characteristics of granular debris flows, Nat. Hazards, 50, 623–650, 2009.
Liu, X.: Size of a debris flow deposition: model experiment ap-proach, Environ. Geol., 28, 70–77, 1996.
Lo, D. O. K.: Review of natural terrain landslide debris resisting barrier design. HKSAR: GEO, Report no. 104, 2000.
Lo, K. H.: Theoretical simulations of debris flow and their applica-tions to hazard mapping using GIS (Doctoral dissertation), The Hong Kong Polytechnic University, 2004.
Lo, O. K., Law, H. C., Wai, C. T., Ng, K. L., Williamson, S. J., Lee, K. S., and Cheng, Y. M.: Investigation of an unusual landslide at Sai Kung Sai Wan Road, Sai Kung, HKIE Transaction Theme issue on landslides and debris flow, 102–114, 2018.
Mancarell, D. and Hungr, O.: Analysis of run-up of granular avalanches against steep, adverse slopes and protective barriers, Can. Geotech. J., 47, 827–841, 2010.
Mizuyama, T. and Uehara, S.: Experimental study of the deposi-tional process of debris flows, Trans. Jpn. Geomorph. Union, 4, 39–64, 1983.
Ng, C. W. W., Choi, C. E., Kwan, J. S. H., Koo, R. C. H., Shiu, H. Y. K., and Ho, K. K. S.: Effects of baffle transverse blockage on landslide debris impedance, Proced. Earth Plan. Sc., 9, 3–13, 2014.
Ng, C. W. W., Choi, C. E., Liu, L. H. D., Wang, Y., Song, D., and Yang, N.: Influence of particle size on the mechanism of dry granular run-up on a rigid barrier, Geotech. Lett., 7, 79–89, 2017. Ohyagi, N.: Definition and classification of sediment hazards: in Prediction and countermeasures of sediment hazards, Japanese Soc. Soil Mech. Foundation Eng., Tokyo, 5–15, 1985.
Pierson, T. C. and Costa, J. E.: A rheologic classification of sub-aerial sediment-water flows: in Debris flows/avalanches: process, recognition, and mitigation, Rev. Eng. Geol., 7, 1–12, 1987. Pudasaini, S. P. and Hutter, K.: Avalanche Dynamics, Dynamics
of Rapid Flows of Dense Granular Avalanches, Springer Verlag, 2007.
Mizuyama, T. and Uehara, S.: Experimental study of the depo-sitional process of debris flows, Japanese Geomorphological Union, 4, 49–63, 1983.
Rickenmann, D.: Empirical relationships for debris flows, Nat. Haz-ards, 19, 47–77, 1999.
Savage, S. B. and Hutter, K.: The motion of a finite mass of granular material down a rough incline, J. Fluid Mech., 199, 177–215, 1989.
Scott, K. M. and Wang, Y. Y.: Debris flow – Geological process and hazard illustrated by a surge sequence at Jiangjia ravine, Yunnan, China, U.S. Geological Survey Professional Paper 1671, 1997. Sullivan, C.: Particulate discrete element modelling, Taylor and
Francis, 2011.
Takahashi, T.: Debris flow, Annu. Rev. Fluid Mech., 13, 57–77, 1981.
Takahashi, T.: Mechanics and simulation of snow avalanches, pyro-clastic flows and debris flows, Spec. Publ. Int., 31, 11–43, 2001. Takahashi, T.: Mechanisms of sediment runoff and countermeasures
for sediment hazards, Kinmirai Sha, 2006.
Takahashi, T.: Debris Flow – Mechanics, Prediction and Counter-measures, 2nd Edn., CRC Press, 2014.
Varnes, D. J.: Slope movement types and processes: in Landslides analysis and control, edited by: Scguster, R. L. and Krizek, R. J., NAS Sp. Rep., 176, 11–33, 1978.
Wong, W. L.: Debris flow analysis by meshless method for Shum Wan Road landslide, degree report, Hong Kong Polytechnic Uni-versity, 2018.