University of South Carolina
Scholar Commons
Theses and Dissertations
Fall 2018
Does Economic Policy Uncertainty Strengthen
Peer Effects on Investments?
Jiawei Wang
Follow this and additional works at:https://scholarcommons.sc.edu/etd
Part of theBusiness Administration, Management, and Operations Commons
This Open Access Thesis is brought to you by Scholar Commons. It has been accepted for inclusion in Theses and Dissertations by an authorized administrator of Scholar Commons. For more information, please [email protected].
Recommended Citation
DOES ECONOMIC POLICY UNCERTAINTY STRENGTHEN PEER EFFECTS ON INVESTMENTS?
by
Jiawei Wang
Bachelor of Economics Shaanxi Normal University, 2014
Master of Science
State University of New York at Buffalo, 2016
Submitted in Partial Fulfillment of the Requirements
For the Degree of Master of Science in
Business Administration
Darla Moore School of Business
University of South Carolina
2018
Accepted by:
Gerald A. McDermott, Director of Thesis
Allen N. Berger, Reader
ABSTRACT
The paper demonstrates that firms are more likely to follow their peers when they
face economic policy uncertainty. Using a newly developed economic policy uncertainty
index and the financial data from COMPUSTAT of US firms, I find evidence that
economic policy uncertainty strengthens peer effects on investments. In this paper, I
propose a reputation-based theory and information-based theory to support the findings.
Peer effects are stronger for less successful firms and financial constrained firms during
periods when economic policy uncertainty is notable. Accordingly, I use four standards
(i.e. firm profitability, financially constrained status, growth rate and market to book ratio)
to define followers and leaders. I document that follower firms respond to leader firms’
investment changes, while leader firms do not respond to follower firms’ investment
changes. Finally, I show that the results are robust to alternative economic policy
uncertainty measures (i.e. close presidential elections) and additional control variables
TABLE OF CONTENTS
Abstract ... iii
List of Tables ...v
Chapter 1: Introduction ...1
Chapter 2: Motivation and Hypotheses...8
Chapter 3: Data and Measures ...14
Chapter 4: Results ...21
Chapter 5: Robustness...35
Chapter 6: Limitations ...43
Chapter 7: Conclusions ...45
LIST OF TABLE
Table 3.1 Summary Statistics ...17
Table 4.1 Main Regression Results ...23
Table 4.2 Components of EPU Index Analyses...26
Table 4.3 Subsample Analyses ...31
Table 4.4 Leaders and Followers ...33
Table 5.1 Instrumental Variable Approaches ...36
Table 5.2 Alternative Measures of Investment ...38
CHAPTER 1
INTRODUCTION
Typically, most research on corporate investments assumes that a firm’s
investment decisions are determined by its investment opportunities, capital structure,
cash flow, and information environment. The role of peer firms’ actions or characteristics
on influencing corporate investment decisions is often ignored. However, there are recent
studies providing evidences that corporate financial policies and investment decisions of
a firm are positively correlated to industries (Bustamante and Fresard, 2017; Leary and
Roberts, 2014). In other words, firms’ financing and investment decisions respond to the
actions and the characteristics of their peer. Graham et al. (2001) survey a significant
number of CFOs and find that they adopt their peer firms’ financing decisions as their
own. Also, Lieberman (2006) shows that environmental uncertainty promotes imitation
behavior between firms, where the mimicking behavior is tacit and complex. The goal of
this paper is to empirically explore the effect of economic policy uncertainty on peer
effects of firms’ investment decisions.
The paper hypothesize that economic policy uncertainty strengthens peer effects
based on two major theories, reputation-based theory and information-based theory.
According to reputation-based theory, how the labor markets value the managers’
management ability is critical for their career. Empirical evidences indicates that top
rather than the industry-wide failures (Scharfstein and Stein, 1990). Moreover, boards
seldom blame the managers because of their unprofitable strategies or firms bad
situations when other firms in the same industries employ the similar strategies or in the
similar situations (Morck Randall, Shleifer Andrei, and Robert, 1989). To avoid negative
reputation in the labor markets, they may not make investment decisions efficiently and
rationally based on the information they possess. Rather, they ignore their private
information and imitate their peers’ investment decisions. When managers face economic
policy uncertainty, it is difficult for them to predict future situation with great confidence.
Therefore, a safer strategy for managers could simply mimic their peers’ investment
decisions, in case that the contrary decisions or behaviors may hurt their reputation in the
managerial labor markets. Finally, it results in herding behavior.
According to the information-based theory, during the periods of economic policy
uncertainty, most of the firms lack information to make rational and efficient investment
decisions, and thus first movers are easily to be considered as possessing valuable or
superior information. In another case, I suppose that first movers make decisions purely
and rationally based on the information they have, and their actions reveal the
information to the followers. After the revealed information accumulates to some extent,
it could be rational for other firms to ignore their own information and mimic their peers’
decisions. Even if firms can analyze the outcomes and make investment decisions based
on their private information, it could be costly and time-consuming, but mimicking others
is simple and costs less. Thus, it is not difficult to imagine why firms are more likely to
A major hurdle of the study is how to appropriately measure economic policy
uncertainty. Previous studies use proxies such as the dispersion in analysts’ forecasts and
volatility in stock returns to measure firm-level uncertainty. However, such measures fail
to capture the overall level of economic policy uncertainty presented in the economy. To
clear the hurdle, I adopt an index recently developed by Baker, Bloom and Davis (2016)
(hereafter BBD). The BBD index is a weighted average of four components. The first
component is constructed based on the count of newspaper articles in 10 leading U.S.
newspapers including at least one of the key policy terms (i.e. white house, federal,
congress, regulation and so on), at least one of the terms (i.e. economic and economy)
and at least one of the terms (i.e. uncertainty and uncertain). This news-based component
is most heavily weighted. The second component measures uncertainty about future
changes of tax code. The third and the fourth component is based on the dispersion in
economic forecasts on CPI and government spending (i.e. purchases by the federal, state
or local government).
I collect firm-level data from COMPUSTAT North America. Using a sample of
505,720 observations and 17,416 unique firms between 1987 and 2016, I show that, peer
effects are reinforced by economic policy uncertainty, implying that firms are more likely
to imitate their peers’ investment decisions when they face economic policy uncertainty
and find it difficult to predict the future. Using level equation and differential equation, I
find similar results that economic policy uncertainty strengthens peer effects. I also run
regression using news and tax-related components of the BBD index. According to
previous literature, among the four components regarding news, tax code, CPI and
the overall index (Gulen and Ion, 2016). Tax-related economic policy uncertainty is also
important to predict firm investments. Empirical evidences show that firm investments
respond to tax changes (Cummins, Hassett and Hubbard, 1996). Therefore, I focus on the
news-related and tax-related components. I find that firms’ peer effects are stronger when
firms face news-related and tax-related economic policy uncertainty.
The paper answers the question, which firms mimic, by splitting the sample by
market to book ratio, sales growth, earning growth and financial constrained status. To
measure financial constraints, I follow Hadlock et al (2010) using the size-age index (SA
index). The SA index is a combination of asset size and firm age and is calculated as
(−0.737* Assets + 0.043*Assets2 − 0.040*Age), where Assets is the natural log of total
book assets and Age is the number of years a firm first appears on COMPUSTAT.
Specifically, a financially more constrained firm has a higher SA index. I calculate the
average SA index for each firm over its time-series. I categorize firms with average SA
indices falling in top (bottom) tertile in each industry as financially constrained
(unconstrained) firms. I also split firms into high or low market to book ratio and earning
(net income) growth using average market to book ratio and earning growth rate over its
time-series and recognize firms falling in top (bottom) tertile in each industry as firms
with high (low) market to book ratio and earning growth.
I sort firms within each industry-quarter into three groups based on their sales
growth. High (low) sale growth firms fall into the top (bottom) third tertile of the
distribution. Empirically, I find that less successful firms (i.e. financially constrained
firms, firms with low market to book ratio, low earning growth and low sales growth) are
uncertainty. The findings are consistent with the information-based theory that more
successful firms are easily considered as possessing superior information. While their less
successful counterparts, who lack such information, are inclined to stay conformity with
the peers to take advantage of the information revealed by firms’ behaviors.
To address the concern that the “peer effects” is a result that firms exhibit similar
investment behavior when they face economic economic policy uncertainty, I use the
sample of leaders and followers to analyze whether follower (leader) firms respond to
investment changes of leader (follower) firms. I follow Leary and Roberts (2014) and
categorize firms into two groups that we call leaders and followers. I define these two
groups by sorting firms within each industry-quarter into four groups based on financially
constrained status, earnings growth, sales growth and market to book ratio. Followers
(leaders) are those firms in the bottom (top) thirds. The results show that follower firms
do respond to leader firms’ investment changes while leader firms do not respond to
follower firms’ investment changes. I do not find significant results for the group sorted
by sales growth.
Next, I attempt to directly address the endogeneity concerns. My identification
attempt relies on a plausibly exogenous variation generated by close presidential
elections. Close presidential elections significantly increase economic policy uncertainty,
as documented by previous literature (Julio and Yook, 2012). Elections isolate the impact
of uncertainty related to national leadership from other confounding factors. Another
advantage of using the data of close presidential elections is that it represents potential
policy changes beyond economic policies. I apply the 2SLS regressions and use close
between economic policy uncertainty and peer firms average investment changes are
positive and significant, which is consistent with the main findings that economic policy
uncertainty strengthen peer effects. I also include another instrumental variable, political
polarization in the House of Representatives. However, using the 2SLS regression
method, I do not find significant results.
The findings continue to hold in a number of robustness checks. First, I use
alternative measures of corporate investments (i.e. capital expenditure scaled by the total
property, plant and equipment of the beginning periods and capital expenditure scaled by
the total assets of the beginning periods). Using the general economic policy uncertainty
index and the news- and tax- related components, the results remain similar with the main
findings. Second, in order to mitigate concerns that omitted factors may explain corporate
investment behaviors, I further include firm-level characteristics (i.e. firm size, measured
by natural logarithm of total assets; firm book leverage, measured by book value of
long-term and short-long-term debt divided by total assets). Again, the main results continue to hold.
The paper contributes to two strands of the literature. First, it extends research on
the effects of economic policy uncertainty on firm level real investment decisions. Gulen
and Ion (2016) document that economic policy uncertainty negatively affects corporate
investments. Julio and Yook (2012) show that during election years, firms reduce capital
expenditure by an average of 4.8% comparing with non-election years. Xu (2011) find
that firms innovation are negatively related to economic policy uncertainty. Second, the
paper contributes to the peer effects literature by adding evidences that economic policy
uncertainty reinforces peer effects on firm investment decisions. Prior research study peer
(Leary and Roberts, 2014), risk management (Ahern et al., 2012; Bursztyn, Ederer,
Ferman, and Yuchtman, 2014; Lahno, Serra-Garcia, Lahno, and Serra-Garcia, 2015),
corporate governance (John and Kadyrzhanova, 2008), corporate social responsibilities
(Cao, 2015) as well as financial policies (Bursztyn, Ederer, Ferman, and Yuchtman,
2014; Bustamante and Fresard, 2017; Chan, Chang, and Chen, 2013; Popadak, 2012). To
the best of my knowledge, this paper is among the first studies to explore peer effects and
economic policy uncertainty.
The rest of the paper proceeds as follows. Section 2 presents the motivation and
hypotheses. Section 3 describes the data and sample. Section 4 reports the main
regression results and subsample analyses. Section 5 presents robustness checks. Section
CHAPTER 2
MOTIVATION AND HYPOTHESES
Peer effects have been studied, theoretically and empirically, across the fields of
economics and finance over a long time: corporate capital structure (Leary and Roberts,
2014), risk management (Ahern et al., 2012; Bursztyn, Ederer, Ferman, and Yuchtman,
2014; Lahno, Serra-Garcia, Lahno, and Serra-Garcia, 2015), corporate governance (John
and Kadyrzhanova, 2008), corporate social responsibilities (Cao, 2015) as well as
financial policies (Bursztyn, Ederer, Ferman, and Yuchtman, 2014; Bustamante and
Fresard, 2017; Chan, Chang, and Chen, 2013; Popadak, 2012).
Leary and Roberts (2014) point out that peer firms have significant influence on
determining corporate capital structure and financial policies. Prior research also study
the performance of peer firms influencing corporate investment decisions (Foucault and
Fresard, 2014). According to Foucault and Fresard (2014), peer firms’ valuation matters
for firms’ investment decisions because peer firms’ valuation conveys important
information to managers to evaluate their future growth opportunities. Pástor and
Veronesi (2012) show that uncertainty makes the correlation of stock returns between
firms increase, which also implies that firms’ behaviors are conform during periods with
high economic policy uncertainty. Arguably, imitation processes are most interesting in
the time characterized by uncertainty or ambiguity. Facing uncertainty, managers find it
difficult to predict outcomes and consequences of a certain behavior or decision. Along
predict (Lieberman, 2006). As a result, I am motivated to study the mechanism of peer
effects and imitation behaviors during economic policy uncertainty periods. There are
two popular theories about imitation behaviors and peer effects, from the prospective of
the reputation of the top managers and the information possessed by peers.
2.1 REPUTATION-BASED THEORY
Classical economic theory suggests that agents make investment decisions based
on the available information they possess; decisions are made rationally and efficiently to
reflect the agents expectations. However, in the real world, managers may not act
rationally based on their own information and beliefs. In modern corporations, managers
are routinely evaluated based on the performance. In many cases, the evaluation depends
not only on the firms’ absolute performance but also the performance relative to the peer
firms. Scharfstein and Stein, (1990) suggests that managers may engage in herding
behavior in investment decisions due to managerial reputation concerns.
Considering a case that a manager has a private signal indicating that a certain
investment decision is wealth-maximizing for a firm. However, the manager also
observes that managers from the peer firms take opposite action. Would the manager be
brave enough to chanllenge the majority? Making decision based on his or her own
private information may achieve a rare success. However, it is also possible that the
decision ends up with a unusual failure. If it turns out that the manager is wrong, it would
be a big fail. Professional managers concern about how others evaluate their ability in the
managerial labor markets. When the evaluation of the firm’s relative performance relates
simply follow others, regardless of his or her private signal. They mimic others’ behavior
because they are afraid of their contrary actions or decisions results in failure and
damaging their reputation, especially during periods with high economic policy
uncertainty.
When facing an unpredictable situation, managers are more likely to value their
reputation in the labor markets. Although mimicking or herding behavior is not efficient
from a rational investor’s point of view, it is reasonable for a professional manager who
cares about his or her own reputation in the labor markets. They would rather fail
conventionally rather than succeed unconventionally (Scharfstein and Stein, 1990).
Morck Randall, Shleifer Andrei, and Robert (1989) suggest that poor performance of a
firm relative to its industry is a very important reason for a top manager’s firing, rather
industry-wide failure. They also suggest that it is difficult for boards to blame the
managers for their bad strategies when other firms in the same industry also adopt the
similar ones. Even though the managers are aware that mimicking others rather than
acting based on their own signals is not the best decision for the whole corporation, he or
she may still follow others, because managers may prefer the option of ‘conventional
success or failure’ rather than ‘unconventional success or failure’. Therefore, the
managers might make a suboptimal but safe decision and mimic other firms regardless of
his or her own private signal, when the evaluation of the managers’ performance
compared with the peer firms.
Thus, it is possible that managers ignore their own private information but mimic
others’ behaviors to avoid negative reputation by their disparate investment decisions. I
uncertainty. Actually, the investment decisions they imitate are not absolutely efficient,
rational and profitable. However, since others can also make mistakes, an unprofitable
investment decision that a manager follows is not too bad for his or her reputation – at
least, the managers can share the blame (Bikhchandani and Sharma, 2000; Scharfstein
and Stein, 1990).
Furthermore, when facing economic policy uncertainty, board members would
lower their expectation on firm performance. They are probably less likely to blame their
managers if other firms are in the similar situation. This benefits the managers and as a
result, imitation occurs. In general, from the reputation prospective, managers have
incentives to follow their peers’ investment decisions. Moreover, economic policy
uncertainty potentially increases the volatility of the returns of the investment, and the
risk of failure of a project. Therefore, high economic policy uncertainty increases the
managerial reputation concerns. In such circumstances, it is safe for managers to stay
conform rather than make decisions isolated with their peers to avoid negative reputation.
2.2 INFORMATION-BASED THEORY
Firms may imitate when their peers are facing similar problems or in the similar
situation and they believe the firms they follow possess superior information (Lieberman,
2006). Especially during the periods of economic policy uncertainty, firms lack
information to predict future, and first movers are easily considered as having valuable
information. In another case, I assume that first, each firm has their private information;
information and the actions or behaviors of the first movers reveal the information they
have to rest of the markets.
On the one hand, while the revealed information accumulates to some extent, it
could be rational and efficient for other firms to imitate their decisions and ignore the
information they possess (Lieberman, 2006). According to the economic agents’ herding
model, herding behavior is a result of rational choice, when there are multiple decision
makers who are making decisions in turns and the private signal each of them received is
incomplete, regarding the true state of the world. The key point of the idea is that an
agent who makes decision later can observe others’ behavior. Although the agent cannot
directly observe the private signal of others, she can still infer from the others’ behavior.
When the signal revealed by the behavior accumulates to a certain degree, the precision
of information revealed by others is sufficiently high. The information the agent gets
from observing others might possibly outweigh her own information. Therefore,
regardless of her private signal, she can simply mimic others’ behavior. (Bikhchandani,
Hirshleifer, and Welch, 1998).
On the other hand, even if they rely on their private information, analyzing the
outcomes is costly and time-consuming. They may finally imitate others’ investment
decisions. In either case, it may not be irrational or inefficient for the firms who observe
the actions or decisions from their peer firms to imitate regardless of their own
information (Bikhchandani, Hirshleifer, and Welch, 1998).
However, when the degree of precision of the private signal is high enough, it is
unlikely that agents simply mimic others’ behavior and ignore her private signal. The
others in order to make the decision of ignoring her private information and mimicking.
While, when economic policy uncertainty increases, the accuracy of the signals decrease
generally. As a consequence, peer effects magnify.
Moreover, the successful firms in the industries are likely to be perceived as
having superior information. For example, less successful firms may follow the
successful rivals if they believe that their successful counterparts are better informed. In
general, in the case of economic policy uncertainty, the imitation strategy is optimal for
firms because it costs less to imitate others’ investment decisions, but outcomes could be
unexpectedly better than making decisions isolating from others.
Along this way, I would expect that firms have stronger incentives to imitate their
peer firms’ investment decisions during periods of economic policy uncertainty, when
they believe that their peer firms have more valuable private information and make
rational and efficient decisions. We would also expect that peer effects are stronger for
follower firms.
Hypothesis 1: Peer effects are strengthened during the periods of economic policy
uncertainty.
Hypothesis 2: Follower firms respond to leader firms’ investment decision. However,
CHAPTER 3
DATA AND MEASURES
3.1 ECONOMIC POLICY UNCERTAINTY
One of the challenges of the research is how to quantitatively measure economic
policy uncertainty. Studies typically rely on ex-post firm-level outcomes (e.g. dispersion
of analyst forecast or volatility of stock returns) to measure ex-ante economic uncertainty.
Unfortunately, such measures cannot capture government economic policy uncertainty.
Julio and Yook (2012) and Durnev (2010) use election data to measure economic policy
uncertainty. While election data captures a portion of economic policy uncertainty during
election years, it cannot capture the economic policy uncertainty in non-election years. In
general, both methods are not good measures of economic uncertainty.
Therefore, in this paper, I employ another measure of economic policy
uncertainty recently developed by Baker, Bloom, and Davis (2016), which captures
government future economic policy uncertainty beyond the election data. The BBD index
has been employed in several finance research works to study the effects of economic
policy uncertainty on corporate financial and investment decisions (Bhattacharya, Hsu,
Tian, and Xu, 2017; Gulen and Ion, 2016; Xu, 2011).
Baker et al. (2016) construct the US economic policy uncertainty index from four
policy related economic uncertainty. Baker et al. (2016) count articles that contain at least
one of the terms of ‘uncertainty’ or ‘uncertain’, and at least one of the terms of ‘economic’
or ‘economy’, as well as at least one of the political terms, for example ‘congress’,
‘deficit’, ‘Federal Reserve’, ‘legislation’, ‘regulation’, or ‘white house’ and so on in 10
leading newspapers in the United States. They scale the raw counts by the total number of
articles in the same newspaper for each month. Afterwards, they average across the ten
newspapers and normalize the 10-paper counts to a mean of 100 since 1985. The second
component captures future tax code changes. It is constructed as the total present dollar
value of the tax provisions set to expire in the near future. The third component measures
fiscal and monetary economic policy uncertainty by estimating the dispersion of forecast
on future purchases by the federal, state or local government. The fourth component is
degree of forecaster disagreement about CPI.
The BBD index is a weighted average of uncertainty related to tax, CPI,
government spending as well as newspaper coverage frequency of discussing economic
economic policy uncertainty. Gulen and Ion (2016) find that, among the four components
of the BBD index, the news-based component has the major explanatory power of the
overall economic policy uncertainty index. Cummins et al. (1996) use 14 OECD
countries’ data and find that tax changes also influence firm investment decisions in 12
out of 14 OECD countries, including the United States. Thus, I adopt the news-based and
the tax-based components of EPU index to examine whether the main results continue to
3.2 SAMPLE AND VARIABLES
The data for the empirical analyses comes from the quarterly COMPUSTAT
North American files. I focus the analysis on a large sample of U.S. publicly listed firms.
We restrict the sample to match the availability of the economic policy uncertainty index
of Baker et al. (2016). The sample extends from 1987 Q1 to 2016 Q4. I require
non-missing data on investment, sales growth, cash flow, Tobin’s Q, book leverage and total
assets. Also I exclude firms distributed to industries of utility, finance and industries that
are considered as “almost nothing”.
To accurately measure peer effects, I exclude firms within the industry-quarters
with less than three observations. Finally, I have 17,416 unique firms. Table 3.1
summarizes statistics for the final sample consisting of 505,720 firm-quarter observations.
To reduce the impact of extreme outliers, I Winsorize all financial variables at the 1%
level on both sides of the sample distribution. In practice, I Winsorize the financial
variables before calculating the peer firms average characteristics in order to mitigate the
influence of the extreme observations.
I define peer effects based on three-digit SIC industry classification codes. Peer firms are
firms in the same industry over the same quarter. The variables are grouped into two
distinct categories, (i.e. firm-specific characteristics and peer firms averages). While the
former includes variables constructed for firm i’s value in quarter t, the latter consists of
variables constructed as the average of all firms’ values within an industry-quarter
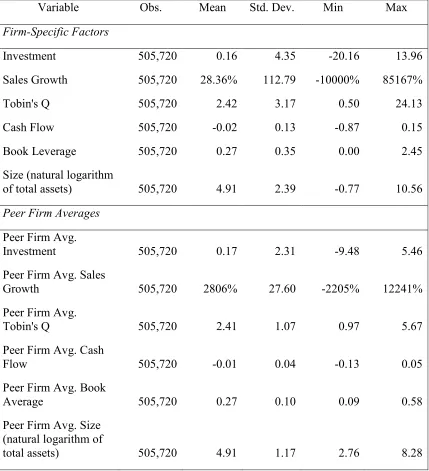
Table 3.1. SUMMARY STATISTICS
Variable Obs. Mean Std. Dev. Min Max
Firm-Specific Factors
Investment 505,720 0.16 4.35 -20.16 13.96
Sales Growth 505,720 28.36% 112.79 -10000% 85167%
Tobin's Q 505,720 2.42 3.17 0.50 24.13
Cash Flow 505,720 -0.02 0.13 -0.87 0.15
Book Leverage 505,720 0.27 0.35 0.00 2.45
Size (natural logarithm
of total assets) 505,720 4.91 2.39 -0.77 10.56
Peer Firm Averages
Peer Firm Avg.
Investment 505,720 0.17 2.31 -9.48 5.46
Peer Firm Avg. Sales
Growth 505,720 2806% 27.60 -2205% 12241%
Peer Firm Avg.
Tobin's Q 505,720 2.41 1.07 0.97 5.67
Peer Firm Avg. Cash
Flow 505,720 -0.01 0.04 -0.13 0.05
Peer Firm Avg. Book
Average 505,720 0.27 0.10 0.09 0.58
Peer Firm Avg. Size (natural logarithm of
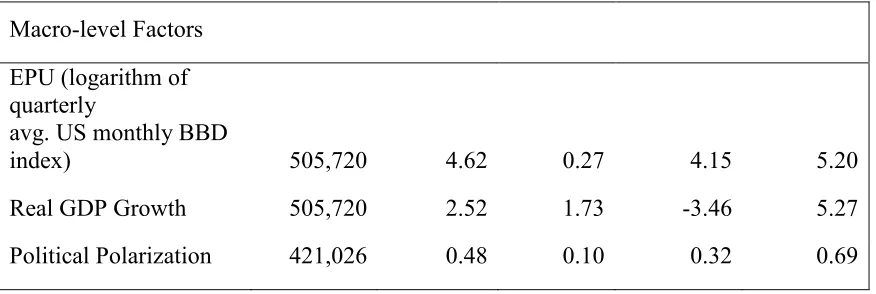
Table 3.1. SUMMARY STATISTICS (CONTINUED)
Macro-level Factors
EPU (logarithm of quarterly
avg. US monthly BBD
index) 505,720 4.62 0.27 4.15 5.20
Real GDP Growth 505,720 2.52 1.73 -3.46 5.27
Political Polarization 421,026 0.48 0.10 0.32 0.69
I define Investment as changes of capital expenditure scaled by total assets of the
beginning period. Cash Flow is measured as income before extra ordinary items plus
depreciation and amortization and deflated by lagged book value of total assets; Sales
Growth, as the year-on-year growth in quarterly sales, is an additional control for
investment opportunities; Tobin’s Q, which also captures investment opportunities, is
measured as market capitalization minus book value of equity and plus total assets and
divided by book value of total assets. I construct quarterly EPU index by aggregating the
monthly BBD index and taking natural logarithm of the 3-month averages of the BBD
index. The EPU index ranges from 4.15 to 5.20, with a mean value of 4.62.
The investment ratio is 16% on average, while the peer firm average investment
ratio is 17%. The average sales growth rate is 28.36%. The average Tobin’s Q is 2.42,
which ranges from 0.5 to 24.31. The mean value of book leverage is 0.27, with ranges
from 0 to 2.45. The variable of size, which is defined as natural logarithm of total assets,
has a mean value of 4.91. In average, I have 128.7 firms for each industry-quarter in the
2.2 EMPIRICAL SPECIFICATION
The main model specification is based on Gulen and Ion,(2016) and Leary and
Roberts (2014). Gulen and Ion (2016) model corporate investment as a function of the
economic policy uncertainty index and other firm-level and country-level characteristics.
Leary and Roberts (2014) model firm outcomes variables as a function of peer firms
outcomes (excluding the firm itself), firm specific characteristics and peer firms’ average
characteristics. Since I am interested in how peer effects influence corporate investment
during the periods of economic policy uncertainty, I include peer firms average
investment, the one period lagged natural logarithm of the quarterly average EPU index,
as well as the interaction term between peer firms average investment and the one period
lagged quarterly EPU index.
Inspired by Leary and Roberts (2014), I use contemporaneous values of peer
firms’ average investment instead of one period lagged peer firms’ average investment
because it limits the amount of time for firms to respond to one another. The
contemporaneous methods make it difficult to identify mimicking behavior among firms.
As the EPU index is a time-varying country-level variable, I also include time fixed
effects. I follow Gulen and Ion (2016) to control corporate investment opportunities over
time by including Sales Growth, Cash Flow, Tobin’s Q, Real GDP Growth and firm
fixed effects. Next, I include peer firms averages (i.e. Sales Growth, Cash Flow, Tobin’s
Q), as in Leary and Roberts (2014), to control the influence of other peer firms financial
, ,
= + + , , × + , ,
+ , , + , , +
where the indices i, j, and t represent firm, industry, and year, respectively. The term
, , denote contemporaneous measures of peer firms’ investments. The
vectors , , and , , denote peer firms’ averages and firms specific characteristics,
respectively. The two vectors , , and , , include control variables known to
correlate with investment decisions.
As specified in the last section, the variables correlated with investment decisions
include Cash Flow, Sales Growth, and Tobin’s Q (Gulen and Ion, 2016). In addition, in
order to account for time-invariant firm heterogeneity, I include firm fixed effects ( ). In
the model, all standard errors are clustered at the firm level. The main hypothesis is that
, the coefficient of the interaction term between peer firms average investment and the
one period lagged EPU index is positive. This implies that firms are more likely to mimic
CHAPTER 4
RESULTS
4.1 MAIN RESULTS
The level specifications use the levels for all of the variables on both the left- and
right-hand sides of the equation. The first difference specifications use first differences
for all of the variables on both the left- and right-hand sides of the equation. The only
exception is the economic policy uncertainty index, which I use its levels across all
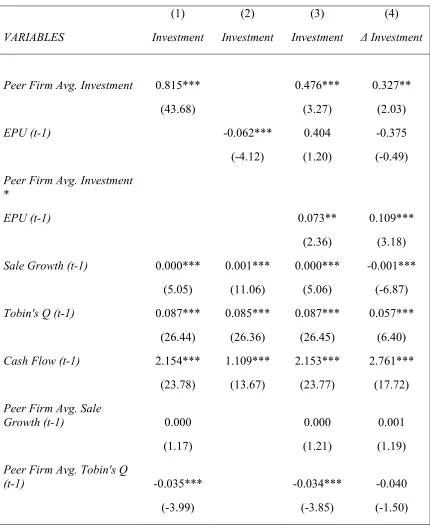
specifications. In Specifications (1) – (3) of Table 4.1, I regress firm investments on peer
firm average investment, one period lagged economic policy uncertainty and the
interaction term of peer firm average investment and one period lagged economic policy
uncertainty while controlling for firm-fixed effects. In Specification (1), I report the
results of peer effects only on firm investment decision. As expected, the coefficient of
peer firm average investment is positive and statistically significant. One unit change in
peer firm average investment associates with 0.815 unit changes in firm investments.
Thus, peer firms have notably impact on firms’ investment decisions.
While Leary and Roberts (2014) document that peer firms play an important role in
determining firm capital structure and financial policies, the preliminary findings are
consistent with their findings. In Specification (2), I test the effects of economic policy
uncertainty on firm investments. Consistent with Gulen and Ion (2016), the results show
investments. One unit increases in economic policy uncertainty index is associated with
0.062 units reduction in firm investments.
The main question is whether peer effects would be strengthened when firms face
economic policy uncertainty. Will the firms be more willing to follow others when they
do not have clear idea about the future policy changes? I test this idea in Specification
(3). The focus is the interaction term of peer firm average investment and the one period
lagged EPU. I find that the coefficient of the interaction term is positive and significant at
5% level, implying that peer effects are reinforced when firm face economic policy
uncertainty. The coefficient of peer firm average investment itself is positive and
significant at 1% level. The coefficient of economic policy uncertainty is positive,
however, it is not significant in this specification.
I run regression using first differences of the left- and right- hand variables but the
level of economic policy uncertainty index. I focus on the interaction term of one period
lagged economic policy uncertainty and peer firm average investment change. The
coefficient of the interaction is positive and significant at 1% level, which is even more
significant compared with the level specification. The coefficient of peer firm average
investment change is positive and statistically significant at 5% level. The findings imply
that firms are inclined to follow their peers when making investment decision and the
peer effects are strengthened when they face economic policy uncertainty. The evidences
are consistent with the findings of Lubo, Astor, and Veronesi (2012) that stock prices are
closely related during government economic policy uncertainty periods, which also
implies that firms tend to mimic their peers to make financial and investment decisions.
Table 4.1 MAIN REGRESSION RESULTS
(1) (2) (3) (4)
VARIABLES Investment Investment Investment Δ Investment
Peer Firm Avg. Investment 0.815*** 0.476*** 0.327**
(43.68) (3.27) (2.03)
EPU (t-1) -0.062*** 0.404 -0.375
(-4.12) (1.20) (-0.49)
Peer Firm Avg. Investment *
EPU (t-1) 0.073** 0.109***
(2.36) (3.18)
Sale Growth (t-1) 0.000*** 0.001*** 0.000*** -0.001***
(5.05) (11.06) (5.06) (-6.87)
Tobin's Q (t-1) 0.087*** 0.085*** 0.087*** 0.057***
(26.44) (26.36) (26.45) (6.40)
Cash Flow (t-1) 2.154*** 1.109*** 2.153*** 2.761***
(23.78) (13.67) (23.77) (17.72)
Peer Firm Avg. Sale
Growth (t-1) 0.000 0.000 0.001
(1.17) (1.21) (1.19)
Peer Firm Avg. Tobin's Q
(t-1) -0.035*** -0.034*** -0.040
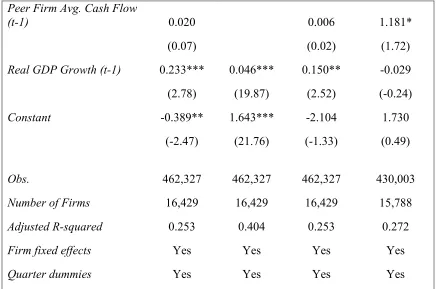
Table 4.1 MAIN REGRESSION RESULTS (CONTINUED)
Peer Firm Avg. Cash Flow
(t-1) 0.020 0.006 1.181*
(0.07) (0.02) (1.72)
Real GDP Growth (t-1) 0.233*** 0.046*** 0.150** -0.029
(2.78) (19.87) (2.52) (-0.24)
Constant -0.389** 1.643*** -2.104 1.730
(-2.47) (21.76) (-1.33) (0.49)
Obs. 462,327 462,327 462,327 430,003
Number of Firms 16,429 16,429 16,429 15,788
Adjusted R-squared 0.253 0.404 0.253 0.272
Firm fixed effects Yes Yes Yes Yes
Quarter dummies Yes Yes Yes Yes
Statistical significant at the 5% and 1% levels is denoted by ** and ***, respectively.
4.2 COMPONENTS OF THE EPU INDEX ANALYSES
Baker, Bloom and Davis (2016) base on newspaper coverage frequency to
develop the BBD index. Therefore, the news component is in principle designed to
capture economy economic policy uncertainty. Gulen and Ion (2016) find that the news
component provides majority of the explanatory power of overall BBD index. Among the
four components, news, tax, CPI, federal, state and local, tax related economic policy
uncertainty is also important to predict firm investment decisions. Cummins, Hassett and
Hubbard (1996) document evidences that firm investment respond to tax change in 12 out
components of the BBD index, news related and tax related components, for the analyses
in this section.
I firstly use levels for all variables on both left- and right-hand sides of the
equation in Specification (1) and (2) of Table 4.2. In the first column, I report regression
results using the news based EPU index as the explanatory variable while controlling for
firm specific characteristics and peer firm averages. The coefficient of the interaction
term of the one period lagged news based EPU index and peer firm average investment is
positive and statistically significant at 1% level. The peer firm average investment also
has a positive and statistically significant coefficient.
The results are consistent with the finding documented in the last section that peer
effects are strengthened when firms face economic policy uncertainty. In Specification
(2), I report regression results using tax-related economic policy uncertainty index as the
explanatory variable instead of the general EPU index. The coefficient of one period
lagged tax-related economic policy uncertainty index is negative and significant at 5%
level, implying that tax-related economic policy uncertainty have negative influence on
firm investment. The coefficient of peer firm average investment is positive and
significant at 1% level, which means that peer firms investment is a strong explanatory
variable for firm investment decisions.
I focus on the interaction term of one period lagged tax-related economic policy
uncertainty index and peer firm average investment to verify whether peer effects will be
reinforced when firm face tax-related economic policy uncertainty. I find the coefficient
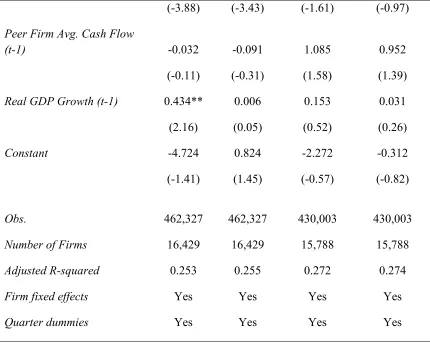
Table 4.2 COMPUNENTS OF EPU INDEX ANALYSES
EPU Components News Tax News Tax
VARIABLES Investment Investment ΔInvestment Δ Investment
Peer Firm Avg. Investment 0.339*** 0.590*** 0.230* 0.594***
(3.00) (17.23) (1.87) (16.00)
EPU (t-1) 0.834 -0.195** 0.462 0.067
(1.32) (-2.08) (0.56) (0.78)
Peer Firm Avg. Investment *
EPU (t-1) 0.102*** 0.053*** 0.129*** 0.057***
(4.25) (7.75) (4.96) (7.76)
Sale Growth (t-1) 0.000*** 0.000*** -0.001*** -0.001***
(5.06) (5.03) (-6.90) (-6.83)
Tobin's Q (t-1) 0.087*** 0.088*** 0.057*** 0.057***
(26.44) (26.49) (6.39) (6.46)
Cash Flow (t-1) 2.151*** 2.145*** 2.757*** 2.753***
(23.75) (23.68) (17.69) (17.64)
Peer Firm Avg. Sale Growth
(t-1) 0.000 0.000 0.001 0.001
(1.18) (0.65) (0.95) (1.59)
Peer Firm Avg. Tobin's Q
Table 4.2 COMPUNENTS OF EPU INDEX ANALYSES (CONTINUED)
(-3.88) (-3.43) (-1.61) (-0.97)
Peer Firm Avg. Cash Flow
(t-1) -0.032 -0.091 1.085 0.952
(-0.11) (-0.31) (1.58) (1.39)
Real GDP Growth (t-1) 0.434** 0.006 0.153 0.031
(2.16) (0.05) (0.52) (0.26)
Constant -4.724 0.824 -2.272 -0.312
(-1.41) (1.45) (-0.57) (-0.82)
Obs. 462,327 462,327 430,003 430,003
Number of Firms 16,429 16,429 15,788 15,788
Adjusted R-squared 0.253 0.255 0.272 0.274
Firm fixed effects Yes Yes Yes Yes
Quarter dummies Yes Yes Yes Yes
Thus, I conclude that firms respond positively to peer firm average investment
when facing tax-related economic policy uncertainty. In Specification (3) and (4), I report
regression results using first differences for all of the variables on both left- and
right-hand of the equation except the indexes of news-related and tax-related economic policy
uncertainty. The first difference regression results are very similar with the level
Using both the news-related and tax-related EPU index, I find that the coefficients
of the interaction term of the one period lagged tax-related and news-based EPU index
and peer firm average investment change are positive and significant at 1% level. Thus,
the findings are also robust using the change of firms’ investment as dependent variables.
In general, I conclude that firms are more likely to follow their peers when making
investment decision when they face economic policy uncertainty.
4.3 SUBSAMPLE ANALYSIS: WHICH FIRMS MIMIC?
Patel, Zeckhauser and Hendricks (1991) suggest that facing uncertainty,
combined with natural inclination of individuals to free ride on others’ information, may
lead to herd behavior in making corporate financial policies and decisions. Cvii and
Banerjee (1992) show that when people find that to obtain their own information is noisy,
costly and time consuming, it is more likely for firms to rely on others’ information when
making their owns. As shown by Leary and Roberts (2014), smaller, less profitable firms
with low earnings growth are more sensitive to financial decisions made by their more
successful counterparts.
To examine heterogeneity in the coefficient on the interaction term of peer firms
average investment and economic policy uncertainty, I split the sample according to
market to book ratio, financial constrains, earnings growth and sales growth. I expect
peer effects during economic policy uncertainty period would be stronger for financially
constrained firms, whose financial policies and particularly, investment decisions are
more sensitive to market conditions than those of financially unconstrained firms.
and low earnings growth will be more likely to follow their more successful peers when
facing economic policy uncertainty.
I measure financial constraints using the size-age index (the SA index), which is
developed by Hadlock et al (2010). The SA index is a combination of asset size and firm
age, which is calculated as (−0.737* Assets + 0.043*Assets2 − 0.040*Age), where Assets
is the natural log of total book assets and Age is the number of years a firm first appears
on COMPUSTAT. Specifically, financially more constrained firms have higher SA index.
I calculate the average SA index for each firm over its time-series and classify firms as
financially constrained or financially unconstrained. I categorize firms with average SA
index falling in top (bottom) tertile in each industry as financially constrained
(unconstrained).
Empirical evidence shows that firm size is related to a firm’s productivity,
survival and profitability. Moreover, large firms can finance from the internal resources,
debt or equity issuance. However, small firms have limited internal resources and limited
capability to issue debt or equity. Additionally, Audretsch and Elston (2002) point out
that small and young firms are more likely to experience credit rationing. Potential
lenders may lack information on managerial capabilities and investment opportunities of
such small and young firms. The potential lenders are unlikely to be able to identify the
risks of the firms. This kind of information asymmetry leads the potential lenders to
increase the interest rates or limit the amount of money they are willing to lend at any
I split firms according to average book to market ratio and earnings growth over
its time-series and recognize firms falling in top (bottom) tertile in each industry as firms
with high (low) market to book ratio and earnings growth. I sort firms within each
industry-year into three groups based on their sales growth. High sales growth firms fall
into the top third and low sales growth firms fall into the bottom third of the distribution.
Specifically, I interact peer firm average investment and economic policy uncertainty
index with indicator variables identifying the lower and upper thirds of each interaction
variables’ distribution. For binary variables, the interaction is directly with the binary
variable. Moreover, to avoid redundancy, I focus on both investment and the changes of
investment as the outcome variable of interest.
Table 4.3 presents the results. In the column (1) and (2), I report the results of
subsample based on market to book ratio. I focus on the interaction term of peer firm
average investment, economic policy uncertainty and binary indicator variable of firms
recognized with low market to book ratio. The results show that using level and first
difference models, the coefficients of the interaction terms are positive and statistically
significant at 5% level, which means that peer effects during economic policy uncertainty
periods are stronger for firms with low market to book ratio. As a result, less valued firms
are more likely to follow their peer firms when facing economic economic policy
uncertainty. Columns (3) and (4) show the results for the earnings growth subsample.
I find that firms with low earnings growth are more sensitive to their peers’
investment decisions when facing economic policy uncertainty. The results of subsample
based on sales growth are tested in Specification (5) and (6). In the model using levels of
Table 4.3 SUBSAMPLE ANALYSES
Market to Book Ratio Earnings Growth Sales Growth Financially Constrained
Investment
Δ
Investment Investment
Δ
Investment Investment
Δ
Investment Investment
Δ Investment
Peer firm avg. investment*EPU
(t-1)*group indicator 0.112** 0.122** 0.169*** 0.172*** 0.107*** 0.082* 0.091 0.124
(2.42) (2.42) (3.47) (3.19) (3.02) (1.74) (0.94) (1.22)
Peer firm avg.
characteristics Yes Yes Yes Yes Yes Yes Yes Yes
Firm-Specific
Factors Yes Yes Yes Yes Yes Yes Yes Yes
Real GDP Growth Yes Yes Yes Yes Yes Yes Yes Yes
Obs. 462,327 430,003 462,327 430,003 462,327 430,003 455,150 423,638
Firm Fixed Effects Yes Yes Yes Yes Yes Yes Yes Yes
Quarter Dummies Yes Yes Yes Yes Yes Yes Yes Yes
3
economically significant, at 1% level. While, for the first difference model, the
coefficient of the interaction term of peer firm average investment and economic policy
uncertainty with binary indicator variable is positive, however, not statistically significant.
I do not find significant results for the subsample based on financial constraints.
4.4 ROBUSTNESS CHECKS
In the last section, I conclude that firms with low market to book ratio, low
earnings growth and sales growth, are more likely to mimic their counterparts investment
decisions when facing economic policy uncertainty. In this section, I perform robustness
checks for the findings. I categorize firms falling in top (bottom) tertile regarding their
market to book ratio, sales growth, earnings growth and SA index as leader (follower)
firms. I then calculate the leader and follower firms average investment changes. I
perform robustness checks by regressing leader firms’ investment changes on the
follower firms and also follower firm average investment changes on their leaders. I first
focus on the follower firms’ average investment changes interacting with the EPU index.
I present the regression results in panel A of Table 4.4. It shows that, except the
subsample of sale growth, the coefficients of interaction terms of leader firms’
investment changes and the EPU index are positive and statistically significant for the
subsamples of financial constraints, earnings growth and market to book ratio. The results
imply that follower firms do respond to their leaders investment decisions when they face
economic policy uncertainty, which also indicate that peer effects are stronger for
Table 4.4 LEADERS AND FOLLOWERS
Change in Firm Investment
Sales Growth Financial Constraints Earnings Growth Market to Book
Panel A: Do Follower Firms Respond to Leaders?
Leader Firms Avg.
Investment Change*EPU (t-1) 0.229* 0.324*** 0.306*** 0.219***
(1.79) (2.60) (5.76) (4.77)
Firm Specific Characteristics Yes Yes Yes Yes
Peer Firms Avg. Characteristics Yes Yes Yes Yes
Real GDP Growth Yes Yes Yes Yes
Obs. 207,913 30,477 121,553 119,087
Adjusted R-squared 0.245 0.135 0.215 0.201
Firm Fixed Effects Yes Yes Yes Yes
Quarter Dummies Yes Yes Yes Yes
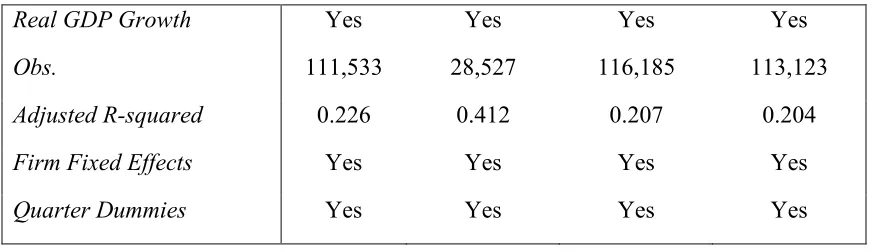
Panel B: Do Leader Firms Respond to Followers?
Follower Firms Avg. Investment Change*
EPU (t-1) 0.057 0.059 0.062 0.054
(0.83) (0.89) (1.13) (0.92)
Firm Specific Characteristics Yes Yes Yes Yes
Table 4.4 LEADERS AND FOLLOWERS (CONTINUED)
Real GDP Growth Yes Yes Yes Yes
Obs. 111,533 28,527 116,185 113,123
Adjusted R-squared 0.226 0.412 0.207 0.204
Firm Fixed Effects Yes Yes Yes Yes
CHAPTER 5
ROBUSTNESS
5.1 ALTERNATIVE POLICY UNCERTAINTY MEASURES
The strategy to alleviate the endogeneity problem is the instrumental variable
approach. The election uncertainty reflects political uncertainty and potential changes in
government leaderships or government policies (Julio and Yook, 2012). Election can
isolate uncertainty related to government leadership from other factors. I follow Julio and
Yook (2012) to choose close presidential elections as one of the plausible exogenous
shock to government policies. There are two close presidential elections, the 2000 and
2004 presidential elections, during the sample period.
I run a baseline regression using the EPU index and replace it with the close
election dummy, which equals one if there is a close presidential election in year t and
zero otherwise. The regression results are reported in Table 5.1. The coefficients of the
interaction term of the one period lagged EPU index and peer firms average investment
(changes) are positive and economically significant at 5% level, which are consistent with
the previous findings that peer effects are reinforced during high economic policy
uncertainty periods. The results are robust to the instrumental variable.
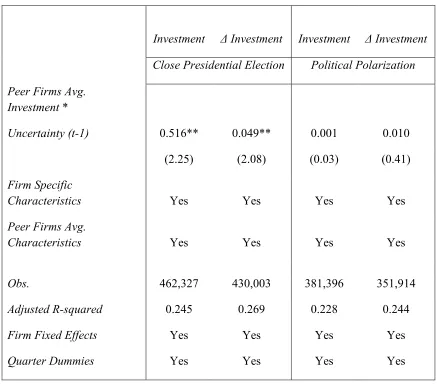
I use the political polarization in the House of Representatives as an instrumental
Table 5.1 INSTRUMENTAL VARIABLE APPROACHES
Investment Δ Investment Investment Δ Investment
Close Presidential Election Political Polarization
Peer Firms Avg. Investment *
Uncertainty (t-1) 0.516** 0.049** 0.001 0.010
(2.25) (2.08) (0.03) (0.41)
Firm Specific
Characteristics Yes Yes Yes Yes
Peer Firms Avg.
Characteristics Yes Yes Yes Yes
Obs. 462,327 430,003 381,396 351,914
Adjusted R-squared 0.245 0.269 0.228 0.244
Firm Fixed Effects Yes Yes Yes Yes
Quarter Dummies Yes Yes Yes Yes
Steven J. Davis (2014) point out that political polarization increase economic economic
policy uncertainty in the United States. It is possible that when the political parties in the
Congress are more polarized, the political parties find it more difficult to reach an
agreement. Therefore, the political polarization is likely to satisfy the relevance criterion
as an instrumental variable for economic policy uncertainty. However, it is not obvious
that political polarization could influence corporate investments through a channel other
restriction as an instrumental variable.
I construct the measure of political polarization using the U.S. House roll-call
vote data obtained from the Political Institutions and Public Choice House Roll-Call
Database. I focus on bill and joint resolution, since those two types of legislations may
affect laws or constitutions. I follow Xu (2011) to measure political polarization as an
average disagreement on bills or joint resolutions in the House. Political polarization is
defined as ∑() 1 − |#$%&,'% − +%,&,'%|, where #$%&,'% .+%,&,'%/ is the percentage of
#$% (+%,) votes among all votes for bill n in year t. N is the total number of bills or joint
resolution in year t. I focus on bills regarding economy, taxes, and budget, defense,
foreign policies and energy and environment issues as well as appropriation bills. A
higher value of the variable indicates a higher degree of polarization. I estimate the
baseline models and use the measure of political polarization as the instrumental variable
for economic policy uncertainty. The regression results are not economically significant.
However, the sign of the coefficients of the interaction term of peer firms average
investment and economic policy uncertainty in both level and first difference models
remains positive.
5.2 ALTERNATIVE MEASURES OF INVESTMENT
Table 5.2 presents the regression results using alternative measures of corporate
investments. Following Bustamante and Fresard (2017) and Leary and Roberts (2014), I
define investment as capital expenditure scaled by total property, plant and equipment of
Table 5.2 ALTERNATIVE MEASURES OF INVESTMENT
General News Tax General News Tax
VARIABLES
Δ Investment
CAPX/PPE(t-1))
Δ Investment
CAPX/Total Assets (t-1)
Peer Firm Avg. Investment*EPU
(t-1) 0.080** 0.144*** 0.019*** 0.164*** 0.178*** 0.064***
(2.48) (5.46) (3.14) (4.92) (6.81) (9.23)
Firm Specific
Characteristics Yes Yes Yes Yes Yes Yes
Peer Firm Avg.
Characteristics Yes Yes Yes Yes Yes Yes
Real GDP
Growth Yes Yes Yes Yes Yes Yes
Obs. 426,701 426,701 426,701 430,003 430,003 430,003
No. of Firms 15,677 15,677 15,677 15,788 15,788 15,788
Adjusted
R-squared 0.145 0.145 0.145 0.222 0.222 0.223
Firm fixed effects Yes Yes Yes Yes Yes Yes
periods as another measure of investment.
Afterwards, I run regression using the first difference model and test the effects of
the general, the news-based and the tax-related EPU index and peer firm average
investment on corporate investments. The results in Table 5.2 show that all the
coefficients of the interaction terms between the EPU index and the peer firm average
investment are positive and most of the coefficients are significant at 5% level, using the
general, news-based as well as tax-related EPU index. Therefore, the results are robust to
alternative measurements of investment as well as the other two components of the EPU
index.
5.3 ADDITIONAL CONTROL VARIABLES
Another concern is the omitted firm-level characteristics that influence a firm’s
investment decisions. For example, Ahn, Denis and Denis (2006) document that firm
leverage has negative impact on investment decisions within diversified firms.
Specifically, the impact is greater for high Q than for low Q firms. Aivazian, Ge and Qiu
(2003) find evidences that firm leverage has significant impact on investment decisions.
Hadlock et al. (2010) argue that firm size is a particularly useful predictor for firms’
financial constraint levels, which are accordingly related to firms’ investment decisions.
In Table 5.3, I report the regression results after controlling firm leverage and size.
I use natural logarithm of firm total assets to measure firm size and the ratio of firm total
Table 5.3 ADDITONAL CONTROLS
VARIABLES
General
Investment
News
Investment
Taxes
Investment
Peer Firm Avg. Investment 0.475*** 0.341*** 0.588***
(3.27) (3.01) (17.18)
EPU (t-1) -0.511 -0.865 0.074
(-1.49) (-1.35) (0.77)
Peer Firm Avg. Investment * EPU (t-1) 0.073** 0.101*** 0.054***
(2.36) (4.23) (7.79)
Sale Growth (t-1) 0.000*** 0.000*** 0.000***
(5.18) (5.17) (5.16)
Tobin's Q (t-1) 0.084*** 0.084*** 0.084***
(24.96) (24.96) (24.97)
Cash Flow (t-1) 2.075*** 2.073*** 2.069***
(22.39) (22.37) (22.31)
Book Leverage (t-1) -0.399*** -0.399*** -0.399***
(-15.20) (-15.19) (-15.17)
Size (t-1) -0.145*** -0.144*** -0.146***
(-19.18) (-19.16) (-19.34)
Peer Firm Avg. Sale Growth (t-1) 0.000 0.000 0.000
Table 5.3 ADDITONAL CONTROLS (CONTINUED)
Peer Firm Avg. Tobin's Q (t-1) -0.042*** -0.042*** -0.040***
(-4.72) (-4.74) (-4.44)
Peer Firm Avg. Cash Flow (t-1) 0.241 0.195 0.207
(0.75) (0.60) (0.64)
Peer Firm Avg. Book Leverage (t-1) 0.134 0.129 0.153*
(1.61) (1.55) (1.83)
Peer Firm Avg. Size (t-1) -0.050*** -0.049*** -0.060***
(-3.57) (-3.50) (-4.27)
Real GDP Growth (t-1) -0.109* -0.342* 0.023
(-1.77) (-1.65) (0.20)
Constant 3.794** 5.952* 0.949*
(2.33) (1.73) (1.67)
Obs. 462,327 462,327 462,327
Number of Firms 16,429 16,429 16,429
Adjusted R-squared 0.254 0.254 0.255
Firm fixed effects Yes Yes Yes
either firm investment. I run regression using general U.S. economic policy uncertainty
and the two main components of the BBD index. The results demonstrate that the peer
effects are strengthened during the periods of economic policy uncertainty, which are
consistent with the previous regression results. In general, after controlling firm size and
leverage, I continue to find statistically significant results, which conform to the main
CHAPTER 6
LIMITATIONS
The paper generally tests that peer effects are magnified by economic policy
uncertainty. Based on reputation-based theory and information-based theory, the follower
firms are likely to follow the leader firms, while the leader firms are less likely to follow
the follower firms. In other words, leaders lead and followers follow. The empirical results
support my hypotheses. However, there are still some limitations of the paper.
First, the definition of peer effects is roughly the firms in the same industry at the
same time period excluding the firm itself. When calculating the peer firm characteristics,
the effects of leaders firms are weakened by the follower firms. If there is a concrete
measure of peer firms, then the general peer effects can be precisely approximated.
Second, I support my hypotheses by two theories, i.e. reputation-based theory and
information-based theory. However, I do not find appropriate ways to test the two
channels. For example, reputation-based mechanism suggested that higher economic
policy uncertainty increases CEO career concerns. And it leads to stronger peer effects due
to increased career concerns of managers. At the same time, it might be likely that higher
economic policy uncertainty worsen agency conflicts between managers and shareholders.
Agency conflicts can be resolved by good corporate governance, through either incentive
plans (CEO compensation) or monitoring. However, this paper does not provide a channel
Future studies can investigate the possible channel through which peer effects are
magnified by economic policy uncertainty. As well as, future studies can also test the peer
effects on the other aspects of firm behavior, e.g. cash holdings, stock splits, dividend
CHAPTER 7
CONCLUSION
The paper shows that firms do not make investment decisions in isolation, and
firms’ investment decisions actively respond to the investments of their peers, when
facing economic economic policy uncertainty. In other words, peer firms’ investments
influence corporate investment decisions significantly during the periods of economic
policy uncertainty. Indeed, peer firms’ behaviors have robust and remarkable impact on
corporate investments. Besides, I provide theoretical support (i.e. reputation based theory
and information based theory) for the findings on peer effects, from the perspective of
managers. Afterwards, I observe that the influence from the peers is stronger for
relatively less successful firms (i.e. less valued firms, less profitable, financially
constrained firms and firms with lower growth rates).
The results are robust to the additional tests. The empirical findings suggest that
the impact of peer effects on corporate investments is significant during the periods of
economic policy uncertainty. However, whether following closely to peers’ investments
leads to more efficient investment decisions and the efficient capital allocation in the
economy still remains unclear. On the one hand, less successful firms have more
incentives to imitate, especially when they face economic policy uncertainty, in order to
maintain their industrial status. On the other hand, they may be lack of resources and
proven incapable of imitating their successful and profitable peers. Moreover, imitating