IJEDR1402166
International Journal of Engineering Development and Research (www.ijedr.org)2324
Optimization of Spot Welding Process Parameters for
CRCA Material using Taguchi Method
1
Manjunath R. Rawal,
2Dr.
K .H. Inamdar
1M.Tech Student, 2Professor, 1 Department of Mechanical Engineering, 1
Walchand College of Engineering, Sangli, Maharashtra, India
1[email protected], 2[email protected]
________________________________________________________________________________________________________
Abstract— Resistance spot welding (RSW) process is a major sheet metal joining processes. Used in Automobile, Aerospace and Home appliances Industries. Because it has the advantage of high speed operation, high-production assembly lines and suitability for automation. In any car nearly about 3000 - 4000 spot weld joining is used, which shows the importance of resistance spot welding processes. In RSW the joining of sheet metal is combination of mechanical, electrical, thermal and metallurgical phenomenon. The strength of spot weld is depending on the parameters and their levels used for welding process. This paper presents an experimental investigation for the Tensile Shear (T-S) strength of spot weld by using Taguchi method. An experimental study is conducted under various levels of process parameters. Spot welds are carried out on Cold Rolled Close Annealed (CRCA) material. Welding current, Electrode force and weld time are selected as process parameters with three levels of each. Taguchi quality design concept of L9 orthogonal array has been used to determine S/N Ratio, Analysis of Variance (ANOVA). The level of importance of welding parameters for T-S strength is determined by ANOVA in Minitab 16 software. The confirmation test indicated that it is possible to increase tensile shear strength significantly.
Index Terms—Resistance Spot Welding (RSW), Taguchi method, Cold Rolled Close Annealed (CRCA) material, ANOVA
and Tensile Shear Strength.
________________________________________________________________________________________________________
I.INTRODUCTION
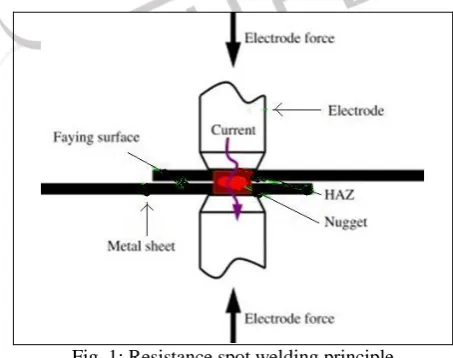
Resistance spot welding (RSW) process in which coalescence of metal is produced at the faying surface by the heat generated at the joint by the contact resistance to the flow of electric current. The materials to be joined are brought together under pressure by a pair of electrodes. A high electric current passes through the work pieces hold between the electrodes. Due to contact resistance and joule heating, a molten weld nugget is formed in the work pieces. The amount of heat produced is a function of current, time, and resistance between the work pieces. It is desirable to have the maximum temperature at the interface of the parts to be joined. Therefore, the resistance of the work pieces and the contact resistance between the electrodes and work should be kept as low as possible with respect to the resistance between the faying surfaces. The principle of operation is as shown in Fig. 1.
Fig. 1: Resistance spot welding principle
IJEDR1402166
International Journal of Engineering Development and Research (www.ijedr.org)2325
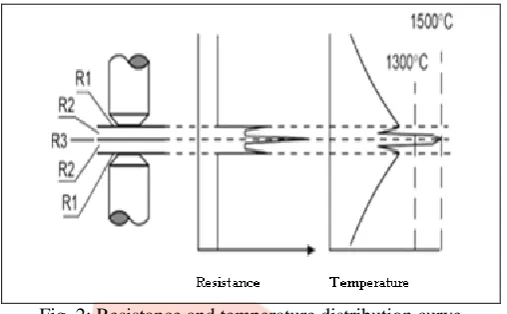
shown in Fig. 2. Where R1, R2, R3 are the resistances at the Electrode tip and plate surface, Resistance of joining plates, Resistance at the interface of two plates respectively.The weld strength is measured by a number of standardized destructive tests, which subject the weld to different types of loading. Some of these are tension-shear, tension, torsion, impact, fatigue, and hardness. The stiffness and the operating strength of sheet metal parts are strongly influenced by the welding parameters and location of the spot welding. It is very important to select the welding process parameters for obtaining optimal weld strength. The desired welding process parameters are determined based on experience or from a handbook. However, this does not ensure that the selected welding process parameters can produce the optimal or near optimal weld strength for that particular welding machine and environment. Various aspects of modeling, simulation, and process optimization techniques are used in the resistance spot welding process. Detailed analysis has been made to establish relationships between welding parameters weld strength, weld quality, and productivity to select welding parameters leading to an optimal process [1-2].
Fig. 2: Resistance and temperature distribution curve
1.1 Heat Generation in Resistance Spot Welding
The three main parameters in spot welding are current, contact resistance and weld time. In order to produce good quality weld the above parameters must be controlled properly. The amount of heat generated in this process is governed by the formula,
Q = I²RT (1)
Where,
Q - Heat generated (J); I - Welding current (A);
R - Resistance of the work piece (Ω); T - Time of current flow (Sec or cycle).
1.2 Resistance Spot Welding Parameters
There are various parameters with their different levels of operation which directly or indirectly controls the quality of spot weld joint. These parameters and their possible levels of operation can be well understood by cause and effect diagram shown in Fig. 3.
Fig. 3: Cause and effect diagram
II.LITERATURE REVIEW
IJEDR1402166
International Journal of Engineering Development and Research (www.ijedr.org)2326
welding current was about two times more important than the second ranking factor (electrode force) for controlling the tensile shear strength.A.K. Pandey, M.I. Khan. K.M. Moeed [3] investigation indicate the welding current to be the most significant parameter controlling the weld tensile strength as well as the nugget diameter for AISI-1008 steel sheets .Also they effectively use taguchi method for optimization of spot welding parameters.
D.S. Sahota, Ramandeep Singh, Rajesh Sharma, Harpreet Singh [4] has studied the effect of parameters on resistance spot weld of ASS316 material. In order to his study the significance of the process parameters i.e. current, electrode force and weld cycles, towards the percentage improvement in material hardness. From his results it is clear that parameters significantly affect both the mean and the variation in the percentage improvement in Hardness values of the ASS316 material.
Niranjan Kumar Singh and Dr. Y. Vijayakumar [5] has presented an investigation on the optimization and effect of welding parameters on indentation of spot welded AISI 301L stainless steel. The level of importance of the welding parameters on indentation is determined by ANOVA (main effect plots). Based on ANOVA method, the highly effective parameters on indentation are found as weld cycle, interaction between weld current & weld cycle and interaction between weld current, weld cycle & hold time whereas weld current, hold time and cool time were less effective factors.
B. D. Gurav [6] has presented an investigation on the optimization and effect of welding parameters on the tensile Shear strength of spot welded CRCA steel sheets. Based on the ANOVA results, The right section of the input parameters are high current, medium electrode force and high weld time
A. G. Thakur et al.[9] An experimental investigation for optimization of Tensile Shear (T-S) strength of RSW for Galvanized steel by using Taguchi method. The experimental studies were conducted under varying welding current, welding time, electrode diameter and electrode force.
III.TAGUCHI METHOD
The Taguchi method involves reducing the variation in a process through robust design of experiments. The overall objective of the method is to produce high quality product at low cost to the manufacturer. The Taguchi method was developed by Dr. Genichi Taguchi.
Instead of having to test all possible combinations like the factorial design, the Taguchi method tests pairs of combinations. This allows for the collection of the necessary data to determine which factors most affect product quality with a minimum amount of experimentation, thus saving time and resources. The Taguchi method is best used when there are an intermediate number of variables (3 to 50), few interactions between variables, and when only a few variables contribute significantly.
An advantage of the Taguchi method is that it emphasizes a mean performance characteristic value close to the target value rather than a value within certain specification limits, thus improving the product quality. Additionally, Taguchi's method for experimental design is straightforward and easy to apply to many engineering situations, making it a powerful yet simple tool. It can be used to quickly narrow the scope of a research project or to identify problems in a manufacturing process from data already in existence.
The main disadvantage of the Taguchi method is that the results obtained are only relative and do not exactly indicate what parameter has the highest effect on the performance characteristic value. . Another limitation is that the Taguchi methods are offline, and therefore inappropriate for a dynamically changing process such as a simulation study.
Using Taguchi analysis the effect of various process parameters at different level on welding quality is analyzed and optimal settings of the various parameters have been accomplished. This is form of design of experiment (DOE) with special application principles. The philosophy of Taguchi is broadly applicable and has three stages in process development [9-10].
i. System design:
This is design at the conceptual level, involving creativity and innovation ii. Parameter design:
Once the concept is established, the nominal values of the various dimensions and design parameters need to be set, the detail design phase of conventional engineering. Taguchi's radical insight was that the exact choice of values required is under-specified by the performance requirements of the system. In many circumstances, this allows the parameters to be chosen so as to minimize the effects on performance arising from variation in manufacture, environment and cumulative damage. This is sometimes called robustification. Robust parameter designs consider controllable and uncontrollable noise variables; they seek to exploit relationships and optimize settings that minimize the effects of the noise variables.
iii. Tolerance design:
With a successfully completed parameter design, and an understanding of the effect that the various parameters have on performance, resources can be focused on reducing and controlling variation in the critical few dimensions.
Taguchi recommends that statistical experimental design method can be employed to assist in quality improvement particularly during parameter and tolerance design. DOE and Taguchi method have wide application in analyzing manufacturing and production processes.
IV.EXPERIMENTATION DETAILS
IJEDR1402166
International Journal of Engineering Development and Research (www.ijedr.org)2327
Fig. 4: Spot weld specimen dimension by AWS.3.1 Chemical composition of CRCA material
The chemical composition for each element of the above material is listed below in table 1: Table 1:Chemical composition of CRCA
Content C % Mn % P % S % Fe %
Value 0.0520 0.221 <0.0030 0.00443 99.2
3.2 Selection of Process Parameters and Levels
In the present study of resistance spot welding, three main parameters namely Welding Current, Electrode Force and Weld Time are selected with three levels of each as shown in table 2. The output parameter predicting strength of weld joint is tensile shear strength.
Table 2:Process Parameters and Levels Sr.
No Process Parameters Parameter Level 1 Level 2 Level 3
1 Welding Current (kA) A 4.8 5.9 7
2 Electrode Force (KN) B 0.343 0.392 0.441
3 Weld Time (cycle) C 40 45 50
3.3 Selection of Orthogonal Array (OA)
Depending upon number of levels in a factor, a 2 or a 3 level OA can be selected. If some factors are two-level and some three-level, then whichever is predominant should indicate which kind of OA is selected. Once the decision is made about the right OA, then the number of trials for that array must provide an adequate total DoF, When required DoF fall between the two DoF provided by two OAs, the next larger OA must be chosen [3,8].
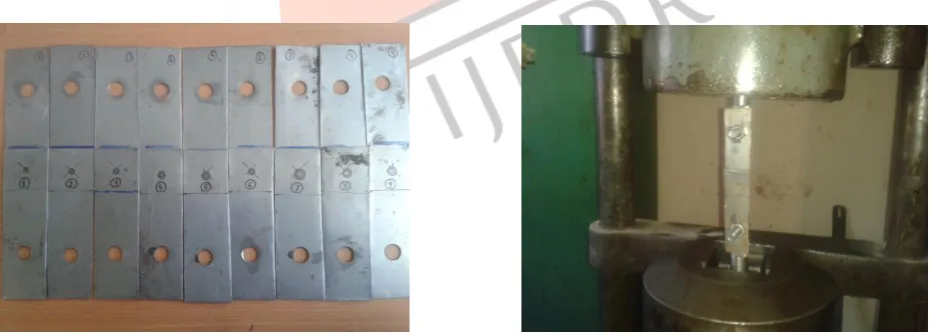
Here for experimentation we select L9 Taguchi orthogonal array for three process parameters and three levels of each parameters. Fig. 5 & 6 shows the photograph of spot welded specimen according to L9 OAs and Tensile Shear testing of specimens carried out on UTM machine respectively.
Fig. 5: Photograph of Spot welded specimens Fig. 6: Photograph of Tensile Testing on UTM machine.
3.4 Overall Loss Function & S/N Ratio
Taguchi recommends analyzing data using the S/N ratio that will offer two advantages; it provides guidance for selection the optimum level based on least variation around on the average value, which closest to target, and also it offers objective comparison of two sets of experimental data with respect to deviation of the average from the target. The experimental results are analyzed to investigate the main effects.
IJEDR1402166
International Journal of Engineering Development and Research (www.ijedr.org)2328
Tensile shear strength of the welded structures belongs to the larger-the-better quality characteristics. The loss function of the larger-the-better quality characteristics can be expressed as,(2) (3)
Where, n is the number of tests, and yi the experimental value of the ith quality characteristic, Lj overall loss function and ηj is
the S/N ratio [1, 3-8]. By applying Equations (2)–(3), the η corresponding to the overall loss function for each experiment of L9 was calculated and given in Table 3.
The effect of each welding process parameter on the S/N ratio at different levels can be separated out because the experimental design is orthogonal. The S/N ratio for each level of the welding process parameters is summarized in Table 3.
Table 3:Experimental data for T-S Strength and S/N ratio
Sr. No Welding Current (kA) Electrode Force (kN) Weld Time (cycle) T-S Strength (kN) (Mean) S/N Ratio
1 4.8 0.343 40 3.58 11.0777
2 4.8 0.392 45 3.24 10.2109
3 4.8 0.441 50 3.29 10.3439
4 5.9 0.343 45 3.97 11.9758
5 5.9 0.392 50 4.42 12.9084
6 5.9 0.441 40 3.65 11.2459
7 7.0 0.343 50 4.71 13.4604
8 7.0 0.392 40 4.56 13.1793
9 7.0 0.441 45 4.51 13.0835
The mean S/N ratio for each level of the welding parameters is summarized and called the S/N response table for tensile shear strength as shown in table 4.
Table 4:Response for Signal to Noise Ratios
Level Welding
Current (kA)
Electrode Force (kN)
Weld Time (cycle)
1 10.54 12.17 11.83
2 12.04 12.10 11.76
3 13.24 11.56 12.24
Delta 2.70 0.61 0.48
Rank 1 2 3
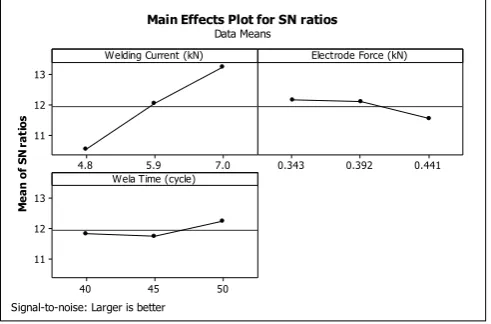
The tabulated values shown in table no. 4 can be well understood by main effect plot for S/N ratio as shown in Fig. 7. This shows which parameter level is significant for each parameters corresponding higher T-S strength of spot welded specimen.
7.0 5.9 4.8 13 12 11 0.441 0.392 0.343 50 45 40 13 12 11
Welding Current (kN)
M e a n o f S N r a ti o s
Electrode Force (kN)
Wela Time (cycle)
Main Effects Plot for SN ratios Data Means
Signal-to-noise: Larger is better
Fig. 7:Main Effects Plot for SN ratios
3.5 Analysis Of Variance (ANOVA)
IJEDR1402166
International Journal of Engineering Development and Research (www.ijedr.org)2329
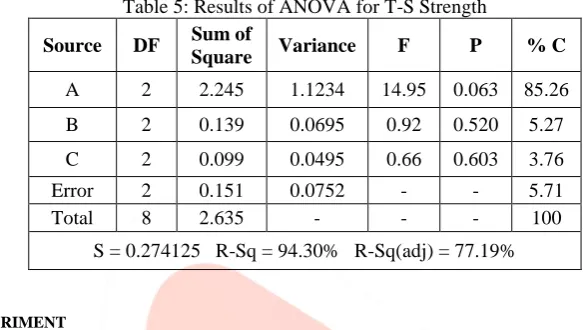
The main aim of ANOVA is to investigate the design parameters and to indicate which parameters are significantly affecting the output parameters. In the analysis, the sum of squares and variance are calculated. F-test value at 95 % confidence level is used to decide the significant factors affecting the process and percentage contribution is calculated. Larger F-value indicates that the variation of the process parameter makes a big change on the performance. The ANOVA analysis for T-S strength is shown in Table-5.According to this analysis, the most effective parameters with respect to tensile shear strength is welding current, electrode force and welding time. Percent contribution indicates the relative power of a factor to reduce variation. For a factor with a high percent contribution, a small variation will have a great influence on the performance [1, 6, and 9].
According to Tables 5, Welding Current was found to be the major factor affecting the tensile strength (85.26%), Electrode force was found to be the second ranking factor (5.27%), whereas Welding Time being (3.76%) respectively.
Table 5:Results of ANOVA for T-S Strength
Source DF Sum of
Square Variance F P % C
A 2 2.245 1.1234 14.95 0.063 85.26
B 2 0.139 0.0695 0.92 0.520 5.27
C 2 0.099 0.0495 0.66 0.603 3.76
Error 2 0.151 0.0752 - - 5.71
Total 8 2.635 - - - 100
S = 0.274125 R-Sq = 94.30% R-Sq(adj) = 77.19%
V.CONFIRMATION EXPERIMENT
The confirmation experiment is the final step in the first iteration of the design of the experiment process. The purpose of the confirmation experiment is to validate the conclusions drawn during the analysis phase. The confirmation experiment is performed by conducting a test with a specific combination of the factors and levels previously evaluated. In this study, after determining the optimum conditions and predicting the response under these conditions, a new experiment was designed and conducted with the optimum levels of the welding parameters. The final step is to predict and verify the improvement of the performance characteristic. The predicted S/N ratio ^η using the optimal levels of the welding parameters can be calculated as,
(4)
Where, ηm is total mean of S/N ratio, η is the mean of S/N ratio at the optimal level, and n is the number of main welding
parameters that significantly affect the performance [1, 3-8]. The results of experimental confirmation using optimal welding parameters and comparison of the predicted tensile shear strength with the actual tensile shear strength using the optimal welding parameters are shown in Table 6.
Table 6:Results of Confirmation Experiment
Source
Initial Process Parameter
Optimal Process
parameters Improvement
in S/N ratio
Prediction Expt.
Levels A3 B3 C2 A3 B1 C3 A3 B1 C3
2.397
T-S (kN) 3.65 4.71 4.81
S/N (dB) 11.246 13.460 13.643
REFERENCES
[1] Ugur Esme, “Application of Taguchi Method for the Optimization of Resistance Spot Welding Process,” The Arabian Journal for Science and Engineering, April 14, 2008, vol. 34, pp. 519-528.
[2] Norasiah muhammad, Yupiter H. P, Manurung and Roseleena Jadfar, “Model Development for Quality Features of Resistance Spot Welding using Multi-objective Taguchi Method and Response Surface Methodology,” 11 July 2011. [3] A. K. Pandey, M. I. Khan and K. M. Moeed, “Optimization of Resistance Spot Welding Parameters using Taguchi
Method,” International Journal of Engineering Science and Technology (IJEST), 2013, vol. 5, no.02, pp. 234-241. [4] D.S. Sahota, Ramandeep Singh, Rajesh Sharma, Harpreet Singh, “Study of Effect of Parameters On Resistance Spot
Weld of ASS316 Material,” Mechanica Confab, Vol. 2, No. 2, February-March 2013, pp. 67-78.
[5] Mr. Niranjan Kumar Singh and Dr. Y. Vijayakumar, “Application of Taguchi method for optimization of resistance spot welding of austenitic stainless steel AISI 301L,” Innovative Systems Design and Engineering, 2012, vol 3, pp. 49-61. [6] B. D. Gurav , “Optimization of the Welding Parameters in Resistance Spot Welding,” International Journal of Mechanical
IJEDR1402166
International Journal of Engineering Development and Research (www.ijedr.org)2330
[7] Handbook for resistance spot welding, (2005)http://www.millerwelds.com/pdf/Resistance.pdf cited on 11 January 2014 at3:15 pm.
[8] A.K. Pandey, M.I. Khan. K.M. Moeed, “Investigation of the effect of current on tensile strength and nugget diameter of spot welds made on AISI-1008 steel sheets,” International Journal of Technical Research and Applications, 2013, vol. 1, pp. 01-08.
[9] A. G. Thakur, T. E. Rao, M. S. Mukhedkar and V. M. Nandedkar, “Application of Taguchi Method for Resistance Spot Welding of Galvanized Steel,” ARPN Journal of Engineering and Applied Sciences, Nov. 2010, vol. 5, no.11, pp. 22-26. [10]A. G. Thakur, V. M. Nandedkar, “Application of Taguchi Method to Determine Resistance Spot Welding Condition of