STATISTICAL METHODS FOR ASSESSING THE RISK
AND TIMING OF VERTICAL TRANSMISSION OF
HUMAN IMMUNODEFICIENCY VIRUS
A THESIS PRESENTED FOR THE DEGREE OF
DOCTOR OF PHILOSOPHY
UNIVERSITY OF LONDON
DAVID TYRE DUNN
INSTITUTE OF CHILD HEALTH
ProQuest Number: 10106947
All rights reserved
INFORMATION TO ALL USERS
The quality of this reproduction is dependent upon the quality of the copy submitted.
In the unlikely event that the author did not send a complete manuscript and there are missing pages, these will be noted. Also, if material had to be removed,
a note will indicate the deletion.
uest.
ProQuest 10106947
Published by ProQuest LLC(2016). Copyright of the Dissertation is held by the Author.
All rights reserved.
This work is protected against unauthorized copying under Title 17, United States Code. Microform Edition © ProQuest LLC.
ProQuest LLC
789 East Eisenhower Parkway P.O. Box 1346
ABSTRACT
Various methods have been used to estimate the HIV vertical transmission rate and the paediatric AIDS incubation period. These are reviewed, and the
standard method of analysis, which ignores children of indeterminate infection status, is shown to be biased. A new method of estimation that is appropriate for prospective studies conducted in non-breastfeeding populations is described. The method, based on an EM algorithm, takes into account clinical, virological, and immunological data and is more efficient than previous approaches. The method was applied to data from the European Collaborative Study and revealed evidence of temporal changes in the transmission rate and the AIDS incubation period.
An individual patient meta-analysis of polymerase chain reaction (PGR) data on neonates subsequently shown to be HIV-infected was conducted. The main objectives were to estimate the age-specific sensitivity of the assay and the relative contributions of intrauterine and intrapartum transmission. Distribution- free and parametric approaches were used for the analysis of the data, which were interval-censored. The sensitivity of PGR was shown to be higher than previously thought. Approximately one-third of vertically-acquired HIV infection could be attributable to intrauterine transmission.
In a retrospective cohort study conducted in the State of Sao Paulo, Brazil, there was considerable variation in breastfeeding practice. Models, with structures reflecting the series of potential exposures to the virus (intrauterine, intrapartum, breastfeeding), were developed to estimate the risk of
TABLE OF CONTENTS
Abstract 2
List of Tables 6
List of Figures 7
Acknowledgements 9
Preface 10
1 A review of methods for estimating the HIV vertical 11
transmission rate and the paediatric AIDS incubation period
1.1 Historical background 11
1.2 Diagnosing HIV infection in epidemiological studies 12
1.3 Standard method for estimating the vertical transmission rate 13 from prospective studies
1.4 Alternative methods for estimating the vertical transmission 14 rate from prospective studies
1.5 Estimating the vertical transmission rate from analysis of 17 neonatal blood specimens
1.6 Estimating the paediatric AIDS incubation period 18
1.7 Studies conducted in settings with high rates of infant 21 mortality
2 A new method for estimating the HIV vertical transmission rate 28
and the paediatric AIDS incubation period from prospective
data
2.1 Outline of new method 28
2.2 Theory 28
2.2.1 The model. 28
2.2.2 Identifi ability 31
2.2.3 Estimation 32
2.2.4 Precision of estimates 36
2.2.5 Covariates 37
2.3 Example 38
2.3.1 Description of study 38
2.3.2 Application of new method 40
2.3.4 Effect of calendar period 42
2.4 Conclusions 43
2.4.1 Discussion of findings and comparison with other 43 studies
2.4.2 Model assumptions 45
3 A study to determine when HIV DMA is first detectable in 58
vertically-infected infants
3.1 Epidemiological background 58
3.2 Data collection 59
3.3 Statistical methods 60
3.3.1 Non-parametric model 60
3.3.2 Parametric models 63
3.3.3 Locally-weighted regression 65
3.4 Results 66
3.4.1 Age-specific estimates of percentage of children ever 66 DNA positive
3.4.2 Effect of mode of delivery 68
3.4.3 Comparison of methods for deriving confidence 68
intervals
3.5 Discussion 69
3.5.1 Timing of transmission 69
3.5.2 Early diagnosis of HIV infection 71
3.5.3 Related studies 72
4 The risk of HiV transmission by duration of breastfeeding 84
4.1 Background 84
4.2 Description of Sao Paulo study and results of basic analyses 85
4.3 Results using non-parametric analyses 87
4.4 Serial exposure model - constant hazard 88
4.4.1 Theory 88
4.4.2 Results 89
4.5 Individual variation in hazard rate 89
4.5.1 Theory 90
4.6 Incorporating variation into probability of prepartum 93 transmission
4.6.1 Theory 93
4.6.2 Results 95
4.7 Interpretation of model as frailty parameter becomes 96
arbitrarily large
4.8 Estimates of frailty from other types of study 97
4.8.1 Twin study 97
4.8.2 Studies of viral load and vertical transmission 98
4.8.3 Consistency of estimates 99
4.9 Factors that could bias estimates of model parameters 100
4.9.1 Reverse causality 100
4.9.2 Indeterminate infection status 101
4.9.3 Error in recording duration of breastfeeding 101
4.10 Relationship to partner studies of sexual transmission 102
4.11 Public health implications 104
5 General discussion 120
Appendices
2.1 FORTRAN 77 program to implement EM algorithm 124
2.2 Partial double derivatives in Section 2.2.4 129
2.3 Listing of data used in Section 2.3 131
3.1 Letter to prospective investigators about PGR study 134
3.2 Listing of data used in Section 3.4 135
4.1 Listing of data used in Sections 4.2-4.6 136
References 137
LIST OF TABLES
1.1 Estimated transmission rates from studies using non-standard 25 method of analysis
1.2 Studies using AIDS surveillance data to estimate the paediatric 26 AIDS incubation period
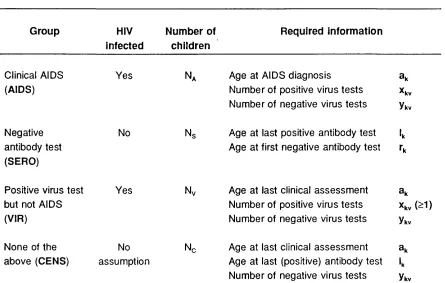
2.1 Classification of children and information required by the 48 proposed method
2.2 Comparison of crude estimates and maximum likelihood 49
estimates under proposed model
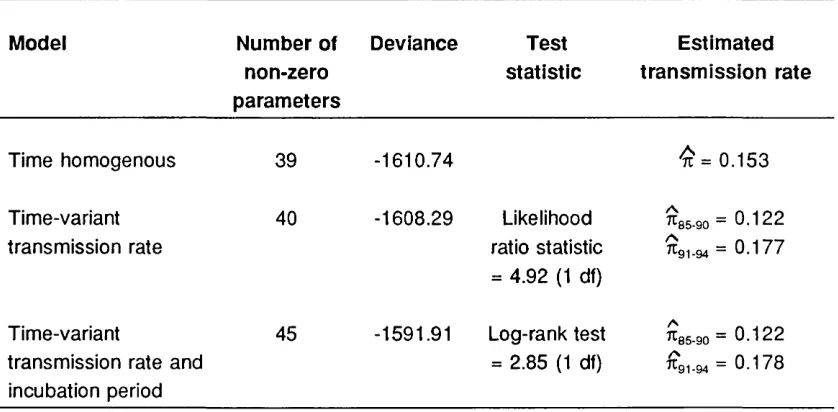
2.3 Comparison of time-homogenous and time-variant models 50
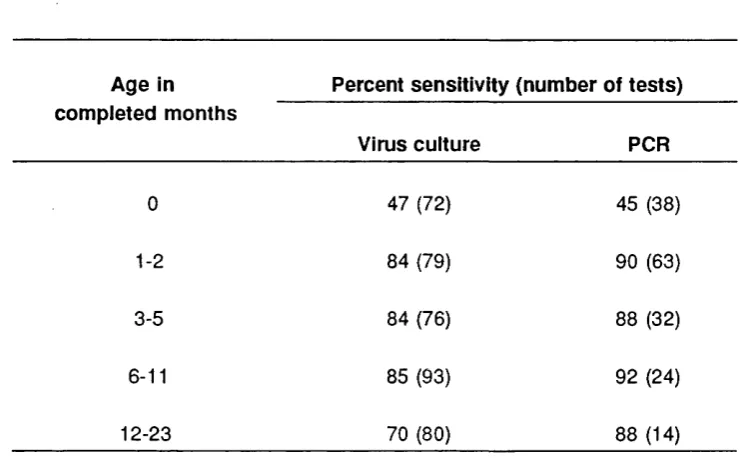
2.4 Sensitivity of virus culture and PCR according to age 51
2.5 Results of beta-binomial models applied to virus test data 52
3.1 Estimates of the cumulative percentage of children with 78
detectable HIV DNA
3.2 Results of analyses using parametric models 79
3.3 90% confidence intervals obtained by Peto’s method and by 80 method of profile likelihood
3.4 Negative predictive value of PCR at selected ages 81
4.1 Transmission rate by whether breastfed 106
4.2 Transmission rate by duration of breastfeeding 107
4.3 Results of different serial exposure models 108
4.4 Effect of excluding potential influential observations 109
4.5 Mode of transmission as frailty parameter becomes arbitrarily 110 large
LIST OF FIGURES
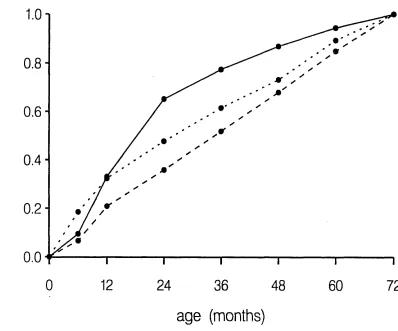
1.1 Probability of developing AIDS before age t months conditional 27 on AIDS developing before age 72 months
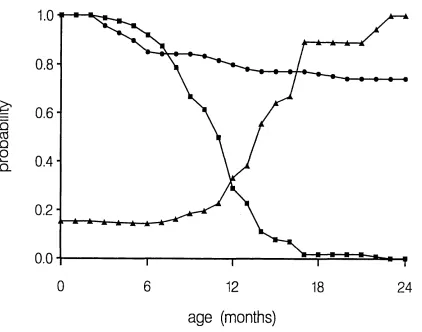
2.1 Estimates of the survivor functions for AIDS, antibody loss, and 53 of the conditional probability of infection for a child aged t
months who is antibody positive, has not developed AIDS, and has never received a virus test
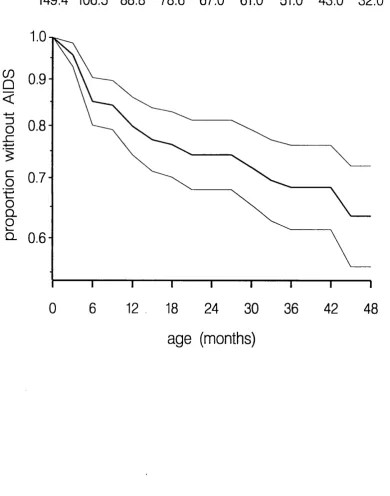
2.2 Estimate of the survivor function for AIDS 54
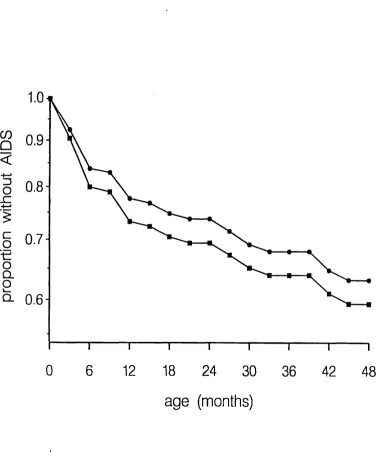
2.3 Maximum likelihood estimator and standard estimator of the 55 survivor function for AIDS
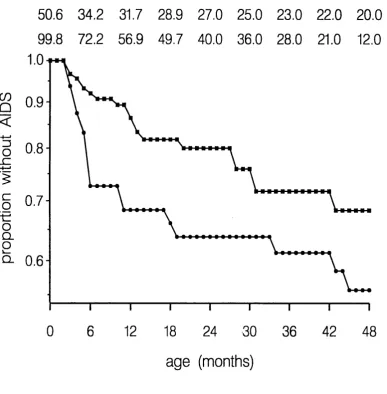
2.4 Estimates of the survivor function for AIDS among 415 children 56 born between 1985-88 and 562 children born between 1989-94
2.5 Non-parametric estim ator and parametric estimator of survivor 57 function for antibody loss
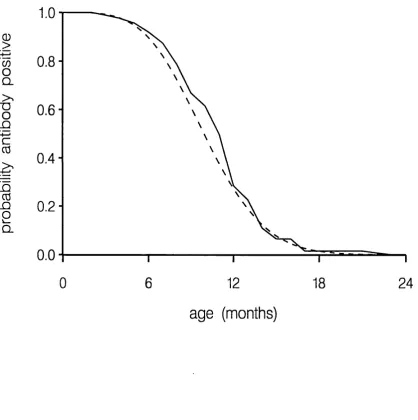
3.1 Cumulative percentage DNA positive using non-parametric 74
model
3.2 Cumulative percentage DNA positive conditional on being DNA 75 negative at birth
3.3 Effect on log-logistic model of excluding outlying observations 76
3.4 Comparison of non-parametric model and parametric models 77
3.5 Locally-weighted regression models 78
3.6 Cumulative percentage DNA positive for caesarean section 79
deliveries
4.1 Estimated probability of transmission by duration of 112
breastfeeding - non-parametric analyses
4.2 Estimated probability of transmission by duration of 113
breastfeeding - models without frailty in prepartum transmission
4.3 Assessm ent of goodness of fit 114
4.4 Estimated probability of transmission by duration of 115
4.5 Profile log-likelihood for frailty parameter 116
4.6 Probability density function for latent risk of prepartum 117 transmission
4.7 Probability density function for latent hazard rate of 118
transmission through breastfeeding
ACKNOW LEDGEM ENTS
I am very grateful to Tony Ades for his generous support and encouragement, not only in my Ph.D. but in my work generally. Beatriz Tess kindly allowed me to use data from the Sao Paulo Collaborative Study for Vertical Transmission of
PREFACE
Between 1991-1996 I was the statistician to The European Collaborative Study, a large prospective study of children born to HIV-infected mothers. I was also fortunate to have access to other important datasets connected with vertically- acquired HIV infection. Many of the statistical problems I encountered were non-standard and to solve these I had to either develop new approaches or to modify uncommonly applied methods. The thesis describes the analyses which I consider to be the most interesting from a statistical standpoint. A common theme in these analyses is the assessment of the risk of transmission, its determinants, or its timing. The focus of the thesis is statistical methodology, and I have not attempted to review comprehensively the epidemiological
literature. I have not included two "standard" meta-analyses which I carried out of the risk of HIV transmission through breastfeeding (Dunn et al. 1992) and the effect of caesarean section delivery (Dunn et al. 1994).
Several of the analyses have already been published, and copies of the publications are attached at the end of the thesis. Formulae, but not the underlying theory, for estimating the rate of vertical transmission in studies conducted in settings with high rates of infant mortality (Section 1.5) are given in Dabis et al. (1993). The material in Chapter 2, which describes a new method for estimating the vertical transmission rate and the paediatric AIDS incubation period, is essentially contained in Dunn and Ades (1996), although some additional analyses are presented. This paper also contains a brief review of other approaches to this problem, which is developed more fully in Sections 1.1 and 1.2. The main results the distribution-free analysis of Chapter 3, a meta-analysis of polymerase chain reaction (PCR) data on neonates
1. A REVIEW OF METHODS FOR ESTIMATING THE HIV VERTICAL
TRANSMISSION RATE AND THE PAEDIATRIC AIDS INCUBATION PERIOD
This chapter is a review of different approaches that have been used to
estimate the HIV vertical transmission rate and the paediatric AIDS incubation p e rio d \ It covers prospective studies of children born to HIV-infected mothers, AIDS surveillance systems, and inference based on analysis of neonatal blood samples.
1.1 Historical background
The first cases of paediatric AIDS were described in 1982 (Centers for Disease Control 1982). Although HIV had not been isolated at this time, the fact that all their mothers had either AIDS or risk factors for AIDS suggested the
involvement of an vertically-transmissible infectious agent. Opportunities for epidemiological research remained limited, however, until the development of an antibody assay in 1985.
Early studies of vertical transmission of HIV were often poorly designed, suffering in particular from selective inclusion of infected infants (European Collaborative Study 1991). The risk of transmission was therefore generally overestimated, with some estimates as high as 50% (Friedland and Klein 1987). It is now recognised that reliable estimates of the risk of transmission can be obtained only from prospective studies of children born to HIV-infected mothers who are enrolled at the time of delivery (birth cohort studies). Multicentre
recruitment is usually essential to achieve adequate sample size. The first such studies were initiated in Europe (European Collaborative Study 1988, Blanche et al. 1989), although other studies have been conducted or are being conducted in most areas of the world where HIV is prevalent (Working Group of Mother-to- Child Transmission of HIV, 1995).
Birth cohort studies have also been used to examine risk factors for vertical transmission and to elucidate the natural history of vertically-acquired HIV infection, particularly the paediatric AIDS incubation period. An alternative approach is to utilise data reported to AIDS surveillance systems, although this requires the application of non-standard statistical techniques (see Section 1.5). With rare exceptions, AIDS surveillance systems exist only in industrialised countries (Commenges et al. 1992).
1.2 Diagnosing HIV infection in epidemiological studies
The standard diagnostic test for HIV infection is based on the detection of HIV IgG antibody. However, all children born to infected mothers initially test HIV antibody positive since maternal IgG antibody crosses the placenta. The absence of infection can be deduced from any subsequent negative antibody test, but a positive diagnosis is only possible from a test performed after the age when maternal antibody is no longer detectable. In an early report, Semprini et al. (1987) erroneously assumed a 9 months threshold and thus overestimated the transmission rate. In most studies a 15 months or 18 months threshold has been used (Boylan and Stein 1991), although maternal antibody has exceptionally been detected up to age 24 months (Kind et al. 1992).
In contrast, a positive virus test (p24 antigen, culture, polymerase chain reaction [PGR]) at any age is indicative of infection, although there have been rare
reports of children with early positive virus tests who appear to have subsequently "cleared" the virus (Bryson 1995). As a safeguard against
laboratory error the convention is to classify a child as infected only following a positive result on two or more separate samples. Virus tests have not been regarded as sufficiently sensitive to allow infection to be excluded on the basis of a negative test result. Sensitivity is particularly low in the first month of life (McIntosh et al. 1994, Dunn et al. 1995).
HIV infection or who is diagnosed with AIDS would always be classified as infected, although less rigorous criteria are som etimes used. For example, Goedert et al. (1989) defined as infected children who developed two or more signs in category P2A of the Centers for Disease Control (1987b) classification.
1.3 Standard method for estimating the vertical transmission rate from
prospective studies
The standard method of estimating the vertical transmission rate first requires each child enrolled in the study to be classified as infected, uninfected, or of indeterminate infection status. The numerator for the transmission rate is the number of infected children, and the denom inator is the number of infected plus uninfected children (Boylan and Stein 1991). This estimator is unaffected by the number of indeterminate children.
A child’s infection status may be indeterminate because of loss to follow-up, death not clearly related to HIV infection, delay in the communication of data from the paediatrician to the study coordinator, or the fact that the child was born shortly before the date of analysis. Loss to follow-up is unlikely to be independent of infection status as parents may be less inclined to bring healthy children for regular clinical examinations. This could explain the 39%
transmission rate reported from a study in Zam bia which had a 47% rate of loss to follow-up (Hira et al. 1989). Even if infection status is missing at random, the standard estimator of the transmission rate will still generally be biased. This results from the selective use of information in classifying infection status. For example, if a child develops AIDS he is defined as infected. But if he does not develop AIDS, suggesting but not proving that he is uninfected, this information is not taken into account. Likewise, the conventions of ignoring negative virus test results and positive antibody results before the threshold age result in positive and negative bias respectively.
whose infection status should in principle be known. Thus, if antibody
persistence beyond 18 months was regarded as proof of infection then children born less than 18 months before the date of analysis would be excluded
(European Collaborative Study 1991). A related technique is to base the
transmission rate on children with an antibody test after the threshold age (Tsai et al. 1994). However, this may bias estimates upwards as there is no external motivation for continuing follow-up of seronegative children to beyond the
threshold age. At the time these rules were developed, analysis centred on the results of antibody tests since virus tests were not widely available. This is no longer the case, and it is difficult to justify excluding from the analysis a child who has repeatedly tested virus positive merely because he is under 18 months of age at the date of analysis.
Dabis et al. (1992) proposed that potential bias should be examined by re- estimating the transmission rate assuming all indeterminate children to be either uninfected or infected. This is an attractive idea, but as most studies have at least 20% loss to follow-up the upper limit is usually infeasibly high (Working Group on Mother-to-Child Transmission of HIV 1995).
1.4 Alternative methods for estimating the vertical transmission rate from
prospective studies
between the last positive test and first negative test (interval censoring). The nonparametric estimator due to Turnbull (1976), which is the analogue of the Kaplan-Meier estimator for right censored data, was used. This method is discussed in detail in Section 3.3.1. Another difficulty in the analysis were children who died from HIV infection, since this censoring mechanism is not independent of the outcome event (antibody disappearance). This was
addressed by setting the censoring age to the age the child would have been at the date of analysis had he not died. The same procedure should be applied to children who test virus positive if, in such cases, antibody testing may be
discontinued before the threshold age for antibody persistence.
A related analysis was performed in the ACTG-076 trial, which was designed to assess the effectiveness of zidovudine in reducing vertical transmission (Connor et al. 1994). This analysis was based on the results of virus culture assays, which under the study protocol were conducted at birth and at ages 12, 24, and 78 weeks. Interval censoring was not taken into account, and separate Kaplan- Meier analyses were performed of age to first positive virus culture in the
intervention and placebo groups. The transmission rates were estimated from the asymptote of the distribution function (one minus the survivor function). No child tested positive for the first time at the 78 week sample and the distribution functions asymptoted at age 24 weeks. In effect, a child who tested negative at the 24 week sample was deemed to be uninfected. This is valid if virus culture sensitivity at this age is close to 100%, but this is not supported by findings in other studies. For example, McIntosh et al. (1994) report a sensitivity of 87% between 1-6 months of age. The appropriateness of a survival analysis model, which requires that once virus can be cultured in an infected child it can always be cultured, is questionable. Two less important criticisms are the inadequate description of the analysis of the six children who died due to HIV infection and an apparent error in censoring children at their last negative antibody test.
follow-up but have only one HIV antibody test at the threshold age for antibody persistence (they assume 15 months). Their method is based on a competing risks model where the two events are development of clinical evidence of HIV infection and censorship. It was assumed that the censoring time is
independent of both HIV infection status and the incubation period. This assumption, and the different mechanisms that may give rise to censoring, are discussed in detail in the paper. The maximum likelihood estimator of the transmission rate is shown to be
A = .
NSc(15)
where n^ is the number of children who test antibody negative, N is the size of the initial cohort, and 8^(15) is the survivor function for the censoring time C at age 15 months estimated by the Kaplan-Meier method. In effect, one minus the transmission rate is estimated as the proportion of children who test
antibody negative at age 15 months, where 8^(15) is an adjustment to obtain the correct denominator. Tsai et al. argue that a negative antibody test result below the threshold age should not be used to infer the absence of infection as "... infants might subsequently revert to antibody positive status ... either
because of technical failures in the testing procedure or because maternal antibodies may have disappeared before the infected children began to produce antibody". However, technical failures (i.e. false negatives) are no more likely at younger ages than at older ages, and although transient loss of antibody in infected children at around 3-6 months of age has been described, it is very uncommon (8im pson and Andiman 1994).
1.5 Estimating the vertical transmission rate from analysis of neonatal
blood specimens
Dried blood spot specimens are routinely collected from neonates in order to detect metabolic abnormalities. One way of monitoring the HIV epidemic in the heterosexual population is to test residual blood from the specimens for HIV antibody (Ades et al. 1995). This yields an estimate of the prevalence of HIV infection among child-bearing women.
Comeau et al. (1993) tested stored neonatal blood spots of children who developed AIDS by PCR. 35 (52%) of the 67 specimens were PCR positive. Based on this finding, it was proposed that a "real time" estimate of the
transmission rate could be obtained by testing all antibody-positive blood spots by PCR, calculating the proportion of these specimens which were PCR
positive, and multiplying this by a factor of 2.
The method was applied to 48,585 blood spot specimens from the New England Regional Newborn Screening Programme (Comeau 1994). 161 samples were Western Blot confirmed antibody positive, with 156 yielding sufficient material for PCR analysis, of which 10 were PCR positive. The transmission rate was therefore estimated as 2 x 10/156 = 6.4%.
1.6 Estimating the paediatric AIDS incubation period
in some prospective studies an attempt is made to follow-up HIV-infected children after infection is diagnosed in order to estimate the pediatric AIDS incubation period. The product-limit method (Kaplan and Meier, 1958) is commonly used; children who do not develop AIDS are censored at their last clinical examination. As with the standard estimator of the vertical transmission rate, children of indeterminate infection are excluded from the analysis.
Consequently, the rate of progression to AIDS is over-estimated as the
indeterminate children who are actually infected should contribute to the AIDS risk sets. The degree of this bias can be surprisingly large; empirical results are given in Section 2.3.3.
A number of investigators have estimated the incubation period based on paediatric AIDS case reports to routine surveillance systems (Table 1.2). This problem is identical to that of estimating the AIDS incubation period for
individuals infected through blood products with a known date of infection (Kalbfleisch and Lawless 1989). The principle limitation of such data is that we are aware only of those infected individuals who have already developed AIDS (i.e. right truncation) and thus patients with short incubation periods are more likely to be observed. Thus, the frequency distribution of incubation periods, as directly observed, will be misleading in that it underestimates the true
distribution (Downs et al. 1995). Bias is particularly serious at the beginning of the epidemic.
the distribution of has the truncated density (Commenges et al. 1992),
n
i=1j
f(t-Xi;0) dtm a x ( T L , X | )
( 1. 1)
Unless a functional (parametric) form is specified, f(s;0) is estimable only up to a constant of proportionality (Kalbfleisch and Lawless, 1989). That is, the data provide information only on incubation times conditional on AIDS developing by the age at the oldest observed AIDS diagnosis. This makes intuitive sense because, without external information, we have no knowledge about the number of HIV-infected children who have not yet developed AIDS. An algorithm for estimating f(s;0) under a discrete time model is described by Kalbfleisch and Lawless (1989), and under a continuous time model by Lagakos et al. (1988).
Figure 1.1 shows non-parametric estimates of the conditional AIDS incubation period from the studies listed in Table 1.2, except that only the most recent of the three analyses of the New York data is shown. This study by MaWhinney et al. (1994) indicates age-specific AIDS incidence to be approximately constant in the first 6 years of life. In the other studies, cases in early childhood were over-represented, specifically between 6-24 months in Kigali and between birth- 12 months in Europe.
discrete sub-populations of "rapid" and "slow" prog ressors among vertically- infected children.
However, the detailed study of Kalbfleisch and Lawless (1989) of the reliability of unconditional estimation (using a single Weibull distribution) casts doubt on the value of these analyses. They found that the problem of identifiability is only partly circumvented by parametric modelling and that the estimated centiles of the distribution function of the unconditional incubation period are highly imprecise. It is therefore not surprising that very wide interval estimates are obtained for functions of the parameters of the double Weibull distribution. For example, Downs et al. (1995) report a 95% confidence interval of 5.5-115 years for the median incubation time among the "slow" progressing sub-population.
In two closely related papers, AIDS surveillance data was combined with information from anonymous HIV screening programmes of neonatal blood specimens (DeGruttola et al. 1992, MaWhinney and Pagano 1994). This information, which was available for a 2-year period only, was used to infer the total number of children born to HIV-infected mothers. Children born outside this period essentially provide information only on the shape of the incubation period, whereas children born during this period constitute a cohort who also provide information on its scale. The analyses yielded estimates of cumulative progression to AIDS among all children born to HIV-infected mothers, rather than just HIV-infected children. MaWhinney and Pagano also incorporated an external estimate of the vertical transmission rate to derive an estimate of the paediatric AIDS incubation period.
(0.26/0.27).
A number of caveats regarding the use of routine surveillance data should be noted. First, it is assumed that the completeness of reporting of cases is independent of calendar time and age at diagnosis. However, in at least one data set there is a deficit of young cases in the early period of surveillance (Commenges et al. 1992). Second, it is important to account for delay in the reporting of cases. The simplest approach is to exclude all cases diagnosed less than X months before the date of analysis, where it is assumed that all cases are reported within X months of diagnosis. DeGruttola et al. (1992) found that even 2 years after diagnosis of AIDS, fewer than 80% of cases had been
reported, calling into question the common use of a 6 months (Auger et al. 1988) or 12 months (Downs et al. 1995) exclusion rule. An alternative and more efficient approach is to model the reporting delay distribution. In this context, Wang (1992) generalised the work of Kalbfleisch and Lawless (1989). Finally, the paediatric AIDS case definition has undergone periodic revision (Centers for Disease Control 1987b), and unless analysis is restricted to AIDS cases meeting a standard definition, interpretation of the estimated incubation period is problematic (DeGruttola et al. 1992)
1.7 Studies conducted in settings with high rates of infant mortality
In this section, a formula for the vertical transmission rate is developed for studies in which children receive their first antibody test at the threshold age when a definitive serological diagnosis can be made. In studies conducted in less-developed countries this is usually taken to be age 15 months. Notation is described in the following table. Mortality before the threshold age is estimated using standard survival analysis methods, assuming random loss to follow-up.
S ym bol M eaning
7c Probability of vertical transmission
N Num ber of children born to HIV-infected mothers
I Indicator variable denoting whether child is infected (1=1) or uninfected (1=0)
X Indicator variable denoting whether child died (X=1) or survived (X=0)
Estimated risk of mortality before age 15 months among children born to H IV-infected mothers
Mq Estimated risk of mortality before age 15 months among children born to H
IV-uninfected mothers
8 H IV prevalence at age 15 months among surviving children who were tested
serologically
Ng Denominator for the estimator 8
N, Of children born to HIV-infected mothers, number followed-up to age 15 months
Nq Of children born to HIV-uninfected mothers, number followed-up to age 15
months
The number of children who survive to age 15 months and are infected is estimated by N (1-M JS . The total number of children who die and are infected is estimated by NMiP(I=1 |X=1). Thus the transmission rate, k, is estimated by
( - .2)
From Bayes’ Theorem,
p/T-1 iY -1 ) - P (X =1)-P (X =1 |I=0)P (I=0)
which is estimated by
- M q(1 - 7c)
(1.3)
From an initial estimate of k, updated estimates are obtained by iterating between equations (1.3) and (1.2). However, a closed form solution exists, for at convergence.
7Ù = (1 -M J S + M, - Mq(1 -k) = (1 -M J S + + Mq(1 -TT)
Rearranging,
n = (1 —M . | ) S + M ^ - M j
W V L = 1 -(1 -S )
1 -M . 1 -M ,
An estimate of the variance of n is most easily derived via
log(1 -Ê) = lo g (l-S ) + lo g (l-M ^) - log(1 -IVIJ
Using the delta method and the simple estimate for the variance of a survivor function suggested by Peto (Cox and Oakes 1984, Section 4.3),
var[log(1 -A)] 8 (1 - S ) /N s M l (1 - M J / N i M o(1 - M J /N ^
(1
-sy
(1 -M ,): (1 -Mo)^Ml Mr
(1 -S)Ng (1 -M JN , (1 -M J N ,
It is then straightforward to calculate a confidence interval for log(1 -it) and thus for it .
The key assumption in the method is that the unobserved mortality of
effect on child mortality. Consequently, the excess mortality and thus the estimated transmission rate could be overestimated, although the extent of this
Table 1.1 Estimated transmission rates from studies using non-standard method of analysis
S tu d y E s tim ate d tra n s m is s io n rate
N ew m eth o d S tand ard m e th o d
European Collaborative Study (1991) 0.134 0.129
Connor et al. (1994)* 0.255 0.224
Tsai et al. (1994) 0.300 0.343
Table 1.2 Studies using AIDS surveillance data to estimate the paediatric AIDS incubation period
R eferen ce S o u rce of data N o. Of A ID S c as es
Auger et al. 1988 New York, 1979-1987 215
Com menges et al. 1992 Kigali (Rwanda), 1984-88 685
DeGruttola et al. 1992 New York, 1982-89 568
MaW hinney et al. 1994 New York, 1983-90 493
Figure 1.1 Probability of developing AIDS before age t months conditional on AIDS developing before age 72 months. Studies shown are Commenges et al. (solid line), MaWhinney et al. (dashed line), and Downs et al. (dotted line).
c
o
Ü c D
H—
c
o
4— » Z3n
4— ' CO
T3
.1 % 3
E
3 O0,8
0.6
0.4
0.2
0.0
0
12
24
36
48
60
72
CHAPTER 2. A NEW METHOD FOR ESTIMATING THE HIV VERTICAL
TRANSMISSION RATE AND PAEDIATRIC AIDS INCUBATION PERIOD
FROM PROSPECTIVE DATA
2.1 Outline of new method
Standard methods of analysis for prospective studies of children born to HIV- infected women were described in Section 1.3. It was shown that these methods may lead to biased estimates of the rate of vertical HIV transmission and the paediatric AIDS incubation period because of complications introduced by the difficulty in diagnosing HIV infection in young children. Alternative
methods based on modelling the disappearance of HIV antibody or appearance of virus are inefficient as they essentially rely on a single variable. In this chapter an alternative model, which takes into account clinical, immunological, and virological data, is developed.
The central feature of the new method is the estimation of the conditional probability of infection for every child in the study, given the observed data. This entails iterative and simultaneous estimation of the vertical transmission rate, the sensitivities of the virus tests, the AIDS incubation period, and the distribution function of antibody loss (taking account of interval censoring). All distributions are estimated non-parametrically and there is no need for an arbitrary threshold age at which antibody persistence is taken as proof of infection. By taking children of indeterminate infection status into account, the method avoids the biases that affect the standard estimators and should be more efficient.
2.2 Theory
2.2.1 The Model
Let n = probability of vertical transmission, T^ = age at AIDS diagnosis, and Tg = age when child first becomes seronegative. Although a continuous time model can be specified and estimated, a discrete formulation is more
the AIDS hazard at age t months given that the child is infected, and let h^ =
Pr(Ts=t I uninfected) be the probability density function of antibody loss at age t
months given that the child is uninfected. Let = 11(1 -g J
t-1 u=0
and H, = 1 -E h ^ denote the survivor functions for AIDS and antibody loss
u=0
respectively. Finally, up to V different types of virus tests may be applied with sensitivities s = [s^ Sg.... s j . The tests are assumed to be perfectly specific, so that a child is inferred to be infected on the basis of one or more positive tests. A further assumption is that all virus test results are independent, conditional on infection status.
It is supposed that each child in a cohort of size N can be classified into one of four mutually exclusive groups (Table 2.1), although in practice this may not be straightforward (see Section 2.6). children are observed to develop AIDS and the age at diagnosis is assumed to be accurate; Ng children become antibody negative (seronegative) at an unknown point between the last positive antibody test and the first negative antibody test; children have not
developed AIDS but are positive on one or more virus tests; the remaining children have not developed AIDS, are never positive on a virus test, and remain antibody positive. This last group will be referred to as censored, which it should be noted, does not mean the same as indeterminate infection status as defined in Section 1.2.
The problem can be considered as a mixture model with two states (infected and uninfected). A special feature of the data, analogous to the problem considered by Hosmer (1973), is that state membership is known for some observations. Children who develop AIDS or test virus positive are assumed to be infected, and children who become seronegative are assumed to be
Consider, for example, a censored child who has not developed AIDS by age a^, remains antibody positive at age 1^, and who has had, by virus test v, a total of y^v negative results (v=1.... V). If the child is infected he provides no
information about the antibody loss distribution H, and if he is uninfected he provides no information about the AIDS incubation period G or about the sensitivities of the virus tests s. His contribution to the likelihood function is thus the sum of two components. The first component is the product of the unconditional probability of being infected ju, and of the conditional probabilities of not developing AIDS 11(1 - g j and of always testing virus negative
V t=0
n (1 . The second component is the product of the unconditional
V=1
probability of not being infected (1-tc), and the conditional probability of
remaining antibody positive (1 - E h J . The contribution to the likelihood
t=0
function of children in the AIDS, VIR, and SERO groups are derived similarly:
G ro u p C o n trib u tio n to likeiih o o d
AIDS
7
C
9
a
.fl
(1 -g.) n-S
v
)''"'
t=0
v
=
1
SERO
(1 -Jt) È h,
1=Ik+1
VIR
11(1 -g,) n - s j ’'”
t=0
v
=
1
CENS
r i (1-9t) n (1
-S
v
)’'”
+t=0
v
=
1
t=0a,-1 V ■
E l°gW + l09(9a.) + 5:iog(1-g,) + E [x^log(sJ + y ^ jo g il-s j]
AIDS '=0 v=1
k
+
Y,
l°9(1 - 4 + log [ E hjSERO t=l,+1
k
+ E log(%) + êlo g(1 -g,) + E [X;^log(sJ + y^Jo g C I-sJ]
V IR t= 0 V=1
k
+ E l° 9 [ m f t(1 -g,) n (1 + (1 -%)(1 -È h , ]
CENS (=0 v=1 t=0
k (2.1)
subject to 0<7c<1, 0<s^<1, 0<g <1, 0<h <1, Eh,=1
2.2.2 identifiability
There is a potential identifiability problem when virus tests are not conducted.
Consider an alternative parameterisation (%, g‘, h*) defined by
7u*=C7T, G * = 1 - i l l ^ , H ’ = 1 - ( 1 -H )_ LiÎ - for t<max(L; GENS), otherwise = 1
C 1 -CTl
where c is an arbitrary positive constant such that the range conditions in
equation (2.1) are not violated. Noting that there is no VIR group in the
absence of virus test data, the individual contributions to the likelihood under
this parameterisation are:
AIDS: 7c‘ ( G , ;- G ,;i) = 7 T l( 1 - G ; j - (1 -G ()] = TTC
SERO: (1-7i-)(H ,:-H ') = - (1-H ,')]
1 1 -G ;
= (1 -T ic )
CENS: + (1 = ne 1 _ + (1 -ne)
c 1 - 1 -ne
The equivalence of the likelihood under the alternative parametehsations (tc, g,
h) and (n\ g*, h*) indicates a lack of identifiability in the model, and to obtain
unique maximum likelihood estimates it is necessary to constrain
either G or H . However, this is unnecessary if the oldest age at AIDS
diagnosis exceeds the oldest censoring age for AIDS i.e. if max(ak: AIDS) >
max(ak: CENS), since this removes the indeterminancy in the right tail of G .
Otherwise, it suffices to apply the mild constraint that all antibody loss in
uninfected children occurs by the oldest age at which an antibody test was
performed. This is a reasonable assumption provided at least one child has
been followed to at least age two years. If virus test data are available the
model is immediately identifiable provided at least one child is in the VIR group
or at least one child in the CENS group has had one or more (negative) virus
tests.
2.2.3 E stim a tio n
Dempster et al. (1977, Section 4.3) showed that finite mixture models can be
cast in the framework of an EM algorithm by introducing unobserved dummy
variables to represent state membership. In the E-step, the conditional
probabilities of belonging to each of the states are estimated for each
observation, given current parameter estimates. The contribution of each
observation to the complete-data log-likelihood is the weighted sum of the log-
likelihood associated with each of the states, with weights given by the
by maximisation of the complete-data log-likelihood. A FORTRAN 77 program
that implements the EM algorithm is given in Appendix 2.1.
E-step
The conditional probabilities of state membership are fixed (0 or 1) for children
in the AIDS, SERO, and VIR groups. For children in the CENS group, the
conditional probabilities of infection are, using Baye’s Theorem,
Tu =
» '5 . . . , n (1 - y ’ - • ( '- » > H i.,
V=1
The complete-data log-likelihood is identical to the observed-data log-
likelihood (equation 2.1) except that the contribution from the CENS group is
E îk [ lo g # + E lo g (1 -g ,) + E y ^ lo g (1 -s J ] + (1 - t j [ log(l-Tc) + lo g (1 -È h ,) ]
C E N S t=0 v=1 t=0
k
instead of
Y,
log[ % li(1-g,) n (1 -s /" + (1-m)(1-Èh, ]
C E N S *=0 v=1 t=0
k
M-step
The M-step consists of four parts:
(1) Re-estimate n by the ratio of the estimated number of infected children to
the total cohort size
% = (N* + Ny + E x j / N C E N S
k
= 0
3k K 1 “ 71 C E N S 1 - 7 t
(2) Re-estimate the components of s by the ratio of the number of positive test
results to the estimated total number of tests performed on infected children
Z + E X,kv
A ID S V IR
s = k k
V
E (Xkv+yJ + E (Xkv+Ykv) + E \Vkv
A ID S V IR C E N S
k k k
which is the solution of
= 5 2 ( — - — ) + - 12 1 — = 0
3s^ a i d s S y 1 - S y V IR S y 1 - S y C E N S 1 “ S y
k k k
(3) Re-estimate G by the product-limit method where the discrete hazards are
based upon the estimated number at risk of AIDS (estimated number
infected) at each age
E lOk't)
A ID Sg , =
E I(ak^‘) + E
+ E
A ID S V IR C E N S
k k k
which is the solution of
9Lc ^ I(a,=t) ^ I(a^t+1) ^ I(a,>t) ^ , I(a ^ t)
Sg, = EA ID S ^9 t - E A ID S - ^I “ 9 t f ^ -V IR E 1 “ 9 t ^ - C E N S E î k - V ^' “ 9 t
= 0
(4) There is no closed form solution for H but a standard algorithm for
estimating a distribution function from interval censored data (Turnbull 1976)
can be used. Although the original method assumed all observations have
equal weight, DeGruttola et al. (1992, Section 2) pointed out that unequal
weights are permissible. In this application, the weights are the current
conditional probabilities of being uninfected. The method iteratively re
allocates the weight associated with each child across all times when
antibody loss could have occurred, in proportion to the current estimates of
the probabilities of antibody loss for those intervals. Thus, the
estimate at iteration i+1 is obtained from the estimate at iteration
i by
^ E 4 ^ + E f - (2.3)
É hj') 1 - E h j')
u=l^+1 u=0
followed by re-scaling to ensure that Eh/'^^^=1
The estimation of H is itself an EM algorithm and when algorithms are
nested as here it is computationally inefficient to drive the inner algorithm to
convergence (Healy, discussant to Dempster et al. 1977). For data arising
from an exponential family where the M-step does not have a closed from
solution, it has been proved that convergence to a local maximum is
ensured with a single Newton-Raphson iteration in the M step (Rai and
Matthews 1993). Although this problem does not fall within this framework,
it was found empirically that convergence is achieved with one iteration of
2.2.4 Precision of estimates
Methods have been described for obtaining the variance-covariance matrix
when using the EM algorithm (Louis 1982, Meng and Rubin 1991). in this
application, however, partial double derivatives of the observed-data log-
likelihood can be evaluated directly (listed in Appendix 2.2.) It is necessary to
consider only the non-zero elements of g and h (Cox and Oakes 1984
[Section 4.2], Turnbull 1976). Work on coverage probabilities of confidence
intervals for the product-limit estimator suggests the use of a logarithmic scale
(Miller 1981, Section 6.1.4). The AIDS survivor function has therefore been
parameterised in terms of X,=log(1-g,). Then,
log G, =
u=0
t-1 t-1 t-1
var(logG j) = E va r(X J + 2 E E co\f{X^^,XJ)
u=0 u=0 v=u+1
Using the results and notation of Appendix 2.2, the observed information for n is
12
Na+Nv N<
(^-k)
^l1’2 " L (2.4)
From equation (2.2),
Tu = 7ÙTJ2
7ÙT1T2 + (1 -7C)T;
and equation (2.4) can be re-expressed as
k^ (1 -k) C E N S
k
7C(1-7C)
The last term of this expression indicates the extra information that is gained by
the extent to which the "posterior" estimate that the child is infected (t^) differs
from the "prior" probability of infection {k) . For censored children who receive
no virus tests and who are last observed before the earliest age at AIDS
diagnosis and earliest age at antibody loss, \ = k . Thus, it is immaterial
whether or not these children are retained in the analysis.
2.2.5 Covariates
There may be interest in assessing the effects of covariates on the model
parameters, particularly the vertical transmission risk and the AIDS incubation
period. For a discrete covariate it is straightforward to introduce category-
specific parameters in the relevant steps of the algorithm. For the transmission
risk or sensitivities of the virus tests, the significance of the covariate can be
assessed by a likelihood ratio test.
A natural way to assess significance with respect to the AIDS incubation period
is by the E (E -0 )^/E variant of the log-rank test (Peto and Peto 1972), using
the estimated numbers at risk of AIDS (under the null model). This procedure
will be somewhat under-conservative as it does not take into account
uncertainty in the estimated numbers at risk. For right-censored data, the log-
rank test can be derived as a score test under the proportional hazards model
(Breslow 1975). However, in this application it is not possible to regard the
underlying hazard as a nuisance distribution which can be conditioned out
because of the contribution to the likelihood of the censored children.
Finkelstein (1986) developed a proportional hazards model for interval censored
data and this could be considered for the antibody loss distribution. It would not
be straightforward to modify the EM algorithm to accommodate this model and
direct numerical maximisation of the likelihood function might need to be
model for right censored data, is the need to estimate the baseline distribution.
This could affect the stability of the estimates of the effects of the covariates,
particularly if age was recorded on a fine scale.
2.3 Example
2.3.1 Description of study
Since 1985, paediatricians in 10 centres participating in the European
Collaborative Study have prospectively reported data on children born to
mothers known to be HIV-infected at the time of delivery (European
Collaborative Study, 1994). In principle, children are examined clinically and
tested for HIV antibody every 3 months until 2 years of age and every 6 months
thereafter. Virus tests are encouraged whenever an adequate sample is
available, provided laboratory expertise and facilities exist. This analysis utilises
the results of PCR and virus culture assays performed after the first month of
life; the age restriction is applied to allow for the rapid rise in sensitivity after
birth (McIntosh et al. 1994, Dunn et al. 1995). The study has consistently used
the 1987 Centres for Disease Control pediatric AIDS definition (Centres for
Disease Control 1987b) with two exceptions: it excludes children with
asymptomatic lymphoid interstitial pneumonitis diagnosed by X-ray and includes
children considered to have died as a consequence of HIV infection without
fulfilling the precise AIDS case definition.
A total of 1055 children had been recruited by the date of analysis. To avoid
problems of non-independence, 78 second-born twins or children with an older
sibling in the study were excluded, leaving 977 subjects for analysis.
Alternatively, these data could have been retained by including a random
maternal effect in the model, but this would have complicated the analysis
considerably. 41 children had developed AIDS (range 2-74 months). 639
observed at 2 months, and the latest positive test at 21 months. Ignoring tests
performed on the seronegative children, there was a total of 591 virus cultures
and 229 PCR assays. One or more positive virus test results were observed for
68 children who had not developed AIDS. The remaining 229 children were
classified in the GENS group. A full listing of the data is given in Appendix 2.3.
The new method requires that each child is classified into one of the groups in
Table 2.1, but in practice inconsistencies arise, even after eliminating obvious
laboratory errors. In these data 5 apparently infected children were transiently
HIV antibody negative, 2 children lost HIV antibody after developing AIDS, and
13 children had one or more positive virus tests despite becoming consistently
antibody negative. Similar inconsistencies have been observed in other studies
and explanations put forward (Simpson and Andiman 1994, Bryson 1995).
To resolve these inconsistencies the following hierarchical rule was applied:
(1) if a child develops AIDS then classify in the AIDS group
(2) otherwise, if the last antibody test is negative then classify in the SERO
group
(3) otherwise, if any virus test is positive then classify in the VIR group
(4) otherwise, classify in the GENS group.
Giving precedence to AIDS diagnoses over laboratory findings is consistent with
the standard classification of HIV infection (Gentres for Disease Gontrol 1987a)
and serological tests are at present judged more reliable than virological tests.
This hierarchy could be re-ordered without changing the general form of the
likelihood. However, in studies in which the number of inconsistencies is small,
such as the European Gollaborative Study, results will not be sensitive to the
2.3.2 Application of new method
The EM algorithm yielded maximum likelihood (ML) estimates of 0.153 (SB
0.012) for the vertical transmission rate, 0.768 (SB 0.022) for sensitivity of viral
culture, and 0.920 (SB 0.029) for sensitivity of PCR. Figure 2.1 shows the
estimated survivor functions for antibody loss and AIDS up to age 24 months.
Figure 2.2 extends the AIDS survivor function up to age 48 months and
indicates the precision of pointwise estimates. Strictly speaking, these
distributions should be represented as step functions, but for clarity the age-
specific estimates have been connected with straight lines. An estimated 0.150
(90% 01 0.097-0.199) of infected children are diagnosed with AIDS by age 6
months with a fairly constant hazard thereafter (approximately 0.08 per year).
The median duration of antibody persistence among uninfected children is 11
months, with all children losing antibody by 22 months of age.
Figure 2.1 also shows the conditional probability of infection for a child who is
antibody positive, has not developed AIDS, and for whom no virus test results
are available. This function remains relatively flat until 10-11 months of age
before rising rapidly. The data rule as infected all children who test antibody
positive after 22 months. From equation (2.2) the conditional odds of infection
is
7C G V
(1
H
, +1v
=
i
Thus the effect of each negative virus test result is to scale the odds of infection
by (1-sensitivity); that is, by 0.232 for a negative virus culture result and by
2.3.3 Comparison with standard estimator
In drawing comparisons with the standard estimator described in Section 1.3,
different critical ages at which antibody persistence is regarded as proof of
infection were examined (Table 2.2). The usual convention of excluding
children born less than 15, 18, 21, or 24 months before the date of analysis was
applied, although their inclusion made little difference to the results (Dunn and
Ades, 1996).
Considering first an analysis based solely on AIDS diagnoses and antibody test
results (i.e. excluding virus test results), the crude estimates of the vertical
transmission rate are lower than the ML estimate of 0.150, the difference being
more pronounced the older the critical age. The reason for this is that the
crude estimator ignores children of indeterminate infection status, who as they
become older, are more and more likely to be infected (Figure 2.1). However,
this can be compensated for by choosing a critical age that is too early, thereby
including as infected a number of children who will eventually lose antibody. It
would be difficult to justify, however, the use of a 15 months or 18 months
threshold, as maternal antibody was detected after these ages.
Conversely, the crude estimates of the AIDS survivor function are too low
(progression rate too high) because the number of children at risk of the event
have been underestimated. The degree of bias can be substantial. For
example, the standard estimate of the AIDS survivor function using an 18
months threshold is approximately 8% lower (relatively) than the maximum
likelihood estimate (Figure 2.3).
As the standard method of analysis takes account of positive virus test results
but ignores negative results, the inclusion of virus test data must increase
progression to AIDS. However, the estimates of the transmission rate are now
too high and the rate of progression to AIDS is still overestimated, although the
bias in the latter is now less severe.
The small differences between the crude and maximum likelihood estimators of
the vertical transmission rate is due to the fact that the infection status of a
large majority of the enrolled children has been established, the study having
begun over 10 years ago. The gain in efficiency of the new method would be
greater in studies of shorter duration, including randomised controlled trials of
interventions to reduce vertical transmission.
2.3.4 Effect of calendar period
The analyses in Section 2.3.2 assumed that all parameters remained constant
over the duration of the study. Using the methods described in Section 2.2.5,
the 415 children born between 1985-88 were compared with the 562 children
born between 1989-94 with respect to the rate of vertical transmission and the
AIDS incubation period (Table 2.3).
Under the assumption of a stationary incubation period, the estimated
transmission rate was 0.122 for 1985-88 and 0.177 for 1989-94. On the basis
of a likelihood ratio test, this difference is marginally significant (%^=4.92,
P=0.03). Figure 2.4 compares the AIDS incubation periods between the two
cohorts, under the assumption of period-specific transmission rates. This
appears to indicate that rapid progression to AIDS was more common in the
earlier period but that the hazard rates at older ages are fairly similar. An
overall comparison provides moderate evidence of a difference between the
AIDS incubation periods (log-rank %^=2.85, P=0.09). A more significant result is
obtained by restricting the comparison to the first 6 months of life (log-rank
cautiously. Allowing period-specific AIDS incubation periods made little
difference to the estimated transmission rates.
2.4 Conclusions
2.4.1 Discussion of findings and comparison with other studies
Among the large prospective studies, the European Collaborative Study has
been notable for its low rate of vertical transmission. The analysis provides
evidence of a rise in the rate in recent years, which is now close to estimates
from other cohorts in Europe and the United States, although still lower than
figures reported from Africa (Working Group on Mother-to-Child Transmission of
HIV, 1995). As the risk of vertical transmission depends on the degree of
maternal immune suppression (European Collaborative Study 1996) and as
there is evidence for a secular decline in average maternal CD4 count (Thorne
et al. 1995), the increase in the transmission rate is not unexpected. However,
Ades (1995) showed that the maternal CD4 count distribution will eventually
stabilise if the incidence of new infections remains constant. It is noted that our
results derive from data obtained on women with a recognised HIV infection
from selected centres, and do not necessarily generalise to all infected women
in Europe.
Even in the largest cohort studies, an insufficient number of children have been
observed to progress to AIDS to allow reliable characterisation of the incubation
period. Although comparatively precise estimates have been derived for the
shape of the distribution using data from AIDS surveillance systems, these data
have a number of limitations (DeGruttola 1992). Among these are periodic
revisions in the pediatric AIDS case definition, and comparisons between
studies must take account of differences in definitions. Of the 41 AIDS cases
according to the criteria used in European Collaborative Study, 3 died before
presumably would not have been notified. Conversely, our analysis excluded
children with asymptomatic lymphoid interstitial pneumonitis (LIP) which is
AIDS-defining. LIP was responsible for 26% of initial pediatric AIDS-defining
diagnoses in the United Kingdom up to April 1995 (Fiona Holland, personal
communication). In a recent paediatric HIV classification system (Centers for
Disease Control and Prevention 1994) LIP is no longer considered a "severe"
(category C) clinical manifestation.
The finding of an inflexion point around 6 months of age in the AIDS hazard
rate is consistent with other reports (Figure 1.1), although this effect was less
striking among children born later in the study. The secular fall in early AIDS
incidence is mirrored in mortality rates (data not shown), apparently ruling out a
diagnostic artifact. A possible explanation for this observation is an
improvement in the clinical management of young infants with proven or
suspected HIV infection. Life expectancy, for adults with a CD4 count below
350 cells/mm^, improved between 1985-88 and 1989-93 in the Multicenter AIDS
Cohort Study, and was attributed to the use of antiretroviral and prophylactic
therapy (Enger et al. 1996).
Analyses of AIDS surveillance data have generally assumed that the incubation
period is stationary. Our analysis points to a need for critical examination of
this assumption, although with retrospective data it is only possible to compare
incubation periods conditional on developing AIDS by a given age (DeGruttola