581
A Hybrid Solution For Efficient Utilization Of
Energy In Wireless Sensor Networks
Venkataramanan C, Suresh J
Abstract: one of the optimum solutions for reducing the energy utilization in the wireless sensor networks (WSNs) is data aggregation. In the phase of data aggregation the nodes in the application area observe the environment and convey the sensed data to the central coordinator or cluster head (CH) for aggregation. Afterwards the CH transmits the information to sink directly or via other CHs. Instead of sending the information from all member nodes, in this paper limited nodes (i.e. based on the time slot information received from the CH) from the group are allowed to send the information to the aggregator. According to this approach the overall energy spends by the group is greatly minimized and balanced among them. The scheduling of time slots reduces the collision among the nodes. The dynamic transmission power adjustment implies reduced energy utilization. The outcomes of this proposed, Combined Approach for Time slot and Transmission power adjustment (CATT) clears that, it yields better results compared to the existing strategies.
Key Words: Clustering, Cluster Head, delay, energy utilization, Minimum power transmission, Time slot allocation, Scheduling, WSNs.
————————————————————
1.
INTRODUCTION
WSN‘s are composed group of sensor devices with a sink for analyzing the various environmental data. The nodes in the group are generally tiny resource constrained devices i.e. limited memory and power. The primary responsibility of these tiny nodes is continuously monitor the area of interest according to the protocol design and forwards the gathered data to the sink. The batteries of the sensor nodes are limited one and it is difficult to replace or recharge. During the while a sensor node runs out of its power, the network may get partitioned and the coverage of application area is lost. The nodes in the application environment are capable of self configuring together and processing the information data [7]. In general the nodes in the network are act as source, sink and router for communicating the information. The information transfers in WSNs are accomplished by means of single hop or multi-hop communication. If the distance between the source and destination is minimum then single hop communication is preferred and vice versa. The different applications of WSNs are includes border surveillance to smart home monitoring. The major source of energy waste includes idle listening, overhearing and collision. To address the energy consumption due to idle listening, adaptive/non adaptive duty cycling schemes are introduced. Various transmission power adjustment and collision free protocols are addressed the above said issues. The information collected by the nodes in the area of interest is converted to an aggregated [1] form according to the application request, for example averaging the temperature and humidity. The process of data aggregation involves the combination of observed data from different nodes at intermediate level and conveys the aggregated information to the sink. Since the nodes in the observation field generates certain amount of redundant data in order for ensure the accuracy.
To reduce the redundant data transmissions the generated data from different sources can be aggregated and it is done by suitable data aggregation algorithms. The cluster head/central coordinator or any intermediate node is allocated to collect the information from other nodes and do the aggregation operation [6][10]. The major source of energy waste includes idle listening, overhearing and collision. To address the energy consumption due to idle listening, adaptive/non adaptive duty cycling schemes are introduced. Various transmission power adjustment and collision free protocols are addressed the above said issues [9]. The information collected by the nodes in the area of interest is converted to an aggregated form according to the application request, for example averaging the temperature and humidity. The process of data aggregation involves the combination of observed data from different nodes at intermediate level and conveys the aggregated information to the sink. Since the nodes in the observation field generates certain amount of redundant data in order for ensure the accuracy. To reduce the redundant data transmissions the generated data from different sources can be aggregated and it is done by suitable data aggregation algorithms. The cluster head/central coordinator or any intermediate node is allocated to collect the information from other nodes and do the aggregation operation.
2.
RELATED WORKSIn WSNs the in network processing i.e. data aggregation plays a vital role for reducing the unnecessary transmissions. It leads redundancy minimization; reduced collision and enhancing the life time of WSNs. Authors [2] of this paper details the report of Elliptic Curve ElGamal homomorphic encryption algorithm and clearly noted that performance when the mapping function during the process of decryption. In this paper authors suggested the Okamoto-Uchiyama homomorphic encryption algorithm to care for end-to-end information privacy. Further the efficiency and practicability of this approach validated using Tmote Sky and iMote 2 network platforms. They proven that the proposed one utilizes lesser energy with better performance compared to the previous schemes. Authors of the paper [3] put forwarded data gathering approach in WSNs using prediction models. It devoid the superfluous information transmissions and minimizes the data _______________________________
Dr.C.Venkataramanan is currently Working as a Associate Professor in Electronics and Communication Engineering in Shree Vidyanikethan Engineering College, Tirupathi, Andra Pradesh-517102,India,E-mail: [email protected]
transmission cost. Due to that, the energy required by the nodes is greatly reduced. In order for enhancing the energy efficiency the cluster head nodes in the given area rotated timely. Authors [4] of the paper much concentrated on data aggregation in wireless senor networks. This paper analyses the false data insertion by the nodes along with dissimilar kinds of attacks. In this approach authors suggested the end to end privacy, which detects the attacks earlier by verifying in each and every hop. It reduces the loading effect of sink node. The same implemented on MicaZ and TelosB mote and the outcomes are validated experimentally and simulation. Authors [5] of the paper mainly concerned about the energy consumption in the wireless sensor networks. They developed a cluster based routing protocol intra-balanced LEACH (IBLEACH), which is a extended version of LEACH protocol. In this work they effectively balance the energy utilization of the nodes in the cluster by implementing IBLEACH. The outcomes of this approach evaluated by means of lifetime and energy consumption and the same compared with the existing schemes.
3.
COMBINED APPROACH FOR TIME SLOT AND TRANSMISSION POWER ADJUSTMENT (CATT) In CATT, it is assumed that the entire application area divided into several clusters. Each cluster in the region contains cluster head and its associated members. The role of cluster head is to collect the information from its members and duly process the data. The processed information is then sent to the sink as per figure 1. During the cluster formation the time slots are prepared by the cluster head and the same information shared with the cluster members and it is clearly illustrated in figure 2.All the members send the data to CH
Fig. 1. Data flow of in sensor networks.
Fig. 2. time slot allocation to members.
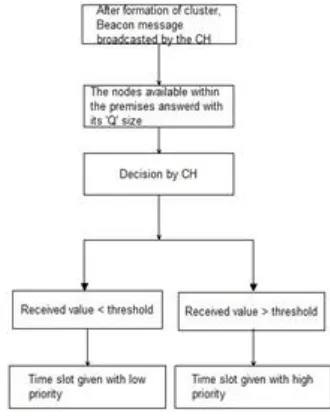
The time slot allocating or the scheduling mechanism carefully implemented by the CH of respective clusters. The process of allocating the time slot information to the members is based on the no. of packets in the queue. The time slot priority will be given based on the size of queue (i.e. high priority when the size of queue and vice versa). By the way only less numbers of nodes only activated for handling traffic out of the given nodes. The priority may be calculated by comparing the received queue size ( Q )
with the predefined queue threshold (Q .). The predefined
value of threshold for the given model can be computed by eq. (1),
Q = (1)
Where Q is the default queue size defined by the
application. It is assumed that minimum 50% of the queue size taken as predefined value for this model. The procedure clearly illustrated in the flow chart figure 3, after cluster formation the beacon message broadcasted by the CH. The members received the beacon replies with a message along with the queue size. Now the CH clearly knows the status of its members. According to the status of the queue size, the time slot will be allocated to the cluster members by the CH. If the received queue size less than the threshold value it means that that particular node has less amount of data and higher sized nodes are having more data to be sent. Hence priority will be given based on the queue sizes.
Figure 3. Flow diagram for slot priority
Whenever the event to be noticed the nodes in the respective cluster send their information in its corresponding time slots according to the information received. While transmitting the information to the CH it is required to notice the current traffic carried, and based on the traffic the data rate of the members are varied. The traffic carried by the CH used to adjust the data rate of the intended nodes for communication. Let be the amount of traffic processed by the CH and be the maximum
traffic allowed to the CH. The current traffic carried by the CH ( will be calculated by eq. (2),
=
583 If = then the data rate of the individual nodes will be
computed by eq.(3),
= (3)
Where, be the default data rate defined by the
application & be the nodes expected data rate and ‗ ‘
be the variable used to increase the level of data rate. The respective distance between any two entities in the wireless medium can be calculated by using the most common method Friis transmission formula as per eq.(4). The Friis transmission equation uses the reception power (RSSI: received signal strength indicator) for calculating the distance between the two points.
( = (4)
Where, is the received power, D is the distance between the two entities, be the transmitted signal power, be the gain of transmitter, is the gain of receiver, be the Path loss, is the height of transmitting element and is the height of receiving element. Once the distance between the respective CH‘s and the Sink is found using the equation (4) then the minimum power required for transmitting the intended information can adaptively chosen by using the eq. (5). While configuring the clusters the role of CH‘s is to inform their members regarding the cluster and its scheduling procedures and the same required to notice to the sink. The control overheads are generally used initially for ensuring the link status between any two nodes in the case of wireless environment. During the handshaking the received power may be found by the respective CH‘s and the same will used for computing the minimum required transmission power. Let be the
minimum required transmission power for convey the information form CH to sink and be the power
transmitted by the sink, be the reception power
calculated by the CH and the receiver sensitivity be the
[Sivanesan].
=
(5)
The initial energy assigned to the node while starting the simulation be and the balance energy after the node‘s
respective working cycle be and the energy utilized by
the devices is . The relation used to calculate the
remaining battery energy (eq.6) of the nodes is given by, = - (6)
Each round the CH may be changed for balancing the energy utilization and it is composed of transmission power and reception power of data packets, power for control overheads, state changing mechanisms and so on. For argument, simply the energy utilization ( will be
calculated by eq. (7)
= (7)
The overall energy spent by the nodes in the given area will be calculated by eq. (8)
∑ (8)
Where, be the number of nodes in the given area and i=1 to n.
4.
RESULTS AND DISCUSSION
:
The proposed scheme implemented with the open source network simulator NS-2. The results of the approach evaluated in terms of varying data rate and number of nodes in the given area. In each section the performance
indicators of the network like packets delivery ratio (PDR), throughput, delay and energy utilization are observed.
Figure 4. Data Rate Vs Characteristics of PDR
Figure 5. Data Rate Vs Characteristics of Throughput
The fig. 4 & 5 clearly illustrates the characteristics of PDR and Throughput of the three different schemes. While varying the data rate PDR of all the schemes are increased linearly. When compared to other two schemes such as without aggregation and LEACH the proposed approach provides higher packets delivery ratio. Since, it uses the time slot allocation to reduce the collisions among the nodes in the given area. The throughput curve show that it increases linearly with respect to the varying data rate. It is clears that, when compared to others the proposed system offers higher throughput.
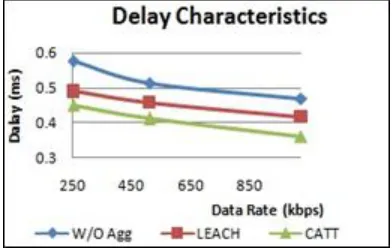
Figure 7. Data Rate Vs Characteristics of Delay
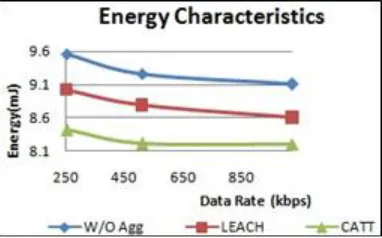
The fig. 6 & 7 clearly show that the characteristics of Energy utilization and Delay of the three different approaches. When increasing the data rate the energy utilization of the proposed approach reduces noticeably. Since, the CATT uses the dynamic power transmission for conveying the information to sink. The data from the members reached to the CH with reduced collision and priority based time slot allocation. The aggregation avoids the individual transmission and the scheduling reduces the retransmission of data packets which reduces the delay considerably. Hence the delay of the proposed scheme minimized when compared to other approaches.
Figure 8. No. of Nodes Vs Characteristics of PDR
Figure 9. No. of Nodes Vs Characteristics of Throughput
The fig. 8 & 9 illustrated the characteristics of PDR and Throughput of the three different schemes varying with the no. of nodes in the given area. The PDR of proposed scheme increased linearly when compared to other two schemes such as without aggregation and LEACH. If the no. of nodes increased the data generation rate also
increases. But, the CATT uses the priority based time slot allocation to handle the transmissions among the nodes in the given area. It implies the higher throughput with respect to varying no. of nodes.
Figure 10. No. of Nodes Vs Characteristics of Energy
utilization
Figure 11. No. of Nodes Vs Characteristics of Delay
The fig. 10 & 11 shows the characteristics of Energy utilization and Delay of all the approaches taken for consideration. When increasing the no. of nodes the energy utilization of the proposed approach reduces noticeably compared to other schemes. The graph clearly shows that all the approaches experiences increasing in energy utilization since, the data generation rate increases when the no. of nodes is increased. The CATT uses the minimum power transmission for transferring the data to sink and the priority based time slot allocation helps to reduce the energy utilization when compared to the remaining approaches. The combined process of minimum power transmission as well as aggregation reduces the packets drop during the transmission which reduces the delay considerably.
5.
CONCLUSION:
585
R
EFERENCES:
[1] Esmaeil Rezaei and Safieh Ghasemi, ―Energy-Aware Data Aggregation in Wireless Sensor Networks Using Particle Swarm Optimization Algorithm‖, American Journal of Information Science and Computer Engineering, vol. 4, no. 1, pp. 1-6, 2018.
[2] Jie Cui, Lili Shao, Hong Zhong, Yan Xu and Lu Liu, ―Data aggregation with end-to-end confidentiality and integrity for large-scale wireless sensor networks,‖ Peer-to-peer Networking and Applications, Springer, Jan 2017, pp. 1-16. [3] AdwitiyaSinha and D. K. Lobiyal, ―Prediction Models for
Energy Efficient Data Aggregation in Wireless Sensor Network‖, Wireless Personal Communications, Sprin vbger, May 2015, pp. 1-19.
[4] Omar RafikMeradBoudia, Sidi Mohammed Senouci and Mohammed Feham, ―Secure and efficient verification for data aggregation in wireless sensor networks‖, International Journal of Network Management, Aug 2017, pp. 1-17. [5] Ahmed Salim, WalidOsamy and Ahmed M. Khedr,
―IBLEACH: intra-balanced LEACH protocol for wireless sensor Networks‖, Wireless Networks, Springer, Jan 2014, pp. 1515-1525.
[6] IllsooSohn, Jong-Ho Lee, and Sang Hyun Lee, ―Low-Energy Adaptive Clustering Hierarchy Using Affinity Propagation for Wireless Sensor Networks‖, IEEE Communications Letters, vol. 20, no. 3, March 2016, pp.1-5. [7] Zhu, N., and Vasilakos, A. V, ―A generic framework for energy evaluation on wireless sensor networks‖, Wireless Networks, vol. 22, no. 4, pp. 1199–1220.
[8] Sivanesan P, thangavel S, ―An Enhanced Transmission Power Controlled MAC Protocol for Ad Hoc networks‖,―International Journal on Computer Science and Engineering‖, vol. 3, no. 8, August 2011, pp. 3304-3312 [9]. Venkataramanan C and Girirajkumar SM, ―Markov Fuzzy
based Mac Protocol for life time maximization of Wireless Sensor Network‖, International Journal of Computers and Applications, vol. 36, no.4, 2014, pp. 1-7.
[10]. Martin Haenggi, ―On Distances in Uniformly Random Networks‖, IEEE Transactions on Information Theory, vol. 51, no. 10, October 2005, pp. 3584-3586.