International Journal in Management and Social Science (Impact Factor- 4.358)
THE IMPACT OF EXTERNAL SHOCKS ON THE ALGERIAN EXPORT PERFORMANCE
Nadjat Lakhdari1, Abbassia Rechache2 and Kamel Si Mohammed3
1, 3
Department of Economics and Management, Belhadj Bouchaib University-Ain Temouchent, Ain Temouchent, Algeria
2
Department of Economics and Management, Djilali Liabes University-Sidi Bel Abbes, Sidi Bel Abbes, Algeria
Abstract
The goal of this study is to measure the effect of the External Shocks on the Algerian export performance through an empirical analysis by applying the Vector Error Correction Model VECM. Using quarterly for the period (2002-2013), main results of this study shows that the external shocks (GDP world, euro-dollar exchange rates, oil prices, financial crisis variable) affected on the Algerian exports performance. Test cointegration result establish that there is a relationship between variables estimating in short and long term and Granger causality tests made it clear that two directional flow, at 5% significance level for oil prices and financial crisis to Algerian exports.
.
Keywords: Financial crisis, Algerian exports, oil, exchange rate, VECM Model.
I. Introduction
Oil and gas play important role of the Algeria economy, while dominant about 97% of Algerian exports and 45 percent of GDP and 46 to 70 percent of government revenue and present more than 60% trade openness. Indeed, the choose flexible exchange rate system since 1996 after the long experience with the former regime (1974-1995) was built a strong concentration of US dollar. In this situation any external shock can be unbalanced the structure of the Algerian economy. The goal of this study is to examine the impact of GDP world, euro-dollar exchange rates, oil prices, as explanatory variables on the Algerian exports using VECM Model (Vector Error Correction Model) on quarterly data over the years (2002-2013). We present the Research Methodology in section
two, following by the results and discussions in
Section Three, and finally the main conclusion.
Hypothesis
First hypothesis: GDP World and oil prices
coefficients indicate an impact on the Algerian exports in the period of (2002-2013).
Second hypothesis stating a positive response of Algerian exports performance to euro-dollar exchange rates.
Third hypothesis: financial crisis is play important role to explain exports variation in short and long term.
II. Research Methodology
Revue Literature: Many early and recent studies highlighted the impact of oil supply shocks on economics countries. Some papers have been
found impact as recession, slower GDP growth and other consequences effects like unemployment
rates, inflation, Stock market … Hamilton (19831,
19962, 20033, 20094 ,20135), Santini (1985)6, Lee
et al. (1995)7, Rasche and Tatom (1977)8, Abel and
Bernanke, (2001)9, Brown and Yücel (2000)10,
Zhong Xiang Zhang (2010)11,Chen (2010)12, Elder
and Serletis (2010)13, Basher and al. (2012)14.
Some others found a positive effect like Bjørland
(2007)15, Eltony (2001)16, Husain, Tazhibayeva,
Ter-Martirosyan (2008)17, Omar Mendoza and
David Vera (2010)18, Yudong Wang, Jung and Park
(2011)19.
Both empirical and theories generation
investigations interest the effect of exchange rate
on trade flows, Clark (1973)20; Hooper and
Kohlhagen (1978)21, Cushman (198322, 198623),
Bailey et al. (198824, 198725 ), McKenzie (1998) 26
and Doyle (2001)27.
Franck Cachia (2008)28 concluded that there is
negative impact of depreciation Euro Against other currencies on economy of France over the period 2002-2008.
Serge REY (2011)29 estimated the period from 1971
to 2010 to compare the German exports with French exports and find the first is more responsive to external demand and less sensitive to changes in
exchange rates Euro. Baak (2008)30 assessed the
impact of the real exchange rate between the Yuan an US dollar for the period from 1986Q1 to 2006Q2. He used cointegrating vectors and error correction models to arrive that the depreciation of %1 of the Renminbi raises the Chinese exports to the USA by1.7%, while 1% depreciation of the US dollar raise the US exports to China by 0.4%.
Sulaiman Mohammad (2010)31examined the effect
level, and money supply). He applied VAR based approaches to find no significant impact of Euro and US dollar exchange.
Data source: In our analysis, we make use of four macroeconomic variables: Algerian exports (exp), oil price (oil) and Euro-US dollar exchange rates (Euro-US Dollar), GDP world. The sample comprised quarterly observations for the 2002: Q1- 2013: Q12 period. The sources of the data are collect from International financial Statistics different issues, IMF and world development indicator.
Econometric approach The mathematical
representation of a model is:
logexp= a0+ a1lgdpw+ a2loil+ a3logeuus+a4fcri+εt
Where:
logexp = logarithm of the Algeria’s exports loggdpw = logarithm world GDP
logoil= logarithm of oil price
logeuus= logarithm of us dollar-Dinar Algeria fcris=financial crisis : dummy variable (1= period of global financial crisis, 0= period beforefinancial crises).
a0= Intercept of the function
εt = Random error
a0, a1, a2, a3, a4are parameter estimates.
III. Results and discussion:
Before illustrating VECM result, we shall be starting by following the steps econometric:
1/ Test the stationary by Augmented Dickey-Fuller& Philips and Perron.
2/ Analysis co-integration tests (Granger, 1987) 33
3/ Causality test.
4/ The Impulse responses and the variance decomposition analysis
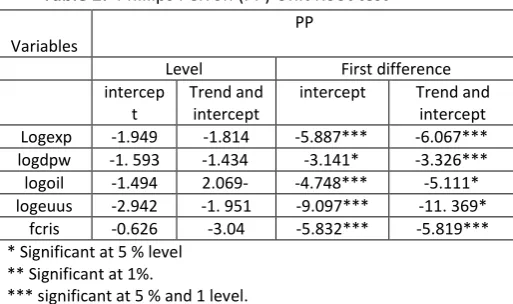
Stationarity and Cointegration tests: Augmented
Dickey-Fuller (1979)33 and Philips and
Perron,(1988) 34 tests can be avoid false results
cases and test stationary of times series. Tables
(2) and (3) present tests drawn from the stationary using ADF and PP which allow a rejection of the null hypothesis in the first difference that signifies that the t-statistics is more than the critical values suggesting stationary in I(1).
Table 1: Augmented Dickey Fuller (ADF) Unit Root
test
*show values are significant at 5 % level with MacKinnon (1996).
**show values are significant at 1% level with MacKinnon (1996).
***show values are significant at 5 % and 1 level with MacKinnon (1996).
Table 2: Phiilips Perron (PP) Unit Root test
Variables
PP
Level First difference
intercep t
Trend and intercept
intercept Trend and intercept
Logexp -1.949 -1.814 -5.887*** -6.067***
logdpw -1. 593 -1.434 -3.141* -3.326***
logoil -1.494 2.069- -4.748*** -5.111*
logeuus -2.942 -1. 951 -9.097*** -11. 369*
fcris -0.626 -3.04 -5.832*** -5.819***
* Significant at 5 % level ** Significant at 1%.
*** significant at 5 % and 1 level.
Analysis co-integration: Johansen develops two tests: Trace statistics ((λ trace) and maximum eigen statistic (λ max). The result of trace tests and Max-eigenvalue indicate two cointegrating at the 0.05 level (Table 3, 4).
Table 3: Trace test
Hypothesized
No. of CE(s) Eigenvalue Prob.**
None * 0.681348 0.0002
At most 1 * 0.497095 0.0423
At most 2 0.130402 0.5715
At most 3 0.065461 0.1292
Trace test indicates 2 cointegrating eqn(s) at the 0.05 level
**MacKinnon-Haug-Michelis (1999) p-values
Table 4: Max-eigenvalue test
Variables ADF
Level First difference
intercep t
Trend and intercept
intercept Trend and intercept Logexp -1.949 -1.803 -5.887*** -6.036*** logdpw -2.339 -1.413 -5.656*** -4.983***
logoil -1.579 -2.76 -2.99* -5.10***
International Journal in Management and Social Science (Impact Factor- 4.358)
Unrestricted Cointegration Rank Test (Maximum Eigenvalue)
Hypothesized
No. of CE(s) Eigenvalue Prob.**
None * 0.755157 0.0006
At most 1 * 0.561350 0.0440
At most 2 0.337430 0.3654
At most 3 0.144045 0.7051
At most 4 0.040304 0.2369
Max-eigenvalue test indicates 2 cointegrating eqn(s) at the 0.05 level
**MacKinnon-Haug-Michelis (1999) p-values
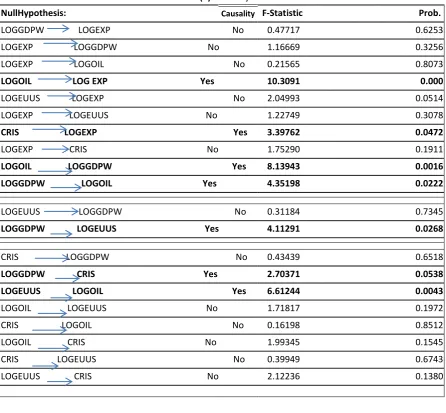
The Causality: Granger causality test
suggest a many directional flows, at 5% significance level, for oil prices and financial crisis to Algeria’s exports, (see table 5),In addition, Granger causality test suggest a most relationship between variables the study as the directional flow
for euro-us dollar exchange rates to oil prices, relationship bi-directional between oil prices and GDP world.
Table (5) Causality test
NullHypothesis: Causality F-Statistic Prob.
LOGGDPW LOGEXP No 0.47717 0.6253
LOGEXP LOGGDPW No 1.16669 0.3256
LOGEXP LOGOIL No 0.21565 0.8073
LOGOIL LOG EXP Yes 10.3091 0.000
LOGEUUS LOGEXP No 2.04993 0.0514
LOGEXP LOGEUUS No 1.22749 0.3078
CRIS LOGEXP Yes 3.39762 0.0472
LOGEXP CRIS No 1.75290 0.1911
LOGOIL LOGGDPW Yes 8.13943 0.0016
LOGGDPW LOGOIL Yes 4.35198 0.0222
LOGEUUS LOGGDPW No 0.31184 0.7345
LOGGDPW LOGEUUS Yes 4.11291 0.0268
CRIS LOGGDPW No 0.43439 0.6518
LOGGDPW CRIS Yes 2.70371 0.0538
LOGEUUS LOGOIL Yes 6.61244 0.0043
LOGOIL LOGEUUS No 1.71817 0.1972
CRIS LOGOIL No 0.16198 0.8512
LOGOIL CRIS No 1.99345 0.1545
CRIS LOGEUUS No 0.39949 0.6743
Vector Error Correction Model (VECM)
After we find cointegration relations between variables in this study, we must to build Vector Error Correction Model (VECM) of Engle and Granger
(1987)35 for restrict the long-run behavior of the
endogenous variables to converge to their
cointegrating relationships while allowing for short-run adjustment dynamics.
Our results established the long-run equilibrium relationship between Variables study, the short-run adjustments are estimated using the error correction
model (ECM).The deviation from long-run equilibrium
is corrected very slow adjustment speed about 0.14% every quarterly (one year and three months).
Table 6: the speed of adjustment of VECM
the speed of adjustment
coefficient
R2 Durbin-Watson
stat
0.014 0.958 2.108
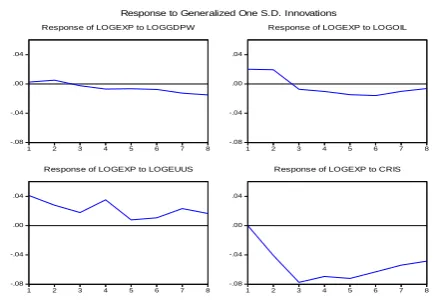
The Impulse responses
The impulse responses present the dynamic responses of the exogenous variables in relation to the time of variation of the endogenous variable. It shows the responses of the exportto a one standard deviation of GDP world, exchange rate, oil prices and financial prices variables (figure 3).
A one-standard deviation shock of financial crisis causes Algeria exports to decrease about 3 a standard deviation over four first period and about 5 to 7a standard deviation in four years later.
We also note that after the 3, 4 periods, Algeria’s exports have negative response to oil prices and GDP world due to its impact of crisis financial.
Responses analyses Shows the results of all period, the euro-dollar exchange rates increase Algeria exports about 4 to 2 a standard deviation over two first years percent then its begins decrease about 1 to 2 a standard deviation in three years later, this positive impact between depreciation the us dollar against the euro and Algeria exports explain by the relation negative between the us dollar and oil price over the period 2002-2010, when in the same time U.S dollar against the euro decline per annual rate from 0.944 Euro/dollar since 2002 from 1.42 euro/dollar in2010 , the Algeria exportation rises about of 18.79 billion dollars in 2002 to 57 billion dollars in 2010, subsequently , Algeria exports
benefitted the weakness of the US dollar.
-.08 -.04 .00 .04
1 2 3 4 5 6 7 8
Response of LOGEXP to LOGGDPW
-.08 -.04 .00 .04
1 2 3 4 5 6 7 8
Response of LOGEXP to LOGOIL
-.08 -.04 .00 .04
1 2 3 4 5 6 7 8
Response of LOGEXP to LOGEUUS
-.08 -.04 .00 .04
1 2 3 4 5 6 7 8
Response of LOGEXP to CRIS Response to Generalized One S.D. Innovations
The decomposition of variance
The variance decomposition tables show that importance of financial crisis to explain exports variation in short and long term. Moreover, percentage change of Algeria export explained about % 40 - % 60 by oil prices and %3 to %8 by Euro-Dollar exchange rates and financial crisis for a forecast horizon. This resultant determined how external shocks are important affected on Algeria economy.
Table 7: the Variance decomposition
Period LOGEXP LOGGDPW cris LOGEUUS LOGOIL 1 100.0000 0.000000 0.000000 0.000000 0.000000 2 61.14231 0.147938 0.283300 0.065425 38.36103 3 35.42916 0.171902 3.004961 3.945825 57.44815 4 32.46239 0.474121 5.731991 3.758568 57.57293 5 26.79136 0.560984 6.498491 6.226789 59.92237 6 24.24837 0.687535 7.487063 7.525143 60.05189 7 23.88829 1.103647 7.966080 7.420739 59.62124 8 23.16115 1.601586 7.858586 7.475457 59.90322
IV. Conclusion
In this paper, we investigated our results shows that there is long-run relationship between the Algerian exports and its most external shocks can be affected on exports performance. However, our estimation of a VECM model indicates that granger causality from reel and monetary (exchange rate) shocks to Algerian exports. A result of this stady helps explain the Algerian government how can reduce them vulnerability to such shocks.
References
1. Hamilton, J. D., Oil and the Marcoeconomy since
World War II, the Journal of Political Economy (91),
228-248. (1983)
2. Hamilton, J. D: This is what happend to the oil
price-macroeconomy relationship, Journal of Monetary
International Journal in Management and Social Science (Impact Factor- 4.358)
3. Hamilton, J. D: What is an Oil Shock? Journal of
Econometrics (133), 363-398. (2003)
4. Hamilton, J.D. Causes and consequences of the oil
shock of 2007–08. Brook. Papers Econ. Act., 215–259,
(2009)
5. Hamilton, J.D.,. Historical oil shocks. In: Rout ledge
Handbook of Major Events in Economic History, pp.
239–265, 2013
6. Santini, D. J. “The Energy-Squeeze Model: Energy Price
Dynamics in U.S. Business Cycles.” International
Journal of Energy Systems,(5): 18-25, (1985)
7. Lee, K., S. Ni, and R. A. Ratti. ”Oil Shocks and the
Macroeconomy: The Role of Price Variability”, Energy
Journal(16): 39-56, (1995)
8. R. H. and J. A. Tatom .The Effects of the New Energy
Regime on Economic Capacity, Production and Prices.”
Federal Reserve Bank of St. Louis Review, 59(4): 2-12, (1977)
9. Abel, A.B. and B.S. Bernanke, “Macroeconomics”,
Addison Wesley Longman Inc. (2001)
10. Brown, S. P. A. and M. K. Yucel, “Oil Prices and the
Economy.” SoutwestEconomy, Federal Reserve Bank
of Dallas, Issue: (4), (2000)
11. Zhang, Zhaoyong, Sato, Kiyotaka, McAleer, Michael
(2003), “Asian MonetaryIntegration: A structural VAR Approach,”http://www.e.utokyo.
ac.jp/cirje/research/03research02dp.html.
12. Chen, S.-S.” Do higher oil prices push the stock market
into bear territory"?”, Energy Economics(32), 490-495,
(2010)
13. Elder, J., Serletis, A., '”Oil price uncertainty”, Journal of
Money, Credit and Banking, (42), 1137-1159, (2010)
14. Basher, S.A, Haug, A.A, Sadorsky, P,” Oil prices,
exchange rates and emerging stock markets”, Energy
Economics(34), 227-240,(2012)
15. Bjørnland, H. C, “Oil Price Shocks and Stock Market
Booms in an Oil Exporting Country”, Working Paper
from Norges Bank (16), (2008)
16. Eltoney, M. Nagy, “Statistical Oil Price fluctuations and
their Impact on the Macroeconomic Variables of Kuwait: A Case Study Using VAR Model for Kuwait,”
http://www.arab-api.org/wps9908.pdf, (2001)
17. Husain, T. and Ter-Martirosyan, “Fiscal Policy and
Economic Cycles in Oil-Exporting Countries.”, IMF
working Paper, ( WP/08/253), (2008)
18. Omar Mendoza and David Vera, “The Asymmetric
Effects of Oil Shocks on an Oil-exporting Economy”,
CUADERNOS DE ECONOMÍA, VOL( 47), (MAYO), PP. 3-13, (2010)
19. Yudong Wang, Chongfeng Wu, Li Yang ”Oil price
shocks and stock market returns: Evidence from
oil-importing and oil-exporting countries “, SSRN,
Electronic copy, available at:
http://ssrn.com/abstract=2189575 , (2013)
20. Clark P, "Uncertainty, Exchange Rate Risk, and the
Level of International Trade", Western Economic
Journal (11) (September): 303-13, (1973)
21. Hooper P., & Kohlhagen, S. W. (1978), “The effect of
exchange rate uncertainty on the prices and volume of
international trade”, Journal of International
Economics, (8), 483-511, (1978)
22. Cushman D. 0, “The effects of real exchange rate risk
on international trade”, Journal of International
Economics, (15), 45-63. (1983)
23. Cushman D. 0, “Has exchange risk depressed
international trade? The impact of third-country
exchange risk”, Journal of International Money and
Finance, 5, 361-379, (1986)
24. Bailey M J., Tavlas G.S. and Ulan M, «Exchange Rate
Variability and
Trade Performance: Evidence for the Big Seven Industrial Countries», WeItwirstchaftliches Archive,
Review of World Economies, p. 466-477, (1986)
25. Bailey M J. and George S. Tavlas , “Trade and
Investment Under Floating Rates: the U.S.
Experience”, Cato Journal (Fall): 421 -49, (1988)
26. McKenzie M. D. and Brooks , R, “The Impact of
Exchange Rate Volatility on German - US Trade Flows,”
Journal of International Financial Markets, Institutions and Money,( 7), pp. 73-87, (1997)
27. Doyle E, “Exchange Rate Volatility and Irish-UK Trade,
1979-1992”, Applied Economics, (33), PP: 249-65,
(2001)
28. Franck Cachia, " Les effets de l'appréciation de l'euro
sur l'économie française", note de conjoncture, (2008)
29. Serge REY"l’impact du taux de change sur les
exportations de l’Allemagne et de la France hors zone
euro », CATT-UPPA WP N°.(9), (2011)
30. Saang Joon BAAK « The bilateral real exchange rates
and trade between China and the U.S.”, China
Economic Review,( 19 ):117 – 127, (2008)
31. Sulaiman D. Mohammad and Irfan Lal, “The Euro -
Dollar Exchange Rate & Pakistan Economy”, European
Journal of Scientific Research,Vol.42 No (1), pp.6-15 , (2010)
32. Granger C. W. J.” Development in the Study of
Cointegrated Economic Variables,” Oxford Bulletin of
Economics and Statistics, Vol: 48, No ( 3). pp.
(213-228), (1986)
33. Dickey, David A. and Fuller, Wayne A., “Distributions
of Estimates for Autoregressive Time Series with a Unit
Root,” Journal of the American Statistical Association,
(74), 427-431, (1979)
34. Phillip P.C.B. and Perron P.” Testing for a unit root in
time series regression,” Biometrika,Vol (75) ,pp.
335-346, (1988)
35. Engle R.F. and C.W.J. Granger , " Co-integration and
Error Correction: Representation, Estimation, and