Copyright 0 1983 by the Genetics Society of America
MITOCHONDRIAL DNA EVOLUTION
IN
MICE
STEPHEN D. FERRIS,* RICHARD D. SAGE,**t ELLEN M. PRAGER,* UZ1 RITTE**' and ALLAN C. WILSON*
*Department
of
Biocheinistry and +Museum of Vertebrate Zoology, Universityof
Calijirnia, Berkeley, Californiu 94720Manuscript received August 4, 1981
Revised copy accepted July 21, 1983
ABSTRACT
This study extends knowledge of mitochondrial DNA (mtDNA) diversity in mice to include 208 animals belonging to eight species in the subgenus Mus. Highly purified mtDNA from each has been subjected to high-resolution re- striction mapping with respect to the known sequence of one mouse mtDNA. Variation attributed to base substitutions was encountered at about 200 of the
300 cleavage sites examined, and a length mutation was located in or near the displacement loop. The variability of different functional regions in this gen- ome was as follows, from least to most: ribosomal RNA, transfer RNA, known proteins, displacement loop and unidentified reading frames.-Phylogenetic analysis confirmed the utility of the SAGE and MARSHALL revision of mouse classification, according to which there are at least four species of commensal mice and three species of aboriginal mice in the complex that was formerly considered to be one species. The most thoroughly studied of these species is Mus domesticus, the house mouse of Western Europe and the Mediterranean region, which is the mitochondrial source of all 50 of the laboratory strains examined and of the representatives of wild house mice introduced by Euro- peans to North and South America during the past few hundred years.- The level of mtDNA variation among wild representatives of M . domesticus is similar to that for the Eastern European house mouse (M. tnusculus) and several other mammalian species. By contrast, among the many laboratory strains that are known or suspected to stem from the pet mouse trade, there is little interstrain variation, most strains having the 'old inbred" type of domesticus mtDNA, whose frequency in the 145 wild mice examined is low, about 0.04.
Also notable is the apparent homogeneity of mtDNA in domesticus races that have fixed six or mare fused chromosomes and the close relationship of some of these mtDNAs to those of karyotypically normal mice.-In addition, this paper discusses fossil and other evidence for the view that in mice, as in many other mammals, the average rate of point mutational divergence in mtDNA is
2-4% per million years. From this, it is estimated that the commensal associ- ation between mice and our ancestors began more than a million years ago, i.e., at an early stage in the evolution of Homo erectus.
0 make efficient use of the genetic variation present in wild mice, genet-
T
icists need a realistic picture
of
how that variation is organized with
respect
to
populations
and
species of wild mice. Accurate information about
the extent of genetic divergence within and between such populations in dif-
682
FERRIS ET AL.ferent parts of the world is also a prerequisite for investigation of the genetic
basis of evolutionary change. House mice and related species may prove
to
be
one of the best groups with which to examine the genetic basis of evolutionary
change because they are being studied more intensively at many levels of
biological organization than any other group of vertebrates.
Until recently there was no quantitative phylogenetic framework with which
to organize knowledge of the genetic and phenotypic diversity among the
lineages leading to house mice and their relatives. SAGE’S
(1 98 la) comparative
electrophoretic study of proteins encoded by 56 loci was a major step toward
remedying this lack. His findings, supplemented
by
those of
THALER,
BON-
HOMMEand BRITTON-DAVIDIAN
(1981) and BONHOMME
et al.
(1983), and con-
sidered together with MARSHALL’S morphological comparisons
(
MARSHALL
198 1
;MARSHALL
and SAGE 198 l), showed that the traditional classification of
house mice and their relatives (SCHWARZ
and SCHWARZ
1943) reflected neither
the genetic relationships nor the morphological similarities among these mice.
They, therefore, revised the classification to emphasize the major genetic
groups of house mice and their relatives. T h e present study deals with the
following species recognized by SAGE
and
MARSHALL:
I.
House mice and their close relatives
A. Commensal mice
1.
M.
domesticus,
Western Europe, North Africa, Near East (including
2.
M.
musculus,
Eastern Europe
3.
M .
molossinus,
Northern Asia
4.
M.
castaneus,
Southern Asia
5.
M . spretus,
Western Europe, North Africa
6.
M.
abbotti,
Eastern Europe
7.
M.
hortulanus,
Eastern Europe
8.
M .
cemicolor,
Southeast Asia
M.
poschiavinus,
the tobacco mouse)
B. Aboriginal mice
11. More distantly related species
An important purpose of the present paper is to test the utility of this nuclear
genetic classification by detailed restriction analysis of mitochondrial DNA
from mice representing all of these species. Previous mtDNA comparisons have
provided valuable evidence regarding the relatedness of certain mouse lineages
(YONEKAWA
et al.
1980, 198 1, 1982; KING, SHADE
and LANSMAN
198 1
;FERRIS,
SAGE and WILSON 1982; FERRIS
et
al.
1983a.b). These studies involved either
MITOCHONDRIAL DNA EVOLUTION IN MICE
683
a new perspective emerges regarding the time at which the commensal asso-
ciation between mice and protohumans began.
MATERIALS AND METHODS
Mice: Table 1 lists the 50 "laboratory" strains of mice examined and their sources. Mice trapped in the wild and laboratory descendants of separate lines of wild-caught females provided an addi- tional 158 animals from 51 localities, as listed in Table 2.
Preparation, digestion and electrophoresis of mitochondrial DNA: MtDNA was purified from soft tissues of single mice in all but a few instances, where two to three littermates were pooled. T h e mtDNA was highly purified by ultracentrifugation according to BROWN, GEORGE and WILSON (1979), as previously described (FERRIS, SAGE and WILSON 1982; FERRIS et al. 1983a,b). About 10 ng of mtDNA was digested with each restriction endonuclease (New England Biolabs). Fragments were end-labeled with
'*P
and electrophoresed in 1.2% agarose or 3.5% polyacrylamide gels, which were autoradiographed for 3-24 hr at -80" (BROWN 1980). Estimates of fragment sizes were made by comparing them with the known fragment sizes of the mouse mtDNA of known sequence (BIBB et al. 1981). The phage DNAs PM2 cut with HindII1, X cut with EcoRI and 6x174 cut with HincII provided additional size standards.The mtDNAs of mice 1-91 (Tables 1 and 2) were digested with 11 different restriction en- zymes, recognizing six bases (HindIlI, XbaI, HincIl, AccI), five bases (AvaII) and four bases (FnuD11, HpaI1, HaeIII, TaqI, MboI, HinjI). The remaining samples (save M. abbotti and M. hor- tulanus) were digested with MboI and Hinfl, which are the most discriminating (FERRIS et al. 1983a). In addition, old inbred M. domesticus and M. spretus mtDNA were subjected to single and double digestion with 12 six-base enzymes to produce the cleavage map for M. spretus. These 12 enzymes were designated with a single-letter code as follows: EcoRI,
b
HindIII, HPaI, BgllI,e
XbaI,f
BamH1, g PstI, Aval,y
BglI.Fragment patterns and cleavage maps: Each fragment pattern produced by a given enzyme was assigned a capital letter, with A being reserved for the pattern appearing in the mtDNA of known sequence (BIBB et al. 1981). We continue the practice introduced by FERRIS, SAGE and WILSON (1982) and FERRIS et al.. (1983a,b) which designates the patterns chronologically as they are discovered, so that alphabetical proximity to A does not necessarily correlate with degree of similarity to the A pattern.
Cleavage maps for each enzyme were constructed by the sequence comparison method (CANN, BROWN and WILSON 1982; CANN and WILSON 1983; FERRIS et al. 1983a,b), in which one maps the sites needed to account for each fragment pattern by comparison with the known sequence (BIBB et al. 1981). It was not possible to derive complete maps for all enzymes for the non- domesticus types of mtDNA by this method, and, in such instances, fragment sizes are reported ($ APPENDIX). In the case of M. spretus, mtDNA was also mapped by the double-digestion method.
Evolutionary trees were constructed by the parsimony method (FERRIS, WILSON and BROWN 1981; FERRIS et al. 1983a,b), which does not assume a constant rate of mtDNA evolution. Restric- tion enzyme sites were used as characters for tree construction with domesticus types of mtDNA or with the musculus and molossinus types. Fragment sizes were used as characters to investigate the branching order of the more distant lineages to one another.
Two approaches were used to estimate the extent of point mutational divergence between pairs of mtDNAs, as described in detail previously (FERRIS et al. 1983b): the site method is based on map comparisons and employs equation 16 of NEI and LI (1979), whereas the fragment method is based on the fraction of shared fragments and employs equation 20 of NEI and LI (1979). T h e site method, which underestimates actual sequence divergence to a lesser extent, was employed whenever complete or nearly complete maps could be derived.* The fragment method supple- mented the site method for comparison of the more distant taxa. In all cases the final value was obtained by weighting according to the number of six-, five- and four-base sites compared.
PvuI1,
i
SacI,1
XhoI,TABLE 1
Sources of laboratory mouse strains
Oldest nonlaboratory Oldest nonlaboratory Mouse no. and strain
Mouse no. and strain source, date and category source, date and category
IM.
domesticus1 DBA/2N
2 BALB/cJ 3 C3H 4 AU/SsJ
5 C57BL/6J
6 C58/J 7 SWR/J
9 AKR/Cum
10 DBA/LiA 11 129/MA 12 BALB/cByA 13 BALB/cCdA 14 A/BrAf 15 A2G/GA 16 C3H/HeAf 17 CBA/BrA 18 C57BL/LiA 19 C57BLlImrHeA 20 BIMA/A 21 RIIIS/J
22 FVB/NA 23 SJL/JA 24 STS/A
25 GRS/A 26 MAS/A
Dealer, Massachusetts,
Dealer, Ohio, 1913, A As for no. 2, A (?) As for no. 2, A Dealer, Massachusetts,
As for no. 5, A Dealer, France, <1920,
Dealer, New Jersey,
Dealer, Pennsylvania,
As for no. 1, A (?) As for no. 1, A As for no. 2, A As for no. 2, A (?) As for no. 2, A (?) As for no. 2, A As for no. 2, A As for no. 2, A As for no. 5, A As for no. 5, A (?) As for no. 2, A Unknown, France,
As for no. 7, B As for no. 7, B Unknown, Switzerland,
-1930, B As for no. 24, B As for no. 24, B
1909, A 1921, A A 1922, A 1928, A 1928, B
27 LIS/A 28 LTS/A 29 TSI/A
30 DD/HeAf
31 WLL/BrAf
32 020/A
33 CE/JA 34 NMRI/Lac 35 AKR/FuRdA 36 NMRI/Navy 37 SL/NiA
38 NZB/Ibm
39 NZW/Ola 40 MOR/Cv 41 PAC/Cv
42 IS/Cam/J 43 SF/Cam/J
44 SK/Cam/JEi 45 NZB/BlNJ 46 NZB/Bom 47 NZO/Dus 48 NMRI/Bom
iM.
nolossinus”87 KL/oci
88 MOLS/JA
As for no. 24, B As for no. 24, B Unknown, Germany,
Unknown, Germany,
Dealer, Norway, 1929,
Dealer, Netherlands,
Wild, Illinois, 1920, B As for no. 7, B As for no. 9, A As for no. 7, B Unknown, Switzerland,
-1930, B Unknown, England,
1930, B
(?) As for no. 38, B Wild, Ohio, -1963, C Wild, Pennsylvania,
Wild, Israel, 196 1, C Wild, California, 1951,
-1930, B
C1920, B
B
1931, B
1967, C
Wild, Wales, 1962, C As for no. 38, B As for no. 38, B As for no. 38, B As for no. 7, B
Wild, Japan, 1967, C As for no. 87, C
Genealogical information including place and time of origin is based on LYNCH (1969), BIEL- SCHOWSKY and GOODALL (1970), CONNOR (1978), MORSE (1978a,b), POTTER and KLEIN (1979), STAATS (1964, 1980), RICE and O’BRIEN (1980), SAGE (1981b), HILKENS et al. (1981), FERRIS, SAGE and WILSON (1982), FERRIS et al. (1983a), and references therein, and on personal commu- nications from J. HILCERS and V. CHAPMAN. Strains in category A belong to the old inbred group considered in FERRIS, SAGE and WILSON (1982); strains in category B have been in the laboratory for at least 50 years, and many probably have a genealogical connection to A; strains in category C are more recently derived from known wild localities
(6
[email protected] of laboratory mzce-for further details). Information is given for the matrilineal source in cases in which females and males from different sources were mated. We obtained mice from: National Cancer Institute, Bethesda, Maryland (no. 1); T h e Jackson Laboratory, Bar Harbor, Maine (nos. 2, 4-8, 21, 42-45); M. LIEBERMAN, Stanford University, Stanford, California (no. 9); J. HILGERS and R. NIKKELS, Netherlands Cancer Institute, Amsterdam (nos. 10-20, 22-33, 35, 37, 88); K. FISCHER LINDAHL, Basel Institute for Immunology, Basel, Switzerland-see also FERRIS et al. (1983a) and FISCHER LINDAHL and HAUSMANN (1983) (nos. 34, 36, 38, 39, 46-48); V. CHAPMAN, Roswell Park Me- morial Institute, Buffalo, New York (nos. 40, 41, 87). MtDNA from the LA9 cell line, whose sequence was determined (BIBB et al. 1981), represented C3H (no. 3) and was a gift from W. M. BROWN. Strains 1-9 are the old inbreds examined by FERRIS, SAGE and WILSON (1982); strains 21, 34, 36 and 38-48 were also previously studied (FERRIS, SAGE and WILSON 1982; FERRIS et al.
1983a). Strains 4 8 and 87 are not inbred. Strain 38 was previously designated NZB/Fiill (FERRIS
et al. 1983a).
“See Table 2, mouse 86.
MITOCHONDRIAL DNA EVOLUTION IN MICE
685
TABLE 2
Collecting localities for wild-caught or laboratoryraised descendants of wild mice subjected to mitochondrial D N A analysis
Mouse numbef Place and time of collection from the field
-
49*, 92*-97*-
50*, 98*-102* 51*-
52*, 103*-110*-
-
53*,E*
111*-122* 123*, 124* 55*-57* 58 125*-
59-64 - 65, 126, 127-
66, 128-134-
67, 135-139 68, 140-
69, 141, 142-
7 0 , z , 143, 144 72-
-
73 --
7 4 , E , 145, 146-
76, 147-149 150*-153* 154*, 155* 156*-158* 159*-162* 163*-167* 168*-171* 172* 173*, 174* 175* 176* 177**-179* 180* 77 181 - 81
-
M. domesticus
California, Santa Barbara Co., BUELLTON 1980 (#49), 1981, by R. D.
California, Napa Co., NAPA, 1979 (#50), 1981, by R. E. JONES California, Contra Costa Co., ORINDA, 1979, by 0. P. PEARSON California, Sonoma Co., PETALUMA, 1980 (#52, 103), 1981, by R. D.
California, Alameda Co., SAN PABLO, 1979, 1980, by J. HAFNER California, Contra Costa Co., ANTIOCH, 1981, by P. BRYLSKI California, Alameda Co., BERKELEY, 1982, by U. RITTE INDIANA, Vanderburgh Co., Evansville, 1981, by M. FERRIS MARYLAND, Queen Anne Co., Centreville, 1978, by M. POTTER ILLINOIS, Chicago, 1981, by R. D. SAGE
PERU, Lima Dpto., 0.5 km from Nafia, 1976. Designated Peru-Coppock,
Israel, JERUSALEM, 1979, by U. RITE
Egypt, FAIYUM Governate, El Faiyum Depression, 1979, by H. Hoocs-
Egypt, GIZA Governate, near Bashtil, 1979, by H. H ~ S T R A A L Morocco, Tafilalt Oasis, ERFOUD, 1978, by R. D. SAGE
Morocco, 7 km NW AZROU, 1978, by R. D. SAGE
Yugoslavia, Dalmatia, ZADAR Is.,-1980 or 1981, by A. GROPP Yugoslavia, Dalmatia, METKOVIC, 1979, by R. D. SAGE
Switzerland, Vaud Canton, Givrins, near NYON, 1978, by R. D. SAGE Italy, Binasco SW MILAN, 1982, by A. GROPP. Designated Mil 11
Italy, CITTADUCALE near Abruzzi, 1979, by A. GROPP. Designated CD England, border Norfolk and Suffolk Co., BUNWELL, 1980, by R. J. BERRY England, TAUNTON, Chedzoy near Bridgwater, 1982, by R. J. BERRY Scotland, Orkney Is., N. WESTRAY, 1981, by R. J. BERRY
Scotland, Orkney Is., S. WESTRAY, 1981, by R. J. BERRY Scotland, Orkney Is., S. RONALDSAY, 1981, by R. J. BERRY Scotland, Orkney Is., STENNESS, 1981, by R. J. BERRY Scotland, Shetland Is., OLLABERRY, 1981, by R. J. BERRY Scotland, Shetland Is., YELL, W. Sandwick, 1981, by R. J. BERRY Scotland, Shetland Is., Wester QUARFF, 1981, by R. J. BERRY Denmark, S. Jutland, HADERSLEV, 1982, by J. T. NIEUEN West Germany, LUBECK (Eichholz), 1982, by A. GROPP
West Germany, MARGARETHENHOF near Segeberg, 1982, by A. GROPP M. domesticus, formerly M. poschiavinus'
Switzerland, Grisons Canton, Zalende, POSCHIAVO, 1978, by R. D. SAGE Italy, Sondrio Prov., TIRANO, 1979, by R. D. SAGE
Denmark, HOV, 1981, 1982, by J. T. NIELSEN
Denmark, SKIVE, 1974, by J. T. NIELSEN; maintained by V. CHAPMAN Denmark, VIBORG, 1974, by J. T. NIELSEN; maintained by V. CHAPMAN Sweden, MALMO, 1982, by J. T. NIEUEN
Czechoslovakia, Moravia, Studenec, approx. 35 km W. BRNO, 1978, by B. SAGE
SAGE
supplied by M. E. WALLACE
TRAAL
686
FERRIS ET AL.TABLE 2-Contiizued
Mouse number‘ Place and time of collection from the field
-
82-
83,fi
205*Czechoslovakia, Slovakia, Slideckovce, approx. 5 0 km E. BRATISLAVA,
Yugoslavia, Serbia, BELGRADE, 1979, by D. KATARANOVSKI Poland, TUREW, 1982, by W. Z. LIDICKER
Japan, OKINAWA, Naha, 1980, by T. NAKADA
Japan, KYUSHU, Fukuoka, 1967, by F. HAMAJIMA. Sent to M. POTTER, from whom #86 comes. #87 and 88 (Table 1) were derived from this same stock and Potter colony
1978, by M. KMINIACK
M. rnolossiiius
-
85- 86
M. castaiieus
-
8 9 Thailand, Thonburi Prov., THONBURI, ca. 1974, by J. T. MARSHALL; maintained by V. CHAPMAN.M. spretus
M. remicolor popneus
- 90
-
91Spain, CADIZ prov., 8 km E. Puerto Real, 1977, by R. D. SAGE
Thailand, SARA BUR1 Prov., Phu Namtok, 21 km ENE. Sara Buri, before 1976, by J. T. MARSHALL; maintained by R. CALLAHAN
M . abbotfi
206 Yugoslavia, Macedonia, 6 km NW. GRADSKO, 1979, by R. D. SAGE
Austria, Burgenland, Kleylehof, 6 km ENE. HALBTURN, 1979, by
R.
D.Yugoslavia, Serbia, Debeljaca, approx. 20 km N. PANCEVO, 1979, by D. M . hor~uluiius
207
208
SAGE
KATARANOVSKI
MtDNA from samples which are underlined was analyzed with 11 restriction enzymes and the results presented in Table 3. MtDNA from the remaining samples (except nos. 206-208) was always analyzed with MboI and HiiifI (results in Table 4) and in some cases with several but not
all of the other nine enzymes. An asterisk indicates that wild-caught animals were analyzed. (For several sequential numbers where all were wild-caught, the asterisk is appended t o the first and last numbers.) Further details on the exact collecting localities are available from the authors.
“Samples 49-76, 78-84, 176, 177 and 182-205 were previously examined (FERRIS, SAGE and WILSON 1982; FERRIS et al. 1983a,b), in many cases with only a few restriction endonucleases.
*Sample 177 contributed the I pattern for FiiuDII (Table 7A, APPENDIX).
‘See DISCUSSION (Model for chroinosoinal Poolutiori). We join GROPP et al. (1982) in refraining from assigning a separate taxonomic rank t o chromosomal races within M . doinesticus, and we list M. poschiaviiius only for purposes of identification with MARSHALL and SAGE (1981) and MARSHALL (1981).
When the site methods were used for parsimony tree construction and for estimates of sequence divergence, cognizance was taken of the fact that in seven instances a single base change was recognized by two restriction enzymes
(6
APPENDIX Tables 5A, 6A and 8A-12A for further details). In each instance, the change was counted only once.RESULTS
Fragment patterns and corresponding maps
MITOCHONDRIAL DNA EVOLUTION IN MICE
687
TABLE 3
Fragment patterns f o r mouse intDNA digested with 1 1 restriction enzymes"
Hind Xba H i m Acc Ana FnuD Hpa Hae T;q M P H F f
Mouse number and kind 111 I I I I I I II II I11 M . domesticus
Laboratory inice
A A A
A K A
A C A
A A A
A A A
A D A
1-34, 38-40
cf:
Table 1 35b AKR/FuRdA 36 NMRI/Navy 37 SL/NiA4 1 PAC/Cv 42 IS/Cam/J
43, 44 SF/Cam/J, SKI Cam/JEi
45-48 NZB etc.+ Ta- ble l
A A A A A A A A A A B A
A A A A A A
A A A A A A
A A Q * A A A
A A A Q A T
A A A A A B
A A P * D F M
B A B A C A A E B* J N
B A A D C H
B A A A A
Wild mice
A A A
49 California-Buellton 50, 5 1 California-Nap,
52 California-Petaluma 53, 54 California-San
55-57 Indiana 58 Maryland 59-64 Peru 6 5 Israel-Jerusalem 6 6 Egypt-Faiyum 67 Egypt-Giza 68 Morocco-Erfoud 69 Morocco-Azrou 70, 71 Yugoslavia-Zadar 72 Yugoslavia-Metkovif 73 Switzerland-Nyon 74, 75 Italy-Mil I1
77
Switzerland-Pos- OrindaPablo
76 Italy-CD
chiavo
A A A A A A A A
B A
B A
A A A
A A A
A A A B A C
B A A D C H
A A B A A A B A B A B A B A B A B A B A B A B A B A B A
A A B
A A A
A A C
B C C
A A C
A A C
A A A
B C D
G A A
B C C
C A A
B A C
B C D
B J I
A B * A A A B
B A A D C H
A A A A B A
A A M B R C
A A B B G J
A A A C C D
A A A D D E
A C A E E F
A A * O * G G J
A A A B A C
A D D B H K
A A C D F I
A A N B Y V
A A B B I L
B A A E A
M . musculus
B C D
A A F D U C '
78 Denmark-Hov 79, 80 Denmark-Skive,
8 1 Czechoslovakia-Brno 82 Czechoslovakia-Bra-
83, 84 Yugoslavia-Bel- Viborg'
tislava
grade
B A H A B B I L
B B
B C
B B D
A A D
A A B B I L
D G G J L P
D F H K L Q
D E H L M R
B D A F D
B D A A E
M . molossinus
A A E
A A A
D G I M A ' P
A A A A A A
85, 86 Japan
87, 88 KL/oci, MOLJ/JA
B D
6aa
FERRIS E T AL.TABLE 3-Continued
Hind Xbo Hinr Arc Aua FnuD Hpa Hue Taq Mbo Hinf Mouse number and kind 111 I I I I I1 I1 I 1 I11 I I I
M . custuneus
89 Thailand-Thonburi B F D G F E H J N B’ D’
90 Spain
M. spretus
C E E H G F I K O P S
IM.
cerurrolor9 1 Thailand-Sara Buri D G F I H G J L P Q E’ “An asterisk indicates changes from patterns previously reported (FERRIS, SAGE and WILSON
1982; FERRIS et al. 1983a). Corrections in the HpaII patterns were necessitated by discovery of the apparent reversal of two samples on a gel (nos. 53 and 69) and subsequent retesting. Those involving HaeIII patterns P and Q (compare FERRIS et al. 1983a) resulted from careful study of the complete maps for all enzymes for all taxa and the discovery that gain of an AccI site at 15924 must be accompanied by loss of the HaeIII site at 15923 (Tables 5A and 9A of APPENDIX); the
changes in the HaeIII pattern are difficult to detect, as the band losses and gain occur in regions of multiple superimposed or closely spaced bands. HaeIII pattern 0 represents an additional change beyond pattern B (Table 9A). The TaqI change results from the recognition after map analysis that the pattern previously designated H is apparently the same as B. Patterns D, N, P for XbaI, MboI, and Hznfr, respectively, for M. musculus no. 205 are reported in FERRIS et al. (198313) and the APPENDIX. M. abbottr and
IM.
hortulanus(6
Table 2) were both digested with XbaI and AvaII, and each species yielded patterns unshared by any other taxon. M. hortulanus was also digested with HzncII, HpaII, HaeIII, Tag1 and Hznfr, and here also the patterns were unique to this species.bA second animal was examined, with the same result as shown here for the enzyme AccI. ‘The patterns reported for Viborg mtDNA in FERRIS, SAGE and WILSON (1982) were in error due to a mislabeled mouse; those in FERRIS et al. (198313) are correct.
relation to the known base sequence for one of these mtDNAs, and it was
possible
to
infer maps for an average of 16’7 cleavage sites in each mtDNA.
T h e
APPENDIXgives the exact locations for many of these sites for each of the
32 types of mtDNA encountered in this survey. Table 3 also summarizes the
results for mice 205-208 (footnote a).
MtDNAs from 1
13
more mice bearing
domesticus
mtDNA were digested with
two restriction enzymes
(MboI
and
Hinfr),
and the resulting fragment patterns
are
listed in Table
4.
T h e locations of the cleavage sites required to account
for the 13 additional types of mtDNA revealed in this less complete restriction
survey appear in the
APPENDIX.Domesticus MtDNA
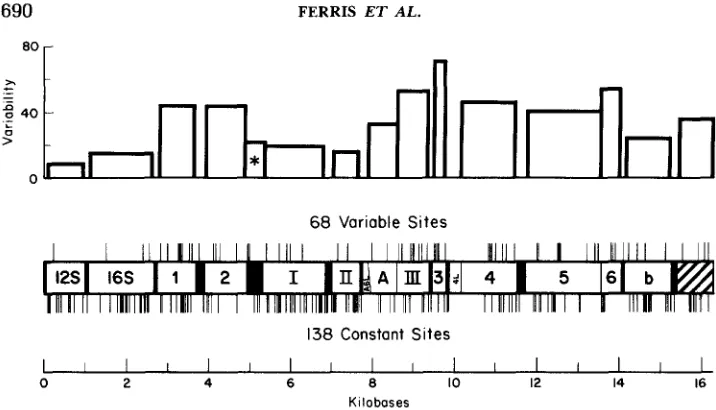
Genomic distribution
of
uariable and constant sites:
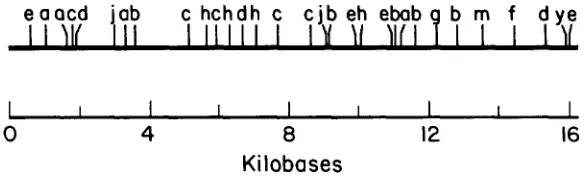
T h e thin vertical lines in
Figure 1 give the approximate positions of the 206 cleavage sites mapped in
domesticus
mtDNAs. Of these, 68 are variable,
i.e.,
present in some mtDNAs
and absent in others, whereas 138 are constant,
i.e.,
present in all
domesticus
mtDNAs tested. Both sorts of sites are distributed widely in the genome (Fig-
ure 1).
Upon dividing the number of variable sites by the total number of sites in
a
region, one can estimate the variability in that region. This has been done
for each mitochondrial gene, both in the bar graph (Figure 1) and in Table
MITOCHONDRIAL DNA EVOLUTION IN MICE
689
TABLE 4
Fragment patterns produced by the restriction enzymes MboI and Hinfl in 147 mice bearing domesticus mtDiVA
Localities (and sample no.)
AA 6 A 0 1 AZ 4
sz
11xz
2 AB 2 AY 3 A T 1 BA 1 AC 20AU 4
zc
1 EF 2 FI 1 FM 1 VB' 1 UC' 2cc
1 CD 1 CE 1 DE 1 T W 4 CH 18RC 12 HK 1 IL 30
KL 3 IA' 1 GJ 6 J N 1 YV 4
BUELLTON, California (49, 92); BUNWELL, England (150-153) HADERSLEV, Denmark (1 76)
BUELLTON (93, 94), BERKELEY (1 23, 124), California
BUELLTON (95-97), NAPA (98-loo), ANTIOCH (1 11-1 15), California TAUNTON, England (154, 155)
SAN PABLO, California (53, 54)
YELL (173, 174), QUARFF (175), Shetland Is., Scotland SL/NiA (37)
Centreville, MARYLAND (58)
NAPA (50, 101, 102), ORINDA (51), California; ZADAR, Yugoslavia (70, 71, 143, 144); N. WESTRAY (156-158), S. RONALDSAY (163-167), STENNESS (168-171), Orkney Is., Scotland
S. WESTRAY, Orkney Is., Scotland (1 59-1 62) OLLABERRY, Shetland Is., Scotland (1 72) ERFOUD, Morocco (68, 140)
NYON, Switzerland (73) ISRAEL (42)
FAIYUM, Egypt (128)
POSCHIAVO, Switzerland (77); TIRANO, Italy (181) GIZA, Egypt (135)
FAIYUM, Egypt (66) GIZA, Egypt (136) GIZA, Egypt (67)
FAIYUM (129). GIZA (137-139), Egypt
PETALUMA, California (52, 103-1 10); INDIANA (55-57); ILLINOIS (125); FAI-
ANTIOCH, California (1 16-1 2 1); PERU (59-64) METKOVIk, Yugoslavia (72)
CITTADUCALE, Italy (76, 147-149); HOV (78, 182-203), SKIVE (79), VIBORG
LUBECK, northern Germany (1 77-1 79)
MARGARETHENHOF, northern Germany (180)
JERUSALEM, Israel (65, 126, 127); AZROU, Morocco (69, 141, 142) ANTIOCH, California (1 22)
MILAN, Italy (74, 75, 145, 146) YUM, Egypt (130-134)
(80), Denmark; MALMO, Sweden (204)
This table lists all 31 types of domesticus mtDNA detected with the restriction enzymes MboI and H i n f l . T h e letters indicate the fragment patterns obtained with MboI and Hitzfl, respectively; this lettering system is consistent with that for these two enzymes in Table 3. Information about the locations of the cleavage sites responsible for these patterns appears in APPENDIX, Tables 11A and 12A. T h e 31 types are arranged in accordance with the evolutionary tree in Figure 3. Laboratory strains are included only when no wild representative of the same type was found in our present survey (AT and FM); FM has a documented wild origin (Table 1). (The remaining laboratory strains are of the AA, AB, CH and JN types-see Table 3.)
690
FERRIS E T AL.80 r
68 Variable Sites
138
Constant Sites0 2 4 6 8 IO 12 14 16
Kilobases
FIGURE 1.-Locations of variable and constant cleavage sites in 38 types of doinesticvs mito- chondrial DNA detected with two to 11 restriction endonucleases. The lines above the horizontal bar showing the mtDNA genes indicate the 68 variable sites and the lines below the bar the 138 constant sites. The mtDNA genome is oriented as in the BIBB et al. (1981) sequence and the genes are indicated as follows: ribosomal genes (12s and 16s); tRNA genes or spacers (black areas); genes encoding cytochrome oxidases I, I1 and I l l , ATPase, and cytochrome b (I, 11, 111, A , and b); unidentified reading frames presumed to encode additional proteins (1-6, A6L and 4L); dis- placement loop and adjacent noncoding regions (shaded portion). The histogram at the top of the diagram shows the degree of variability in each gene: the variable sites divided by the total sites and converted to percent. The histogram section with the asterisk indicates the variability for all 22 tRNAs collectively. Seven of the 68 variable sites are detected with two enzymes (see text and APPENDIX, Tables 5A, 6A and 8A-12A).
(see
APPENDIX).Sixty-five percent
of
them are transitions, a value lower than
that reported for sequenced regions
of
mtDNA from closely related primates
(BROWN et
al. 1982;
GREENBERG,
NEWBOLD
and
SUGINO
1983) and rats
(BROWN
and
SIMPSON
1982) but in agreement with restriction data on human
mtDNAs
(CANN
1982).
Seventy-five percent of the 36 inferrable substitutions (including two losses-
cf:
APPENDIX,Tables 6A and SA) detected in protein-coding regions are silent
(see
APPENDIX),in agreement with the 78% observed by sequencing closely
related primate mtDNAs
(BROWN
et
al.
1982). Among the known proteins, the
percentage of silent substitutions is 92, whereas the corresponding figure for
the unidentified reading frames is 65.
Length mutations:
One clear example of a length mutation was encountered
in this comparison of
domesticus
mtDNAs. From the sizes of the restriction
fragments produced by
TaqI, HaeIII, MboI, HznfI
and
HpaII,
we localized an
addition of about
12
bp to the region from 15330
to
15736, which encom-
passes 86 bp of two tRNA genes and 320 bp of noncoding DNA in the
displacement loop. This addition was evident only in the tobacco mouse ( a m -
ple 77). There could be additional minor variations in length among the
do-
MITOCHONDRIAL DNA EVOLUTION IN MICE
TABLE 5
Variation in domesticus mitochondrial DNA genes
691
Number of sites Percent variability Inferred
Variable Constant mutations
%
!
!
Region (a) (b)
(4
a + b a + bRibosomal RNAs
12s 16s
Total
Transfer RNAs
Protein encoding Known proteins
CO I CO I1 ATP 6
CO I11
Cyto b Total 1 2 A6L 3 4L 4 5" 6" Total
Unknown proteins (URFs)
All proteins
Displacement loop
Total mitochondrial genome
1 10
3 16
4 26
3 15
4 19
1 10
2 4
7
7
4 12
18 52
8 10
4
5
0 0
5 2
0 0
4 8
8 11.5
3 2.5
32 39
50 91
3 7
60 139
1 3 4 3 4 1 2
7
5 19 87
0 5 0 4 13 4 41 60 6 73 9.1 15.8 13.3 16.7 17.4 9.1 33.3 50.0 25.0 25.7 44.4 44.4 71.4 33.3 41.0 54.5 45.1 35.5 30.0 30.2 9.1 15.8 13.3 16.7 17.4 9.1 33.3 50.0 31.3 27.1 44.4 77.8 71.4 33.3 66.7 72.7 57.7 42.6 60.0 36.7The data are taken from the 199 sites detected among the 25 dom~sticus types of mtDNA digested with 1 1 enzymes and used to construct the tree in Figure 2 (below). The 73 inferred mutations derive from that tree. The 100a/(a
+
b) column is analogous to the histogram in Figure1, whereas the lOOc/(a
+
b) column takes account also of multiple hits at a given site. "A single TaqI site is part of both these overlapping genes.ough examination
of
fragment mobilities would be required, like that con-
ducted
by
CANN
and
WILSON (1983)
for human mtDNAs.
Extent
of
diuergence and phylogenetic relationships:
Table
6
summarizes the num-
692
FERRIS ET AL.TABLE 6
Mututiotirtl djffprmres ntnotig 25 t j p s of M. domesticus rr~itochondricil D,VA
Mice compared
1, etc. Inbreds" and 49 Cali-
35 AKR/FuRdA 36 NMRI/Navy 37 SL/NiA
58 Maryland
4 1 PAC/Cv-Pennsylvania 53, 54 California-San Pa-
50, 51 California-Napa,
70, 7 1 Yugoslavia-Zadar 45, etc. Inbreds' and 52, etc.
67 Egypt-Giza 66 Egypt-Faiyum 6 8 Morocco-Erfoud 77 Switzerland-Poschiavo 73 Switzerland-Nyon 42 IS/Cam/J-Israel 59-64 Peru
72 Yugoslavia-Metkovi; 74, 75 Italy-Mil I1
43, 44 SF/Cam/J, SK/Cam/
65 Israel-Jerusalem 69 Morocco-Azrou 76 Italy-CD
78 Denmark-Hov (mu) 79, 80 Denmark-Skive, Vi-
fornia
blo
Orinda
U.S.'
JEi
borg (mu)
1 35 36 37 58 41 53 50 70
-
1 1 1 1 1 3 3 40.05 - 2 2 2 2 4 4 5
0.06 0.11
-
2 2 2 4 4 50.07 0.12 0.14 - 2 2 4 4 5 0.07 0.12 0.14 0.15 - 2 4 4 5 0.07 0.13 0.14 0.15 0.15 - 2 4 5 0.21 0.26 0.27 0.29 0.29 0 . i 4
-
6 7 0.20 0.26 0.27 0.28 0.28 0.28 0.42-
1 0.26 0.31 0.32 0.33 0.33 0.33 0.47 0.05 - 0.51 0.56 0.57 0.58 0.58 0.59 0.72 0.31 0.360.51 0.56 0.57 0.58 0.43 0.59 0.72 0.31 0.36 0.80 0.85 0.87 0.88 0.88 0.88 1.03 0.60 0.65 0.67 0.72 0.74 0.75 0.75 0.75 0.89 0.47 0.52 0.71 0.77 0.78 0.79 0.79 0.79 0.93 0.51 0.56 0.79 0.84 0.86 0.86 0.86 0.87 1.00 0.59 0.64 0.86 0.91 0.79 0.93 0.93 0.94 1.07 0.65 0.71 0.67 0.73 0.74 0.75 0.75 0.75 0.90 0.47 0.53 0.78 0.84 0.71 0.86 0.86 0.87 1.01 0.58 0.63 0.63 0.69 0.70 0.71 0.71 0.71 0.86 0.43 0.48 0.87 0.93 0.94 0.95 0.95 0.96 1.10 0.67 0.72
0.78 0.84 0.71 0.86 0.86 0.90 1.01 0.57 0.63 1.02 1.07 0.95 1.09 1.09 1.10 1.25 0.81 0.86 1.02 1.08 0.95 1.10 1.10 1.11 1.26 0.82 0.87 1.10 1.16 1.03 1.18 1.18 1.19 1.34 0.89 0.95 1.15 1.21 1.07 1.22 1.22 1.23 1.38 0.93 0.99
45 7 8 8 8 8 8 10 4 5
-
0.30 0.44 0.62 0.50 0.58 0.73 0.77 0.89 0.57 0.82 0.89 1.13 1.13 1.21 1.25The upper right portion of the matrix gives the number of site differences determined from the cleavage maps
(4
APPENDIX) constructed for the patterns in Table 3 for samples 1-80, 87 and 88. The lower left portion gives the percent nucleotide sequence divergence estimated with equation 16 of NEI and LI (1979). In contrast to Table 3, where the mice are listed according to species, lab strains and geography, they are here arranged according to degree of similarity, withA
tree
depicting genealogical relationships among these 25 types of
domesticus
mtDNA appears in the upper part of Figure
2.
This branching order allows
the 25
types to be derived by divergence from a common ancestor with fewer
mutations than any other branching order.
Thirteen additional
domesticus
types of mtDNA were detected and mapped
with respect to the two most discriminating of the
I 1
restriction enzymes,
namely,
MboI
and
Hinfl
(see Table
4
and
APPENDIX).Figure 3 depicts genea-
MITOCHONDRIAL DNA EVOLUTION IN MICE
693
67 66 68 77 73 42 59 72 74 43 65 69 76 78 79
7 11 9 10 11 12 10 11 9 12 I 1 14 14 15 16
8 I2 10 I 1 12 13 11 12 10 13 12 15 15 16 17 8 12 10 I1 12 11 11 10 10 13 10 13 13 14 15 8 12 10 11 12 13 11 12 10 13 12 15 15 16 17 6 12 10 11 12 13 11 1 2 10 13 12 15 15 16 17 8 12 10 11 12 13 11 12 10 13 12 15 15 16 17 10 14 12 13 14 15 13 14 12 15 14 17 17 18 19
4 8 6 7 8 9 7 8 6 9 8 1 1 1 1 1 2 1 3
5 9 7 8 9 1 0 8 9 7 1 0 9 1 2 1 2 1 3 1 4
4 6 8 7 8 10 11 12 8 11 12 15 15 16 17
-
8 8 7 8 10 11 12 8 11 12 15 15 16 170.60 - 12 11 12 14 I3 14 8 11 14 17 15 16 17 0.62 0.93
-
11 12 13 13 14 12 15 14 17 17 18 19 0.50 0.80 0.83-
9 11 14 15 I 1 14 15 18 18 19 20 0.58 0.87 0.91 0.63-
6 15 16 12 15 16 19 19 20 21 0.73 1.02 0.98 0.78 0.39-
14 15 14 17 15 18 18 19 20 0.77 0.93 0.94 0.98 1.05 1.01-
9 7 87
10 10 11 12 0.89 1.08 1.07 1.11 1.18 1.11 0.65-
8 11 8 11 11 12 13 0.57 0.59 0.91 0.78 0.86 1.01 0.50 0.62-
5 8 I 1 9 10 11 0.82 0.84 1.16 1.03 1.11 1.26 0.58 0.88 0.39-
7 10 8 9 100.89 1.07 1.06 1.10 1.18 1.10 0.49 0.64 0.62 0.54
-
3 3 4 5 1.13 1.31 1.31 1.34 1.42 1.35 0.72 0.88 0.86 0.78 0.23-
5 6 7 1.13 1.15 1.32 1.35 1.43 1.36 0.73 0.89 0.70 0.62 0.23 0.39-
1 2 1.21 1.23 1.40 1.43 1.51 1.44 0.81 0.97 0.78 0.70 0.31 0.47 0.08-
3 1.25 1.26 1.43 1.47 1.55 1.47 0.84 0.99 0.81 0.73 0.34 0.50 0.11 0.19-
regard to the phylogenetic clustering in Figure
2.
M. muscuZus with domesticus types of mtDNA are indicated by mu in parentheses.“Samples 1-34, 38-40, 87, 88. ’Samples 45-48.
‘Wild mice from California (sample 52) and Indiana (samples 55-57).
the two trees. The
13
lineages form subsidiary branches or twigs attached to
the major branches that were evident in Figure 2. N o new major lineages were
uncovered by this second survey,
i.e.,
none fall outside the cluster of lineages
established by the first survey.
~ h y ~ o g e n e ~ ~ c a ~ l ~
inferred ~ u t a t ~ ~ n s :
These trees (Figures
2
and 3) permit esti-
mation of the number of mutations required to account for the variation
observed at each site. These numbers for Figure
2
are summarized in Table
5 .
Most of the sites require only one substitution
to
account for the variation
observed, but a few require more events. Examples of these hypervariable sites
occur in the D-loop and in the unidentified reading frames, enhancing esti-
mates of the variability of these regions.
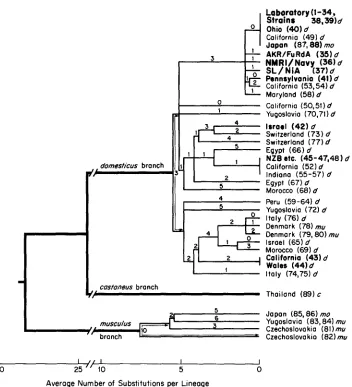
694
FERRIS E T AL.dumesticus branch
1
Laboratory (1-34, Strains 38.39)d Ohio ( 4 0 ) d
California (49) d Jopan (87,88) mu
AKR/FuRdA (35) d
NMRVNovy
(36)
dSL/NiA ( 3 7 ) d I Pennsylvonio (41)d
California (53,54) d
Maryland (58) d
California (50,51) d
Yugoslavia (70,71) d
lrroel (42)d
Switzerland (73) d
Switzerland (77) d Egypt (66)d
NZB
etc. (45-47,48) dColifornia (52) d
Indiana (55-57) d Egypt (67) d
Morocco (68) d
rg
1
Peru (59-64) d
Yugoslovia (72) d
Italy (76) d
Denmark (78) mu Oenmork (79,801 mu Israel (65)d
Morocco (69) d
Wales (44)d
Italy (74,751 d 4
5
2 Colifornio (431 d
costuneus branch
Y I
Thailand (89) cJopan (85,861 mo
5
musculus 6 Yugoslovio (83,841 mu
10 Czechoslovokio (81) mu
branch Czechoslovokio ( 8 2 ) m u
30 2 5 " 10 5 0
Average Number of Substitutions per Lineoge
FIGURE 2.-Evolutionary tree of mitochondrial DNAs from commensal mice. T h e country or state of origin of the mice is given, followed by the sample number (Tables 1 and 2) and letters denoting species identity according to protein electrophoresis and morphology. These are d , mu, ino and c, respectively, for M. domesticus, musculus, nzolossiizus and custaneus. T h e appearance of m u
MITOCHONDRIAL DNA EVOLUTION IN MICE
695
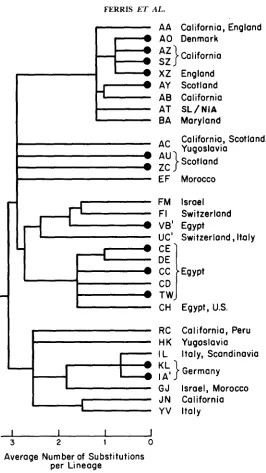
geographic standpoint. Apart from the tendency
for
mouse mtDNAs from
Egypt to cluster in the tree (see Figure
2
and especially Figure
3), macrogeo-
graphic structuring is not strongly evident in the Old World, where M.
domes-
ticus
is a native species. For example, mice from opposite ends of the Mediter-
ranean (Morocco and Israel) have nearly identical mtDNAs whose genealogical
relationship to the intervening Egyptian mtDNAs is fairly remote. In the New
World,
to
which
M.
domesticus
was introduced within the past few hundred
years, there is also no apparent macrogeographic structuring. T h e mtDNA
types found in North and South America are fairly representative of the types
found in Europe and the Mediterranean region.
Microgeographic structuring is strongly evident, however, in both the New
and Old Worlds.
Of
the 25 localities at which more than one mouse was
sampled (Tables 2 and
4),
20 were apparently homogeneous. If
domesticus
mtDNAs were distributed randomly, at most two of the 25 population samples
would have been expected to be homogeneous. Probably, therefore, some of
these homogeneous populations were founded by a single female.
In the three heterogeneous localities in California, namely, Buellton, Napa
and Antioch, none of
the multiple types is unique
to
a locality, and the types
there do not form a monophyletic group with respect to other mtDNA types.
This means that the multiplicity at Californian localities almost certainly did
not arise
in
situ;
rather, it is attributable
to
multiple founders. By contrast, in
the two heterogeneous Egyptian localities, some types, such as DE, may be
unique to a locality and could have arisen
in
situ
(see Figure
3),
but too few
mice were examined to prove this.
Our survey also demonstrated the temporal persistence of particular mtDNA
clones at four localities in California: AA in Buellton in 1980 and 1981, AB
in San Pablo from 1979 to 1980, AC in Napa in 1979 and 1981 and CH in
Petaluma
in
1980 and 1981 (see Tables
2-4).
In addition, we note the occur-
rence of the JN
type in Antioch, 60 km from Corte Madera, where the foun-
dress of the SF/Cam strain was trapped in
1951
(SAGE
1981b). This mtDNA
type has probably persisted in the San Francisco Bay Area for 30 years.
Other MtDNAs
Many sites were mapped by the sequence comparison method in mtDNAs
from additional mice belonging
to
species other than
M u s domesticus;
the frag-
relationships of the three main branches to one another and the location of the roots within the doinesticus and musculus branches; we considered the 199 phylogenetically informative and 249 uniquely variable fragments among 31 types of mtDNA--i.e., all those in Table 3 except M.
696
FERRIS ET AL.A A California, England
0 A 0
Denmark
-
:
A'}
California
sz
0 XZ
England
AY Scotland
AB California
AT
SL/NiABA Maryland
California, Scotland,
Yugoslavia
Scotland
I
EF
FM
F I
VB'
uc'
CE
DE
cc
CD
TW
CH
Morocco
Israel
Switzerland
Egypt
Switzerland, Italy
Egypt,
us.
RC California, Peru
H
K
Yugoslavia
I
L
Italy, Scandinavia
I
-
i
:
KL}Germany
IA'
GJ
Israel, Morocco
JN
California
Y V Italy
i
I I I
I
3 2 1 0
Average Number of Substitutions
per
Lineage
FIGURE 3.-Evolutionary tree for domesticus mtDNAs based on cleavage maps for two restriction enzymes. T h e tree was constructed by a parsimony analysis of the 38 variable sites recognized by MboI and Hinfr
(6
Tables 3 and 4 and APPENDIX, Tables 11A and 12A), of which 19 were phylogenetically informative. A total of 52 point mutations was required to derive these mtDNAs from a common ancestral mtDNA, including an unidentified one along the VB' lineage(6
foot- note ' in Table 1 IA). T h e letters at each lineage refer t o the MboI and Hinfr patterns, respectively. Those lineages terminated by solid circles represent lineages not included in Figure 2. There is congruence with the domesticus section of the tree in Figure 2 except for a shift in the EF lineage (mouse 68 in Figure 2) and a minor change in the relationship of the J N and YV lineages (miceMITOCHONDRIAL DNA EVOLUTION IN MICE
697
ment patterns for these mtDNAs appear in Table
3.
In addition, the mtDNA
of
M.
spretus
was mapped by the double-digestion method (Figure
4).
In all
eight species the length of mtDNA appeared to be
16.3
&0.1
kb, no significant
interspecific differences in length being detected. Moreover, the distribution
of variable and constant sites was fairly similar to that observed for
domesticus
mtDNAs, as was the percentage of transitions and silent substitutions.
In the case of
mice whose mtDNA is highly divergent from the mtDNA of
known sequence, some of the restriction fragments could not be mapped with
much certainty by the sequence comparison method. For this reason, our
estimates of degrees of sequence divergence among these mtDNAs are based
also on the fraction of fragments in common (Table
7).
For the
spretus-domes-
ticus
comparison it was possible to make divergence estimates based on map
comparisons as well. In this case, the map method gives a higher estimate
(16.7%)
than the fragment method does
(8.4%
based on the
1 1
enzymes listed
in Table
3
and
13.0%
based on the
12
enzymes used to prepare the maps in
Figure
4).
Such a result would be expected because the fragment method does
not correct for back mutation or heterogeneity among sites as regards proba-
bility of cleavage. This inadequacy of the fragment method is serious only
Mus domesticus
I
e e a c
ffaaf c
h h
cgeejb yhebfmb
y m
d y e
I1111
I
'I1
Y
II
\\If
19
I
I
Mus spretus
0
4
8
12
16
Kilobases
698
FERRIS E T AL.TABLE 7
Quantitative comparison of fragineut patternsfor mouse mtDNAs
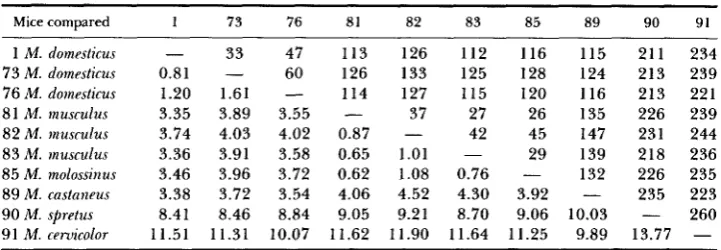
Mice compared 1 73 76 81 82 83 85 89 90 91 1 M. domesticus
73 M. domesticus 76 M. domesticus 8 1 M. musculus 82 M . inusrulus 83 M. musculus 85 M. inolossinus 89 M . castnneus 90 M. spretus 91 M. ceruicolor
33
0.81
-
1.20 1.61 3.35 3.89 3.74 4.03 3.36 3.91 3.46 3.96 3.38 3.72 8.41 8.46
-
11.51 11.31 I
47 60 3.55 4.02 3.58 3.72 3.54 8.84 10.07
-
113 126 114 0.87 0.65 0.62 4.06 9.05 11.62-
126 133 127 37 1.01I .08 4.52 9.2 1
1 1.90
- 112 125 115 27 42 0.76 4.30 8.70 11.64 - 116 128 120 26 45 29 3.92 9.06 1 I .25
-
115 211 124 213 116 213 135 226 147 231 139 218 132 226
- 235
9.89 13.77
10.03 -
234 239 22 1 239 244 236 235 223 260 - ~ ~~ ~~ ~ ~ ~~ ~ ~ ~ ~ ~~
The upper right half of the matrix gives the number of fragment differences among ten different mtDNAs of six species which were digested with 1 1 enzymes (Table 3). Estimates of the percent divergence in nucleotide sequence calculated with equation 20 of NEI and LI (1979) appear in the lower left portion. For comparisons vs. M. ceruicolor, the percentages are based on the six- and four- base enzymes only, as no other taxon shared any fragment produced by the five-base enzyme AvaII.
The fragment method of comparison gives lower estimates of degree of sequence difference than the site method used in Table 6 except in the case of small differences
[cf.
also NEI and LI (1979)and GEORGE ( 1 982)]. Within the domesticus and musculus-molossinus groups, the two methods give comparable results (see Table 6). When domessticus, musculus-molossinus and castaneus are compared with one another with the site method, the values are on the average 0.6% higher than tabulated here. When the site method could be applied to comparisons involving M. spretus and M. ceruicolor,
the values were about 2 and 4% higher, respectively. The fragment results are shown here, as only this method could be applied to all taxa, due to the inability to map completely the non-domesticus
types of mtDNA
(4
APPENDIX).when the sequences compared have diverged by more than 5% (FERRIS
et
al.
1983b).
T h e average divergence between mtDNAs from the
musculus
mice (0.92%)
is comparable with that within the
domesticus
mice. In contrast, there may be
little
variation in M.
molossinus:
mtDNAs from two mice (no. 85, 86) were
identical with 11 enzymes even though they come from islands 700 km apart.
YONEKAWA
et
al.
(1981, 1982) also detected no differences at 22 sites among
at least
46
molossinus
mice from 15 localities in Japan.
It is
notable also that
molossinus
mtDNA is more similar to those of musculus
than to those of other commensal species. This result, based on about 167
restriction sites per genome, is in agreement with that of YONEKAWA
et
al.
(1981, 1982).
MITOCHONDRIAL DNA EVOLUTION IN MICE
Millions of Years
4-8 3-6 2-4 1-2 0
I I I 1 I I I I 1
699
Origin of
commensal mice
domesticus
custuneus
musculus,
molossinus
:
cervicolor
I I 1 I 1 I I I
I
16 12 8 4 0
Percent Sequence Divergence
FIGURE 5.-Evolutionary tree for the mitochondrial DNAs of eight species in the subgenus Mus. The thick lines lead to the four commensal species. The three-way split shown among the domes- ticus, castaneus and musculus-molossinus lineages fits with the mtDNA data almost as well as does the branching order shown in Figure 2. The extents of sequence divergence are based on those shown in Table 7 as well as on values obtained by comparing restriction maps (partial and complete, see legend to Table 7) and should be considered as approximations. The time scale comes from assuming a rate of mtDNA evolution of 2-4% per million years (BROWN et al. 1982; FERRIS et al. 1983b). M. abbotti and M. hortulanus are connected to this diagram with dashed lines on the basis of preliminary studies with t w o to seven restriction endonucleases. From the magnitude of the differences, these two taxa are about as different from the commensals as is
M.
spretus. Further- more, M. abbotti andM.
hortulanus appear almost as different from each other and from M. spetus as all three are from the commensals. The clustering of the aboriginal species shown is based on a parsimony analysis of 14 phylogenetically informative sites in the XbaI and AvaII maps, of which seven sites bear on this question.mensa1 mice. Finally, we show with dashed lines the possible phylogenetic
relationships of the mtDNAs from
M.
abbotti and M. hortulanus, which have
been subjected to preliminary restriction analysis only.
DISCUSSION
Genetic classajication
of
wild mice
The mitochondrial tree (Figures
2,
3 and
5)
generally reinforces the genetic
classification of mice introduced by SAGE
and MARSHALL
(SAGE
1981a;
MAR-
SHALL
and SAGE
1981;
MARSHALL
1981).
It emphasizes not only the distinc-
700
FERRIS ET AL.subspecies in Western Europe and the Mediterranean area. Neither the protein
nor the mtDNA data lend any credence to the genetic reality of these subspe-
cies-domesticus
in the north,
brevirostris
in the central and
praetextus
in the
south part of the geographic region. Consider the mice from Italy, Yugoslavia
and Azrou in Morocco, previously called
brevirostris,
and the so-called
praetextus
mice from Israel, Egypt and Erfoud in Morocco. In Figures 2 and 3 these
former subspecies are interspersed in various parts
of the
M .
domesticus
tree
and do not cluster separately from the mice of Switzerland, the British Isles
and Germany, which were referred to as M.
m. domesticus
under the old system
(SCHWARZ
and SCHWARZ
1943). Thus, the mtDNA results, like the protein
electrophoretic data (SAGE 1978, 1981a; BRITTON
and
THALER
1978;
MAR-
SHALL