Improvement the Power Quality using
D-STATCOM with GA and FIS Controller
Hamza Jaber Alnemer
1Assistant Lecturer, Dept. of Electrical Engineering,, Higher Institute of Engineering Technology Sabha, Libya1
ABSTRACT: Power quality issues are gaining significant attention due to increase in the number of loads. In fact, voltage sags problem is the most occurring power quality problems. These events are usually associated with a fault somewhere on the supplying power system. Therefore, the aim of this study was to assess the applicability of Distribution Static Compensator (D-STATCOM) for the mitigation of voltage sag problem. Three methods were used in control to get the performance of mitigating voltage sag, namely Genetic Algorithms (GA), Fuzzy Inference system (FIS), and Proportional Integral (PI) to determine the injection of voltage and comparison of timely responses. As a result, D-STATCOM injected the voltage into the distribution system to recover the voltage sag problem at single-phase, two-single-phase, and three-phase fault scenario. The results showed that Genetic Algorithms were capable to overcome the voltage by 98.50%, 98.40%, and 94.15% in single-phase, two-phase, and three-phase appropriately. On the other hand, Fuzzy Inference System was capable to overcome the voltage by 98.15%, 92.15%, and 90.75% in single-phase, two-phase, and three-phase appropriately. While, proportional Integrative was capable to overcome the voltage by 98.05%, 85.80%, and 80.00% in single-phase, two-phase, and three-phase appropriately. Among them, the best performance was obtained from the Genetic Algorithms method in order to mitigate voltage sag. Consequently, D-STATCOM was substantiated as a fancy compensator for the reactive power requirement of the load. Furthermore, it is to be hoped that in future this proposed distribution system device will be established as a new proficient customer power device commercially.From the result analysis, it can be concluded that GA showed to be a better performance for solving voltage sag problem than FIS and PI controller.
KEYWORDS: Distribution Static Compensator (D-STATCOM), Proportional Integral (PI), Fuzzy Inference Systems (FIS), Genetic Algorithms (GA), Voltage Sag.
I.INTRODUCTION
Power quality is one of major concern in the present era. It has become important, especially, with the introduction of sophisticated devices, whose performance is very sensitive to the quality of power supply. The power quality problem is an occurrence manifested as a nonstandard voltage, current or frequency that results in a failure of end use equipments [1]. Power quality problems comprise a wide range of disturbances such as voltage sags/ swells, flicker, harmonics, distortion, impulse, transient and interruptions. Among this problem, voltage sags is the most commonly occurring problems in terms of power quality problems. The IEC electro technical vocabulary, IEC 60050- 604, 1998 defines a voltage sag as any “sudden reduction of the voltage at a point in the electrical system, followed by voltage recovery after a short period of time, from half a cycle to a few seconds”. Likewise, in more explicitly, A sag, as defined by IEEE Standard 1159, IEEE Recommended Practice for Monitoring Electric Power Quality, is “a decrease in RMS voltage or current at the power frequency for durations from 0.5 cycles to 1 minute, reported as the remaining voltage”. Typical values are between 0.1 p.u. and0. 9 p.u. Typical fault clearing times range from three to thirty cycles depending on the fault current magnitude and the type of over current detection and interruption. Actually, Voltage sags are appearing due to faults, motor starting , and transformer energizing.
D-STATCOM model was developed using MATLAB/Simulink environment, Simulation results were presented to demonstrate the voltage sag of the D-STATCOM. [7].
II. BASIC THEORY
A. D-STAT CO M
A distribution static compensator (D-STATCOM) is the most efficient and effective modern custom power device used in power distribution system. Its appeal includes lower cost, smaller size, and its fast dynamic response to the disturbance. D-STATCOM consists of a voltage source converter (VSC), a DC energy storage device (ESD), a coupling transformer connected in shunt to the distribution system through a coupling transformer. The VSC converts the DC voltage across the storage device into a set of three phase AC output voltages. These voltages are in phase and coupled with the AC system through the reluctance of the coupling transformer. Suitable adjustment of the phase and magnitude of the STATCOM output voltages allows effective control of active and reactive power exchanges between the D-STATCOM and the AC system. Such configuration allows the device to absorb or generate controllable active and reactive power. As shown in figure 1[3].
Figure 1 Schematic Representation of D-STATCOM [3].
B. PROPORTIONAL INTEGRATIVE (PI) CONTROLLER
The aim of the control A proportional integrative (PI) scheme is to maintain constant voltage magnitude at the point where a sensitive load is connected, under system disturbances. The control system only measures the r.m.s voltage at the load point, i.e., no reactive power measurements are required. The VSC switching strategy is based on a sinusoidal PWM technique which offers simplicity and good response. Since custom power is a relatively low-power application, PWM methods offer a more flexible option than the Fundamental Frequency Switching (FFS) methods favoured in flexible alternating Current transmission systems (FACTS) applications. Besides, high switching frequencies can be used to improve on the efficiency of the converter, without incurring significant switching losses. The controller input is an error signal obtained from the reference voltage and the value rms of the terminal voltage measured. Such error is processed by a PI controller the output is the angle δ, which is provided to the PWM signal generator. It is important to note that in this case, indirectly controlled converter, there is active and reactive power exchange with the network simultaneously: an error signal is obtained by comparing the reference voltage with the rms voltage measured at the load point. The PI controller process the error signal generates the required angle to drive the error to zero, i.e., the load rms voltage is brought back to the reference voltage.As shown in figure 2 [4].
PI Controller (proportional-integral controller) is a close loop controller which drives the plant to be controlled with a weighted sum of error and integral that value. PI Controller has the benefit of Steady-state error to be zero for a step input.
Output of comparator = V ref – V in (1)
Where,
V ref: Equal 1 per unit voltage reference. V in : Voltage in 1 per unit at the load terminals.
controller in MATLAB.
Figure 2 Simulink Model of PI Controller.
C. FUZZY INFERENCE SYSTEM (FIS)
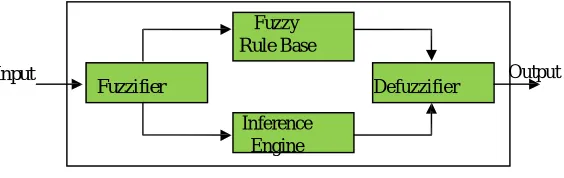
Fuzzy inference systems (FIS) are one of the most famous applications of fuzzy logic and fuzzy set theory. They can be helpful to achieve classification tasks, offline process simulation and diagnosis, online decision support tools and process control. The strength of FIS relies on their twofold identity. On the one hand, they are able to handle linguistic concepts. On the other hand, they are universal approximates able to perform nonlinear mappings between inputs and outputs. These two characteristics have been used to design two kinds of FIS. The first kind of FIS to appear focused on the ability of fuzzy logic to model natural language. These FIS contain fuzzy rules built from expert knowledge and they are called fuzzy expert systems or fuzzy controllers, depending on their final use. Prior to FIS, expert knowledge was already used to build expert systems for simulation purposes. These expert systems were based on classical Boolean logic and were not well suited to managing the progressiveness in the underlying process phenomena. Fuzzy logic allows grading rules to be introduced into expert knowledge based simulators. It also points out the limitations of human knowledge, particularly the difficulties in formalizing interactions in complex processes [5]. Fuzzy inference is the process of formulating the mapping from a given input to an output using fuzzy logic. The mapping, then provides a basis from which decisions can be made, or patterns discerned. [6]. The fuzzy inference system is shown in Figure 3.
Fuzzy Rule Base
Input Output
Fuzzifier Defuzzifier
Inference Engine
Figure 3 Fuzzy Inference System [6]
Error Calculation The error is calculated from the difference between supply voltage data and the reference voltage data. The error rate is the rate of change of error. The error and error rate are defined as:
Error = Vref – VS (2)
Error rate = error (n) – error (n-1) (3)
Where is:
Vref is voltage References. VSis voltage Source. Error is Error supply.
Figure 4(FLC) Scheme
D. GENETIC ALGORITHMS (GA)
Genetic Algorithms are reliable and robust methods for searching solution spaces. They are inspired by the biological theory of evolution through natural selection and much of the terminology is similar. (Milanovic, and Zhang, 2010). Genetic Algorithm Basics
A chromosome is an encoded string of possible values for the parameters to be optimized. These chromosomes can be made up of real-valued or binary strings. Often one of the main challenges in designing a genetic algorithm to find a solution to a problem is finding a suitable way to encode the parameters. A set of potential solutions, called a population, is created. Each member of this set is referred to as an individual and they are evaluated by decoding the parameter values from the chromosomes and applying them to the problem to see how well they perform the task at hand (the objective that is to be optimized). The score that an individual achieves at performing the required task is called its fitness.
After the fitness of each individual has been calculated, a procedure known as selection is performed. Individuals are selected to contribute towards creating the next generation, the probability of selection being related to the individual’s fitness.
Once selection has occurred, crossover takes place between pairs of selected individuals. The strings of two individuals are mixed. In this way, new individuals are created that contain characteristics that come from different here for relatively successful individuals.
A third operation that occurs is mutated, the random changing of bits in the chromosome. It is generally performed with a relatively low probability. Mutation ensures that the probability of searching a given part of the solution space is never zero. There are many ways in which these different operations can be applied. Different algorithms can be used for each and they can also be applied with varying degrees of probability. Some of the more popular algorithms for each of these operations are now examined and their effects on the GA’s performance is investigated.
GA as a powerful and widely applicable stochastic search and optimization techniques, starts with a population of randomly generated candidates and evolves towards a solution, is perhaps the most broadly known types of evolutionary computation method today. In 1960 the first serious investigation into Genetic Algorithms (GAs) was undertaken by John Holland. Genetic algorithms have become popular due to self-adaptive control systems, function optimization problems, computationally simple. The search method they use is robust since it is not limited like other search methods with regard to assumptions about the search space.
G(s) = ( ) (4) Where is:
Ki is constant integration Kp is constant proportional Fc is the viscous fiction coefficient P is the pole pairs
Lr is the load of root G(s) = genetic system
III. METHODS
The aim of the control system is to maintain voltage magnitude at the point where a sensitive load is connected under system disturbances. Voltage sags is created at the load terminals via a three-phase fault.The above voltage problems are sensed separately and passed through the sequence Analyzer. The control system of the general configuration typically consists of a voltage correction method which determines the reference voltage injected by D-STATCOM.
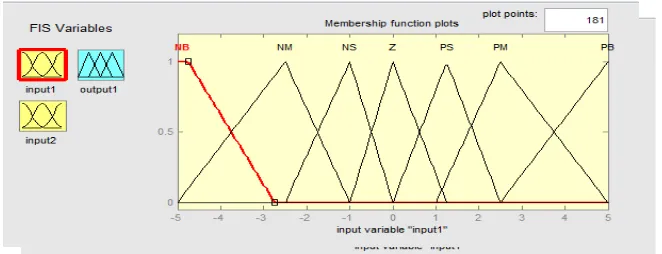
FIS has two inputs and one output, the input consisting of 5 members and output fuzzy consists of 5 members. Where the input variables in the range [-5 5], while the output variable in the range [-10 10].
A process for constructing a FIS can be summarized as follows: I. Choose a specific type of FIS (Mamdani or Sugeno) II. Select relevant input-output variables
III. Determine the number of linguisticTerms associated with each input-output variable (determine the membership function for each linguistic term)
IV. Design a collection of fuzzy if-then rules V. Choose thedefuzzification method.
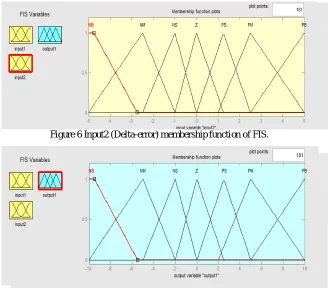
Fuzzification is an important concept in the fuzzy logic theory. Fuzzification is the process where the crisp quantities are converted to fuzzy. Thus Fuzzification process may involve assigning membership values for the given crisp quantities. This unit transforms the non-fuzzy (numeric) input variable measurements into the fuzzy set (linguistic) variable that is a clearly defined boundary, without a crisp (answer). In this simulation study, the error and error rate are defined by linguistic variables such as negative big (NB), negative medium (NM), negative small (NM), zero (Z), positive small (PS), positive medium (PM) and positive big (PB) characterized by membership functions given in this Figure.
Figure 6 Input2 (Delta-error) membership function of FIS.
Figure 7 output membership function of FIS.
There are 49 rules for FIS. The output membership function for each rule is given by the Min (minimum) operator. The Max operator is used to get the combined FIS output from the set of outputs of Min operator .The output is produced by the fuzzy sets and fuzzy logic operations by evaluating all the rules.
Table 1 Fuzzy Rules
Error Delta-
error
NB NM NS Z PS PM PB
NB NB NB NB NM NM NS Z
NM NB NB NM NM NS Z PS
NS NB NM NM NS Z PS PM
Z NM NM NS Z PS PM PM
PS NM NS Z PS PM PM PB
PM NS Z PS PM PM PB PB
IV. SIMULATION AND RESULT
To enhance the performance of the distribution system, D-STATCOM is connected to the distribution system. D- STATCOM is designed using MATLAB, Simulink version R2012b. As shown in figure8
Figure 8 Simulink Model For D-STATCOM
The system was designed based on D-STATCOM as a controlled reactive source, which includes a Voltage Source Converter (VSC) and a DC link capacitor connected in shunt, capable of generating and/or absorbing reactive power. Indeed, it was used to compensate the power system disturbances such as voltage sags. Practically, the Table 2shown parameters of system.
Table 2 Parameters of MATLAB Simulink
1 Voltage Source 230Kv
2 Frequency 50Hz
3 Line impedance 0.001Ω, 0.005H
4 DC voltage 5000V
5 Capacitor 750µF
6 Load1 0.5MW,0.2MVAr
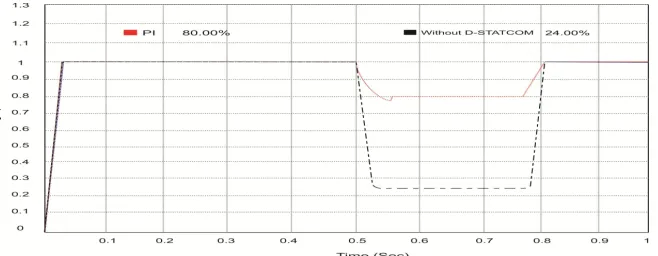
The figure 9 below elucidates the simulation result in terms of PI Controller with STATCOM and without D-STATCOM. The X-axis and Y-axis have been represented by time (Sec) and voltage (p.u). Informed that D-STATCOM with PI has red color and a D-STATCOM without PI has black color.
From figure 9, it has been clarified the output voltage of the D-STATCOM at the first case the simulation was running without D- STATCOM its noted that in 0.5 to 0.8 Sec, voltage dropped to (24.00%) cause of voltage of consumer equipment and industrial equipment, in the next case was tested by using the D-STATCOM with PI controller which has better performance and improved dramatically when the PI injected into the system the voltage switched to (80.00%) voltage. Therefore, this research greatly supports for applying D- STATCOM approach for the mitigation of voltage sag.
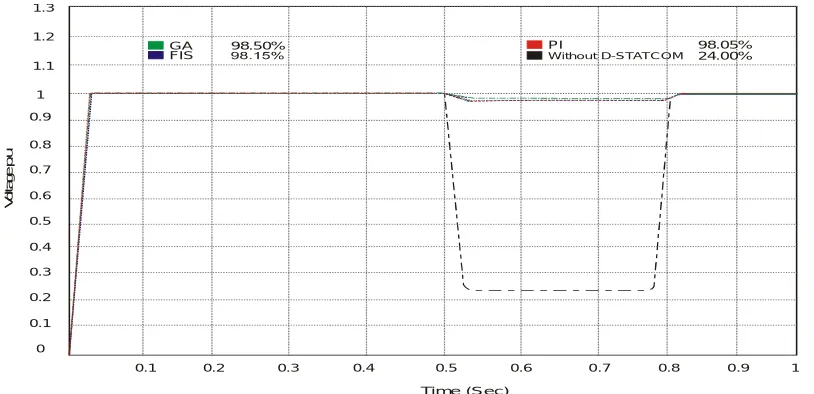
The figure 10 below illustrates the single fault scenario result of absence of D-STATCOM method and comparison among three other methods, namelythe PI controller, which has red color, FIS was indicted by the blue color, and GAwere indicated by green color. Here, The X-axis and y-axis are represented by time (Sec) and voltage (p.u) respectively.
Figure 10 Single phase fault scenario Result of comparison uses the PI Controller, FIS and GA
.
From above figure presented the output voltage of single phase The simulation result was started from 0 Sec to 1 Sec and tested with three methods to solve the voltage sag at 0.5 to 0.8 which was given 24% without D-STATCOM, and D_STATCOM with PI when injected into the system was 98.05%. In the two other methods FIS and GA have been done by the same simulation with PI, it's noted that the D-STATCOM with FIS was raise the voltage sag to 98.15% which has better performance than PI controller. Moreover, by using the D-STATCOM with GA method found that the performance better than PI and FIS methods. The best execution was shown by GA methodthe voltage sag dramatically improved to 98.50 %. Surprisingly, Without D-STATCOM, recovery of voltage per unit was found only(24.00%). Thus, it can be recommended that D-STATCOM applying the GA method is a very promising approach in the context of single phase fault scenario outcomes.
The figure 11 below illustrates the single fault scenario result of absence of D-STATCOM method and comparison among three other methods, namely the PI controller, which has red color, FIS was indicted by the blue color, and GA were indicated by green color. Here, The X-axis and y-axis are represented by time (Sec) and voltage (p.u) respectively.
1.1
1
0.9
0.8
0.7
0.6
0.5
0.4
0.3
0.2
0.1
0
0.1 0.2 0.3 0.4 0.5 0.6 0.7 0.8 0.9 1
V
o
lt
a
g
e
p
.u
Time (Sec)
GA 98.50%
FIS
PI 98.05%
Without D-STATCOM 24.00% 1.2
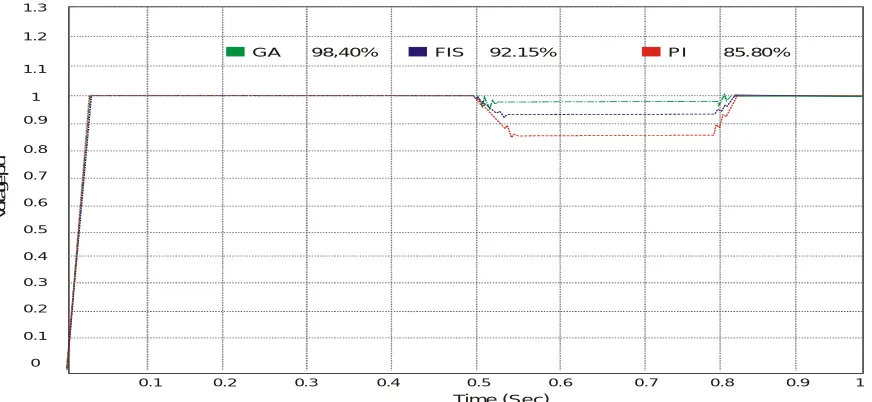
Figure: 11 Two phase fault scenario Result of comparison use the PI Controller, FIS and GA.
From above figure presented the output voltage of two phases The simulation result was started from 0 sec to 1 sec and tested with three methods to solve the voltage sag at 0.5 to 0.8 which was given 24.00% without D-STATCOM, and D_STATCOM with PI when injected to the system was 85.80%. In the two other methods FIS and GA have been done by the same simulation with PI, it's noted that the D-STATCOM with FIS was raise the voltage sag to 92.15% which has better performance than PI controller. Moreover, by using the D-STATCOM with GA method found that the performance better than PI and FIS methods. The best execution was shown by GA method the voltage sag dramatically improved to 98.40%.
The figure 12 below explains the three phase fault scenario result of comparison among three other methods, namely the PI controller, FIS, and GA. Here, The X-axis and y-axis are represented by time (sec) and voltage (p.u) respectively
.
Figure 12 Three phase fault scenario result of comparison uses the PI Controller, FIS and GA.
In figure 12 presented the output voltage of three phases The simulation result was started from 0 sec to 1 sec and tested with three methods to solve the voltage sag at 0.5 to 0.8 which was given 24.00% without D-STATCOM, and D_STATCOM with PI when injected to the system was 80.00%. In the two other methods FIS and GA have been done by the same simulation with PI, it's noted that the D-STATCOM with FIS was raise the voltage sag to 90.75%
Time (Sec) 1.1 1 0.9 0.8 0.7 0.6 0.5 0.4 0.3 0.2 0.1 0
0.1 0.2 0.3 0.4 0.5 0.6 0.7 0.8 0.9 1
GA 98,40% FIS 92.15% PI 85.80%
V o lt a g e p .u 1.2 1.3 1.1 1 0.9 0.8 0.7 0.6 0.5 0.4 0.3 0.2 0.1 0
0.1 0.2 0.3 0.4 0.5 0.6 0.7 0.8 0.9 1
GA 94.15% FIS 90.75% PI 80.00%
which has better performance than PI controller. Moreover, by using the D-STATCOM with GA method found that the performance better than PI and FIS methods. The best execution was shown by GA method the voltage sag dramatically improved to 94.15%.In a nutshell, it can be attained that in case of all phases such as single, two and three phase scenario results, GA method linked with D-STATCOM has been incarnated as a best method among the applied three methods. As a result, GA method integrated with D-STATCOM can be supported using this approach widely for the mitigation of voltage sag problem.
V. CONCLUSION
To sum up., a promising device (D-STATCOM) using three methods such as Genetic Algorithm (GA), Fuzzy Inference Systems (FIS), and Proportional Integral (PI) was designed this research to compensate the voltage sag. The results showed that D-STATCOM with GA was 98.50%, 98.40%, and 94.15% in single-phase, two-phase, and three-phase within the range of 0.5-0.8 second, respectively. Similarly, D-STATCOM with FIS was competent to outplay the voltage around 98.15%, 92.15%, and 90.75% of single-phase, two-phase, and three-phase and the potential of D-STATCOM with PI to compensate the voltage was 98.05%, 85.80%, and 80.00% in single-phase, two-phase, and three-phase within the same range like others 0.5-0.8 second, respectively. Subsequently, the findings revealed that GA was the best among the three controlling approaches. It is being obtained as GA is one of the easiest methods and it does not need a set and rules based system as like as FIS System.
REFERENCES
[1] Deshmukh, S. M and Dewani, B. "Overview of Dynamic Voltage Restorer (DVR) for Power Quality Improvement." International Journal of Engineering Research and Applications (IJERA), pp.1372-1377, 2012
[2] Kadam, A. Dhamdhere, S and Bankar, D. "Application of DSTATCOM for Improvement of Power Quality using MATLAB Simulation."International Journal of Science and Modern Engineering. Vol. 1, pp.9-13.ISSN: 2319-6386, 2012.
[3] Rambabu, E. Praveena, E and Kishore, P. "Mitigation of Harmonics in Distribution System Using D-STATCOM."International Journal of Scientific & Engineering Research Vol. 2,pp.1-5, 2011.
[4] Patil, D. R., and Madhale, K. "Design and Simulation Studies of D-STATCOM for Voltage Sag, Swell Mitigation." IRNet Transactions on Electrical and Electronics Engineering: pp. 97-103, 2007.
[5] Sumalatha, V. Ramani, K and Lakshmi, K. V. "Fuzzy Inference System to Control PC Power Failures."International Journal of Computer Applications, Vol. 28, pp.10-17, 2011.
[6] Zanjani, A, M.Shahgholian,Gh.Poodeh, E, M. and Eshtehardiha, S. 2007. Adaptive Integral-Proportional Controller in Static Synchronous Compensator Based on Genetic Algorithm.7th WSEAS International Conference on Electric Power Systems, High Voltages, Electric Machines, pp.40-45.
[7] Milanovic, V, D. and Zhang, Y. 2010. Global Minimization of Financial Losses Due to Voltage Sags With FACTS Based Devices, IEEE Transactions on Power Delivery, Vol. 25, pp. 298-306.
[8] Grefenstette, J, J. 1986. Optimization of control parameters for genetic algorithms. SystemsMan and Cybernetics IEEE Transactions, vol. 16, pp.12
BIOGRAPHY
![Figure 1 Schematic Representation of D-STATCOM [3].](https://thumb-us.123doks.com/thumbv2/123dok_us/7762666.1274948/2.595.177.405.379.470/figure-schematic-representation-of-d-statcom.webp)