$"%$%" &## $
&
%"&#%$
Shuta Tahara1,*
, Hiroshi Toyama1
, Hironori Shimakura2
, and Takanori Fukami1
1
Department of Physics and Earth Sciences, Faculty of Science, University of the Ryukyus, Okinawa 903-0213, Japan
2
Niigata University of Pharmacy and Applied Life Sciences, Niigata 956-8603, Japan
#$"$MD simulation for molten NaNO3 has been performed by using
the Born-Mayer-Huggins-type potentials. The new structural features of molten NaNO3 are investigated by several analytical methods. The
coordination-number and bond-angle distributions are similar to those of simple molten salts such as NaCl except for the variation caused by the different size of the anion and cation. Na+
ions are attracted toward O
ions, and get separated from N+ ions by Coulomb interactions. The distribution
of the dihedral angle between NO3
plannar ionic molecules has also been investigated.
$" %$
NaNO3 consists of Na +
ions and NO3
ionic molecules, where three O
ions in a NO3
-molecule form an equilateral triangle around the central N+
ion with a covalent bond between N+
and O
ions. NaNO3 is a well-known component of explosives. Recently, the molten state of NaNO3 has also been used for fabricating heat-storage materials for application in solar power generation [1-5]. Adya et al. for the first time investigated the microscopic atomic configuration and diffusion in molten NaNO3 by means of X-ray diffraction measurement and molecular dynamics (MD) simulation, and compared its partial structure factors and partial pair distribution functions with those of molten NaNO2 and the eutectic mixture of the NaNO3-NaNO2 system showed good additivity for the intermolecular structure because the ionic radius of NO3 and NO2 ions are similar owing to the presence of a lone pair on the nitrite ion [6]. After Adya et al. [6], several researchers have reported the MD simulation results of molten alkali nitrates [7-12]. For example, Kato et al. have reported cation dependence of the detailed structural features and ionic dynamics in molten alkali nitrates [11]. They have pointed out that the diffusion constant of small cation is larger than that of large anion. In this study, we have performed MD simulations for molten NaNO3, and obtained new structural information by using several analytical methods.
*
%"&##%$
The simulation cell contained 1080 ions (Na+
: 216, N+
: 216, and O
-: 648), and NO3
was assumed as a rigid ionic molecule in the simulation process. The side length of the simulation cell was 25.3358 Å, which corresponds to the experimental density at the respective temperature of 623 K. The system was annealed at 923 K, and then quenched to 623 K. A time step was set as 5 fs. MD simulation was carried out by using LAMMPS software [13].
The pair potentials used for the simulation were Born-Mayer-Huggins type
φij = zizje 2/r +A
ijbexp[-ρ(σi + σj - r)] (1).
The first term on the right-hand side of eq. (1) is Coulomb interaction between ionic
charges, where z and e denote valence and unit charges, respectively. The second term
denotes repulsion between the ions arising from the overlap of the outer shell of electrons, where A, b, ρ, and σ denote the Pauling parameter, a constant, a softness parameter, and an ionic radius, respectively. These potential parameters were taken from Adya et al. [6].
#%$##%##
"$!"#$"%$ %$ #
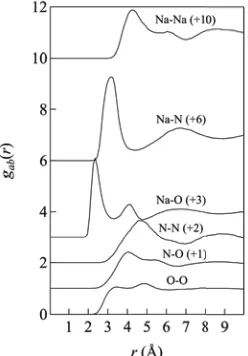
Fig. 1. Partial pair distribution functions gab(r) for molten NaNO3 at 623 K. The inner molecule
interactions for N-O and O-O correlations are not shown for clarity.
Figure 1 shows partial pair distribution functions gab(r) for molten NaNO3. The gab(r) values well reproduce earlier simulation results obtained by Adya et al. [6].We defined the
first-coordination length rc for Na-Na, Na-N, and N-N correlations by using the
Table 1. First-coordination length rc for Na-Na, Na-N, and N-N correlations.
#%'$ #$"%$
Fig. 2. Snapshot of three-dimensional atomic configurations of molten NaNO3 obtained by MD
simulation. Gray spheres denote Na+ ions. Small and large white spheres denote N and O ions,
respectively. N and O ions in a molecule are connected with sticks.
The snapshot of a three-dimensional atomic configuration of molten NaNO3 obtained by
MD simulation is visualized in Fig. 2. In this figure, it can be seen that NO3 molecules are
formed by equilateral triangles made of one N+
and three O
ions. Na+
ions are distributed
between NO3
molecules owing to Coulomb attractions between Na+ and O- ions, which is consistent with the relative shorter first-correlation length of Na-N correlation compared to that of Na-Na and N-N correlations, as shown in Fig. 1. Such a structural feature is similar
to that of simple molten salts such as NaCl. However, the distributions of Na+
and NO3
-ions are slightly asymmetric, because the spectrum patterns of gab(r) for Na-Na and N-N correlations do not fully correspond with each other. For example, the first peak in gNaNais
narrower than that in gNN(r) and has a shoulder at approximately r = 6 Å, which would be
due to the size difference between the Na+ ion and the NO3
ionic molecule.
"$ %" #$"%$ #
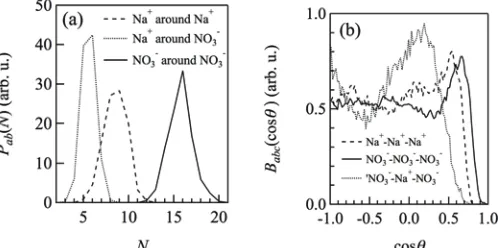
Fig. 2. (a) Coordination-number and (b) bond-angle distributions of Na+
and NO3
ions in molten NaNO3 at 623 K.
Na-Na Na-N N-N
The coordination-number distributions Pab(N) (a, b = N
+
, NO3
-) of molten NaNO3 are
shown in Fig. 2(a). Since the N+
ion is located at the center of the NO3
molecule, the N+
ion is regarded as a NO3
ionic molecule in this statistics, for example, the coordination
number of NO3
molecules around a NO3
molecule is the same as that of N+
ions around a N+
ion. The mean coordination number Nab is summarized in Table 2. The N+- value (= 5.6)
for molten NaNO3 is approximately intermediate between that of molten NaCl (N+- = 4.85)
and CsCl (N+- = 6.1) [14]. This N+- value is consistent with that reported by Kato et al. (N
+-= 5.7), but larger than that for molten LiNO3 (5.0) [11]. The N++ value for molten NaNO3 is
smaller than the N-- value because the first correlation length of Na-Na correlation defined
in Sec. 3.1 is shorter than that of N-N correlation. When we consider the shoulder at the high-r side of the first peak in gNaNa(r), the N-- and N++ are similar to each other. Therefore,
the relation between N-- and N++ largely depends on the definition of the first correlation
length of N-N and Na-Na correlations. The N-- values of molten NaCl and CsCl are
approximately 14 and 17 [14], respectively; therefore, the N-- value of molten NaNO3 is
also similar to that of simple molten salts.
Fig. 2(b) shows the bond-angle distribution Babc of molten NaNO3. The peaks of B+++, B
-+-, and B--- are found at approximately cosθ = 0.51 (θ = 59°), 0.17 (θ = 80°), and 0.65 (θ =
49°), respectively, which is also similar to those of simple alkali halides [14]. For molten NaCl and CsCl, the spectral patterns of B+++ and B--- are almost the same. The difference in
the peak positions of B+++ and B--- for molten NaNO3 reflects the difference in the size of
the cation and anion. According to Kato et al. [11], B+-+ for molten NaNO3 can be estimated
to be 60-90°, which is consistent with our analysis results. Smaller B+-+ has been observed
for molten LiNO3 [11] due to the smaller size of the Li ion than the Na ion. The B+++ and B
--- values of molten NaNO3 have not been reported as yet.
Table 2. Mean coordination number Nab (ab = ++, +-, --), where + and - denote the Na +
ion and the NO3
ionic molecule, respectively.
#$"%$ #" % %
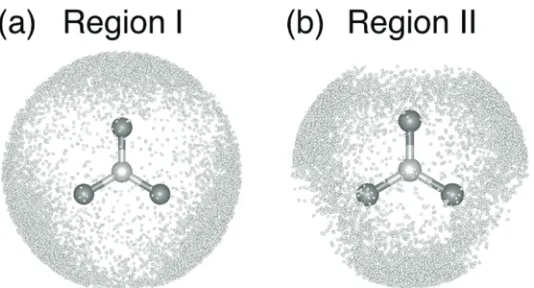
Fig. 3. Statistical distribution of Na+ ions around a NO 3
- ionic molecule in regions (a) I (3.1 < r NaN <
3.4 Å) and (b) II (2.8 < rNaN < 3.1 Å) for molten NaNO3 at 623K. The ionic sizes depicted are smaller
than the real size for clarity.
The statistical coordinates of Na+
ions around a NO3
molecule within the spherical regions I (3.1 < r < 3.4 Å) and II (2.8 < r < 3.1 Å) were obtained (Fig. 3); regions I and II
++ +- --
correspond to the top and bottom of the first peak in gNaN(r), respectively. In region I, Na +
ions are gathered around O
ions because of the Coulomb attraction. In contrast, the distribution of Na+
ions in the region II is reverse of that in the region I, because the repulsion of Na-O pairs due to the second term of the right-hand side of eq. (1) becomes
larger than the Coulomb attraction. In both of the regions I and II, Na+
ions are not observed near the N+
ion due to the repulsion between Na+
and N+
ions; the entire right-hand side of eq. (1) shows this repulsion. Such strucutural features are consistent with the analysis results of the cation distribution function around a NO3
molecule reported by Kato et al. [11]. The cationic distributions shown in Fig. 3 would help readers in imaging the cation distribution.
%" "$$ ""$
Since NO3
is a planar ionic-molecule, the orientation of the molecule can be determined by a normal vector of the plane. The information on the molecular-orientation correlations
between NO3
molecules is obtained by considering the statistics of dihedral angles θ
calculated by the inner product of two normal vectors, where θ is an angle between the
normal vectors of NO3
molecules. When θ = 0, two molecules are parallel to each other. However, when θ = 90°, the molecules are perpendicular to each other. In this study, two spherical regions III (4.4 < rNN < 4.6 Å) and IV (3.0 < rNN < 3.2 Å) around the N
+
ion in a central NO3
molecule are defined as regions that correspond to the top and bottom of the first peak in gNN(r), respectively. Distance between N
+
ions is regarded as the distance
between NO3
molecules. The dihedral angle formed by a central molecule and another molecule in the region III (or IV) is calculated as shown in Fig. 4.
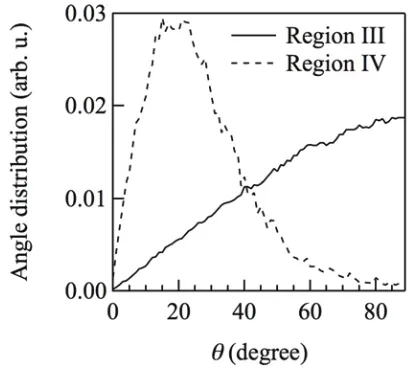
Fig. 4. Distribution of the dihedral angle θ (degree) between NO3
ionic molecules.
For the region III, the distribution monotonically increases with increasing θ, and no
characteristic peak is observed. In contrast, for the region IV, a characteristic peak is observed at approximately θ = 20°. It is difficult for two NO3
ionic molecules to come close to each other within the region III because of their size and shape; however, two NO3
%"&
The MD simulation for molten NaNO3 was carried out by using the Born-Mayer-Huggins-type potentials. After confirming that the gab(r) value obtained by the MD simulation well reproduced the results reported in literature, we attempted to obtain the new structural information. We visualized three-dimensional ionic configurations, and showed that Na+ ions are distributed between NO3 ions, which is similar to simple molten salts such as NaCl. The coordination-number and bond-angle distributions are similar to those of simple molten salts, except for the variation caused by the different size of the cation and anion. Na+
ions are basically attracted by O
ions, and are separated from N+
ions. When two NO3
-ions are close to each other, it is need that the dihedral angle of the molecules becomes small.
"#
1. C. Y. Zhao, Z. G. Wu, Sol. Energy Mater. Sol. Cells, 95, 3341 (2011)
2. T. Wang, S. Viswanathan, D. Mantha, R. G. Reddy, Sol. Energy Mater. Sol. Cells, 102, 201 (2012)
3. D. Mantha, T. Wang, R. G. Reddy, Sol. Energy Mater. Sol. Cells, 118, 18 (2013) 4. A.G. Fernández, S. Ushak, H. Galleguillos, F. J. Pérez, Sol. Energy Mater. Sol. Cells,
132, 172 (2015)
5. P. Zhang, X. Xiao, Z. N. Meng, M. Li, Appl. Energy 137, 758 (2015)
6. A. K. Adya, R. Takagi, K. Kawamura, M. Mikami, J. Mol. Phys. 62, 227 (1987) 7. T. Kato, K. Machida, M. Oobatake, S. Hayashi, J. Chem. Phys. 89, 3211 (1988) 8. T. Kato, K. Machida, M. Oobatake, S. Hayashi, J. Chem. Phys. 89, 7471 (1988) 9. T. Kato, K. Machida, M. Oobatake, S. Hayashi, J. Chem. Phys. 92, 5506 (1990) 10.T. Kato, K. Machida, M. Oobatake, S. Hayashi, J. Chem. Phys. 93, 3970 (1990) 11.T. Kato, S. Hayashi, M. Oobatake, K. Machida, J. Chem. Phys. 99, 3966 (1993) 12.G. Vohringer, J. Richter, Z. Naturforsch. 56 a, 337 (2001)
13.S. Plimpton, J. Comput. Phys. 117, 1 (1995)