A Transcriptomic Method to determine Airway immune dysfunction
in T2-High and T2-Low Asthama
Khadhim Ahmed Khadhim Alhamad& Dr. A. Krishna Satya
1M.Sc., (Nano Biotechnology) 2 , Assistant Professor 1,2Department of Bio Technology
AcharyaNagarjuna University, Andhra Pradesh, India
Email:- [email protected]
Abstract
Although a large number of studies of asthma had been conducted, the etiology of childhood asthma is not yet established. In this review, we examine whether Type 2 inflammation modifies airway function to make patients more susceptible to asthma exacerbations. The best data supporting a role for Type 2 inflammation in asthma exacerbations come from clinical trials of inhibitors of Type 2 inflammation in asthma.
Type-2 (T2) inflammation drives airway
dysfunction in many asthma patients, yet a comprehensive understanding of the airway immune cell types and networks that sustain this inflammation is unknown. Moreover, defects in the airway immune system in asthmatics without T2 inflammation are not established. Every day asthma reportedly results in 40,000 missed school
or work days, 30,000 asthma
attacks, 5,000 emergency room visits, 1,000
hospital admissions, and 11 deaths.
Keywords:- Asthma; sputum gene expression; dendritic cells; age; type-2 inflammation
Introduction
Asthma is a quickly developing medical issue in both the developed and developing world. This rapid increment, noted in many territories of the world, recommended that there are incredible natural elements at work that are adding to or driving the asthmatic infection process. Asthma is a standout amongst the most widely recognized constant maladies of adolescence, influencing in excess of 6 million youngsters. Asthma is an endless provocative lung sickness that can cause rehashed scenes of hack, wheezing and breathing trouble. Amid an intense asthma scene, the
aviation route lining in the lungs ends up kindled and swollen. Likewise, bodily fluid generation happens in the aviation route and muscles encompassing the aviation route fit. Consolidated, these reason a decrease in wind current.
The most recent decade has
The connection of these highlights of asthma decides the clinical appearances and seriousness of asthma and the reaction to treatment. Asthma is a complex multifactorial illness in which unfavorably susceptible components and non-hypersensitive triggers interface, bringing about bronchial block and irritation. Asthma is the main unending ailment of children in modern nations; in any case, the illness is additionally normal in children in developing nations2. Acute symptoms of asthma usually arise from bronchospasm and require and respond to bronchodilator therapy. Acute and chronic inflammation can affect not only the airway caliber and airflow but also underlying bronchial hyperresponsiveness, which enhances susceptibility to bronchospasm3.
aviation routes of T2-high asthmatics. In this manner, next to no is known with respect to how aviation route T2 irritation is kept up in human asthma.
Fig 1: Airway Inflammation And The Clinical Symptoms And Pathophysiology Of Asthma
Bronchial asthma is now widely recognized as a heterogenous clinical syndrome consisting of various disease phenotypes. Each Asthma phenotype may have distinct observable molecular, celular, morphogical, functional, and clinical feature, all of which can be possible integrated into specific biological mechanisms, called as endotypes. Although differentiating asthma into various phenotypes/endotypes remains speculative so far, these concepts of separation may be useful in characterizing and predicting disease severity, progression, and response to general and specific therapies including biological medications. This is particularly important for severe asthma patients who are refractory to current standard therapies including inhaled and sytemic corticosteroids(CS) and bronchodilators.
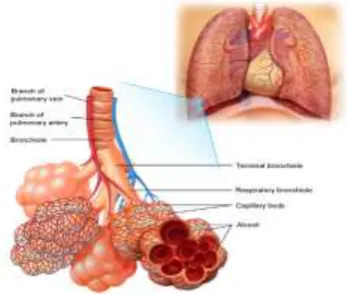
Fig 1 : Diaphram of Lung
The bronchi divide into smaller bronchi, and then into bronchioles which ultimately terminate in the alveoli – the folded membranes where gas exchange takes place. The bronchi and bronchioles have a muscular layer in the wall which allows
them to contract. In an acute asthma attack, this muscular layer contracts and leads to narrowing of the airways. Inflammation may still be present between asthma attacks. This makes the airways sensitive and more likely to react to asthma triggers and cause an acute asthma attack.
Fig 2: The diagram shows that lungs look like inside. Breathed air goes from the trachea into the two main airways(bronchi). From there it goes through the small bronchioles to the airspaces (Alveoli) and then is absorbed into the blood stream.
Asthma is sometimes divided into four main groups as follows:
Atopic asthma: This is the most common and classic type of asthma. Patients normally have relatives who have atopic asthma, and themselves experience other allergic diseases
Non-atopic asthma: This type is triggered by respiratory infections in patients without a family history or other allergic traits.
Drug-induced asthma: Aspirin
medication can sometimes induce asthma attacks and urticaria in susceptible individuals.
Occupational asthma: This form of asthma is induced by small quantities of chemicals and fumes, usually following repeated exposure.
periodic requirement for treatment, yet a little extent of individuals have serious asthma, with rehashed admission to emergency clinic and a confined way of life. Luckily an extraordinary larger part of individuals with Asthma can have a typical existence, either free from indications or with insignificant side effects
A. Tightening of Airways from muscle spasm with reduced space.
B. Swelling of walls, with produciton of thick mucus
Fig 3 In Asthma the airways narrow owing to spasm(tightening) of the muscles around them and swelling of the lining and sticky mucus inside them.
Blood tests
While there are no blood tests that should be possible to analyze asthma, some can help decide if you have a hypersensitive propensity, (for example, absolute IgE estimations) or can enable your specialist to choose which treatment is generally suitable.
RAST tests take a gander at the blood's reaction to specific allergens and can help figure out what you are unfavorably susceptible to.Your full blood tally may demonstrate raised dimension of eosinophils, which happens in asthma and other hypersensitive conditions.
1.6.2 Chest x-beam
Once more, this examination does not analyze asthma, however a chest x-beam might be helpful
to avoid different reasons for side effects (for example pneumothorax), or to distinguish an uncommon reason for asthma (for example hypersensitive bronchopulmonary aspergillosis). 1.6.3 Spirometry
Spirometry and other lung work tests are the primary indicative apparatuses in asthma. Spirometry estimates the volume took in and out amid motivation and lapse, and can enable your specialist to decide if there is hindrance.
Your specialist will test your lung work when taking a bronchodilator prescription. In the event that your lung work improves, it is exceedingly suggestive of asthma.
Another estimation, called top expiratory stream rate (PEFR), is valuable for checking your lung work after some time and exhibiting the inconstancy in lung work that is normal for asthma.
1.6.4 Exercise tests
A few patients just experience asthma manifestations amid exercise. Your specialist may perform spirometry when you do work out. This can help analyze work out prompted asthma. 1.6.5 Lung incitement tests
All around once in a while, your specialist may play out a test that includes you breathing in little measures of histamine or methacholine, at that point taking estimations of your lung work occasionally with spirometry.
The hypothesis behind this test is that patients with asthma have hyper-receptive aviation routes, so little dosages of these operators can prompt narrowing of the aviation routes. A decrease of lung work with expanding portions of these operators underpins the finding of asthma. This test is normally possibly done if spirometry doesn't deliver adequate outcomes.
1.6.6 Skin prick tests
touchiness to the allergen. This may recognize hypersensitive asthma triggers. Normal allergens tried for by skin prick tests incorporate residue bug, feline, hound, grass pollens and shape.
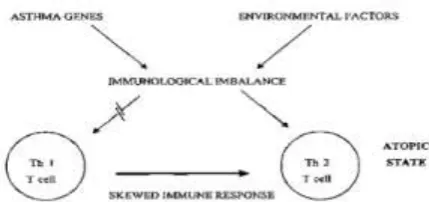
Environment Interaction in Pathogenesis of Asthma
The environment plays a dominant role in the development of Asthma and allergic disorders, the genertic makeup of an indivdual appears to influence the initiation and perpetuation of these disease process. Scientists are now paying increasing attention to studying the involvement of “genertic factors” in order to gain fresh insights into the etiology and pathogenesis of Asthma Allergy.
There is complelling evidence demonstrating that Asthma is a heritable disorder with a major genetic component. A child born to a family with one asthmatic parent has a risk of developing the disease several times greater than that of a child born into a nonasthamtic family. The risk is greater still if both parents with Asthma. However, all children born to Asthmatic parents do not develop the disease. It has been suggested that rather than directly causing Asthma, the “Asthma genes” create a susceptibility or vulnerability to Asthma with which environmental factors interact, leading to the development of Asthma disease state. The Identification of “culprit” genes involved in the Asthma disease process should provide us with valuable clues into both the prevention and treatment aspect of Asthma. As powertool of genertic analysis are brought to bear on the problem and the genes are involved are identified.
The mere presence of a gene does not guarantee its phenotypic expression, since the environment plays a critical role in controlling the degree of expression of one’s genetic potential. A person’s height, for example is controlled by multiple genes; but unless the individual has good nutrition and enjoys good health, his or her height may fall short of the inherent potential. Thus attaining one’s genertic potential depends on gene-environment interaction4.
Figure: Immunological imbalance from gene-environement interaction creating a T-helper cell(type2) skewing that favors the atopic/asthma state Th1, T-helper type 1, Th2, T-helper type 2
Figure 4 Environmental factors interacting with Multiple Asthma “susceptibility” genes(1-n) generating various elements of the Asthma Phenotype.
CHAPTER THREE
Methods 3.1 Methods
A full description of methods is provided in the online supplementary material.
3.2 Study design
We obtained transcriptomic data from sputum cells obtained from 104 participants (online supplementary table S1) with moderate-to-severe asthma and 16 healthy volunteers (HV group) from the U-BIOPRED cohort. The study was approved by the ethics committees of the recruiting centres. All participants gave written informed consent.
3.3 Analysis of sputum “omics”
extracted from sputum cells. Proteomic profiling of sputum supernatants was performed using the SOMAscan proteomic assay.
3.4 Computational analysis of transcriptomic features
Data were uploaded and curated in the tranSMART system. We analysed 508 DEGs from a pairwise comparison of gene expression in asthmatic subjects with high sputum eosinophil counts (≥1.5%), in asthmatic subjects with low eosinophil counts (<1.5%) and in the HV group, and online supplementary table S1). The intensity of the raw probe sets were log2transformed and
normalised by the robust multiarray average method. A regression-based method was used to analyse DEGs with respect to the groups of interest, and batch/technical effects, age, sex and administration of oral corticosteroid were adjusted for as covariates in the linear model. The false discovery rate using the Benjamini–Hochberg method was applied for p-value adjustment in relation to multiple tests
3.5 Benjamini–Hochberg method
As per Golub et al (1999) there has been considerably growth on analysis of gene expression and microarray data. At the beginning of microarray data analysis, research focused on clustering of genes and individuals on the basis of similar outcomes. In the termininology of statistical learning this is called unsupervised learning. Another approach involves the analysis of differentially expressed genes, that is, finding differences in gene expression levels between subgroups of individuals on the basis of similar outcomes. In the thereminology of statistical learning this is called unsupervised learning. Another approach involves the analysis of differentially expressed genes, that is, finding differences in gene expression between healthy tissue and tumor samples might be of interest. Statistical significance of differential genes expression can be tested by performance a hypothesis test for each of the m genes of the microarray, starting with a collection of null hypothesis.
The Benjamini-Hochberg Procedure is an integral asset that diminishes the bogus disclosure rate. Modifying the rate controls for the way that occasionally little p-values (under 5%) occur by shot, which could lead you to inaccurately dismiss the genuine invalid theories. As such, the B-H Procedure causes you to keep away from Type I mistakes (false positives). A p-estimation of 5% implies that there's solitary a 5% chance that you would get your watched outcome if the invalid hypothesis were valid. At the end of the day, on the off chance that you get a p-estimation of 5%, it's exceedingly far-fetched that your invalid hypothesis isn't valid and ought to be tossed out. Be that as it may, it's just a probability– ordinarily, genuine invalid theories are tossed out in light of the irregularity of results. A solid precedent: Let's say you have a gathering of 100 patients who you know are free of a specific disease. Your invalid hypothesis is that the patients are free of disease and your other is that they do have the disease. In the event that you ran 100 measurable tests at the 5% alpha dimension, generally 5% of outcomes would report as false positives. There's not a great deal you can do to dodge this: when you run measurable tests, a portion will dependably be false positives. Notwithstanding, running the B-H method will diminish the quantity of false positives.
The Benjamini-Hochberg Procedure is an integral asset that diminishes the false discovery rate. Altering the rate controls for the way that occasionally little p-values (under 5%) occur by possibility, which could lead you to inaccurately dismiss the genuine invalid speculations.
The Benjamini-Hochberg straight advance up methodology for con-trolling the false discovery rate The Benjamini-Hochberg Linear Step Up(LSU) technique is intended to control the False Discovery Rate, the normal value of the false discovery extent, i.e., FDR=E (FDP ). The FDR is at most equivalent to FWER and FDR=FWER when all tests are non-significantion truth.
Our elective calculation to the LSU, Fast LSU , performs straight outputs rather than sorting p-values, yet considers the general size of the testing issue. Fast LSU tiles theLSU system to give one worldwide arrangement of results that does not differ from applying LSU to the entire set of tests. Our calculation tends to a similar target work as the first. Our approach is provably quicker than the traditional methodology that depends on arranging p-values .It may likewise be utilized on discretionary pieces of subjective size with a self-assertive space constraint in request to restore a similar arrangement of significant results as those from applying LSU to the entire set of tests. In the following segment we address the difference among gathering and lumping tests and the difficulty in self-assertively lumping tests by giving instances of inflation of sort I error.In segment 3 we present Fast LSU on a solitary arrangement of tests and demonstrate its proportionality to LSU, time efficiency, and space efficiency. We present Fast LSU on self-assertive pieces and furthermore show its rightness and efficiency in Section 4. We offer proposals for finalizing the report of significant tests in Section 5 and finish up with dialog in Section 6. Code for animplementation of the calculation are given in R and SAS.
3.7 Exercise Of Three Hapmap Gatherings And Their Piece Ing For Stranger's Cis-Eqtl Think About
FastLSU controls the worldwide
FDR , not a family-based bound or a gathering based bound. Our final results are not affected by the technique of isolating tests. This is an important distinction since lumping is discretionary and dependent on computational efficiency without any thought for connections between the theories being tried. This is in contrast to aggregate testing systems where for instance, theories might be gathered based on exploratory information, for example, every one of the tests from a similar chromosome, the back and front parts of the mind [9], or different populace bunches in HapMap [14]. Wewill demonstrate how the Fast LSU calculation can even improve
the efficiency of a gathering based controlling system. Fast LSU is especially fit to the present applications in genetics because we regularly look for the significant set of SNPs or genes, and the family structure is usually less significance than dealing with the computational weight.
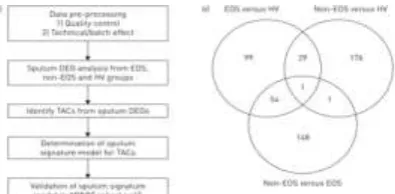
Figure 1 : Clustering approach. a) Workflow for identification of transcriptome-associated clusters (TACs), determination of signature classifiers, and validation of findings of signature and clinical feature of clusters. DEG: differentially expressed gene; EOS: eosinophilic;
Hierarchical clustering based on Euclidean distance was used for cluster exploration. A supervised learning algorithm using the shrunken centroid method was applied to the cluster findings to determine the predictive signatures for each cluster and feature reduction methods were implemented along with learning algorithms to obtain a sparse model to facilitate interpretation. Consensus clustering, a resampling technique taking into account the cluster consensus across multiple runs of a clustering algorithm, was used to determine the optimal cluster number by finding a cluster number k where the consensus matrix histogram approximates a bimodal distribution at the k cluster and a relative small increase of the area under curve of the cumulative distribution function at the k+1 cluster.
3.8 Signatures summarized by gene set variation analysis
applied to compare the ES differences between the two means.
1.1.1.3.10 Generation of bone marrow chimeras
Bone marrow (BM) chimeras were generated using GRwt and GRdim mice acting as donor or host. Recipient mice were subjected to total body irradiation 24 h prior to BM transfer (8.5 Gy) at a rate of 1 Gy/min using a RS 225 X-Ray Research System (Gulmay Medical Systems, Camberley, Surrey, U.K.) operated at 200 kV and 15 mA and with 0.5-mm Cu filtration. The next day, BM was isolated from femur and tibia of the donor mice. A cell suspension was prepared in PBS using a 40-μm cell strainer and injected into the irradiated mice i.v. at a concentration of 4 × 10⁷ cells in a total volume of 100 μl. Antibiotic therapy consisting of 25 μg/ml neomycin sulfate (Sigma-Aldrich) was started on the day of irradiation and lasted for 3 wk. Reconstitution of the immune system and the identity of the different types of chimeric mice were confirmed 6 wk after BM transfer by genotyping peripheral blood and tail biopsies by PCR using primers located in exons 3 and 5 of the GR gene, followed by digestion of the PCR product with BsrGI and agarose gel electrophoresis, as described.
3.11 Mouse model of allergic asthma
Allergic airway inflammation (AAI) was induced in mice using chicken egg OVA, as previously described, and served as a model of allergic asthma. Mice were sensitized on days 0, 7, 14, and 21 by i.p. injections of 10 μg of OVA (Sigma-Aldrich), together with 2 mg of the adjuvant alum (Alhydrogel 2%; InvivoGen, Toulouse, France), in a total volume of 200 μl of PBS.
3.14 OVA-specific Ig ELISA
Flat-bottom 96-well plates were coated with 50 μg/ml OVA in 0.1 M Na2CO3 (pH = 9.5)
overnight at 4°C. After washing with 0.05% Tween-20 and blocking with 10% FCS for 1 h, serum samples were added to the plate and incubated for 1 d at 4°C. For IgE detection, serum was preincubated with Protein G PLUS agarose (Santa Cruz Biotechnology, Heidelberg, Germany) to remove excess IgG. OVA-specific Igs were
detected using HRP-coupled IgG1–,
anti-IgG2a–, and anti-IgE–specific Abs
(SouthernBiotech, Birmingham, AL). After incubation at room temperature for 1 h, the plate was washed, and the color reaction was developed by adding tetramethylbenzidine and H2O23.15
OVA-specific splenocyte restimulation
Spleens were passed through a 40-μm cell strainer and washed in 0.1% BSA. Erythrocytes were lysed, and cells were plated in round-bottom 96-well plates at a concentration of 3 × 10⁵ cells per well. Splenocytes were cultured in RPMI 1640 medium with 10% FCS, 100 U/ml penicillin, and 100 μg/ml streptomycin (all from Invitrogen, Karlsruhe, Germany) and were restimulated ex vivo with 10 μg/ml 3.16 Quantitative RT-PCR analysis
Lungs were flushed extensively with 0.1% BSA after cannulation of the trachea to remove the infiltrating leukocytes. Subsequently, total RNA was isolated with an RNeasy Mini Kit (QIAGEN, Hilden, Germany) and reverse transcribed into cDNA using an iScript cDNA Synthesis Kit (Bio-Rad, Munich, Germany), according to the manufacturers’ instructions. For relative quantification of gene expression, an RT-PCR reaction was performed using the ABI 7500 Real-Time PCR System (Applied Biosystems, Darmstadt, Germany) in combination with Power SYBR Green PCR Master Mix from the same company.
3.18 Statistics
Statistical analysis was performed by one-way
ANOVA using GraphPad Prism software
(GraphPad, La Jolla, CA). Outlying sample exclusion was done with GraphPad Prism Outlier Calculator (GraphPad). All data are depicted as mean ± SEM; *p < 0.05, **p < 0.01, ***p < 0.001.
The transcriptomic data have been deposited in the GEO (Gene Expression Omnibus) database with accession number GSE76262.
Chapter Four
Results
4.1 Pathway analysis of transcriptomic features
three groups of the U-BIOPRED cohort defined by EOS (≥1.5%) versus non-EOS, EOS versus HV and non-EOS versus HV. Online supplementary table S2 shows the top 10 significant pathways for the three sets of DEGs from available public ontology databases.
4.2 Definition of three
transcriptomic-associated clusters
The consensus matrices for clusters between k=2 and k=5 showed that the cumulative distribution function curve of the consensus index at cluster k=2 approximated a bimodal distribution, yet the increase of the area under the curve at k=3 was very large.
Figure 2: Consensus clustering to determine optimal number of matrices. AUC: area under the curve; CDF: cumulative distribution function. The optimal cluster number was determined by finding a cluster number k where the consensus matrix histogram approximates a bimodal distribution at the k cluster and a relative small increase of the AUC of the CDF at the k+1 cluster. a–d) Consensus matrices for clusters number a) k=2, b) k=3, c) k=4 and d) k=5. e) CDF curves of the consensus index for k=2–6, where k=2 approximated a bimodal distribution, while f) the increase of AUC at k=3 was maximal. Cluster number k=3 was the optimal choice.
Hierarchical clustering and resampling yielded three TACs. TAC1, with the highest eosinophilia, exhaled nitric oxide fraction (FeNO) and serum
periostin, defined exclusively severe asthma patients with high oral corticosteroid dependency, acute exacerbation, nasal polyps and severe
airflow obstruction. The shrunken centroid algorithm defined 20 genes for TAC1 related to multiple cytokine receptors and signalling
(IL1RL1, SOCS2, CCR3, CRLF2), enzymes found
in macrophages, mast cells and eosinophils
(PRSS33, CLC, ALOX15, TPSB2, CPA3), and a
cell adhesion molecule on granulocytes and B-cells involved in the damaged-induced adaptive
immune response (CD24). TAC2 was
characterised by the highest sputum neutrophil counts, serum C-reactive protein (CRP) and greater prevalence of eczema, and was defined by 39 genes associated with the IFN and TNF superfamilies
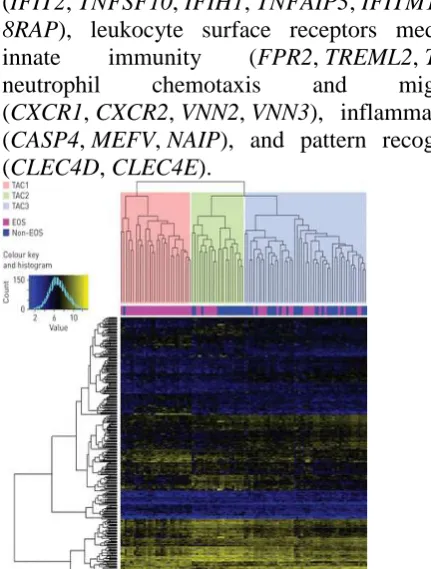
(IFIT2, TNFSF10, IFIH1, TNFAIP3, IFITM1, IL1
8RAP), leukocyte surface receptors mediating innate immunity (FPR2, TREML2, TLR1),
neutrophil chemotaxis and migration
(CXCR1, CXCR2, VNN2, VNN3), inflammasomes
(CASP4, MEFV, NAIP), and pattern recognition
(CLEC4D, CLEC4E).
Figure 3: Heatmap of hierarchical clustering on 104 asthmatic subjects (columns) with 508 transcriptomic features (rows). Clustering results in three transcriptome-associated clusters: TAC1, TAC2 and TAC3. The sputum granulocyte status for each participant is mapped underneath the column dendrogram. EOS: eosinophilic.
TABLE 1
Figure 4: Heat map showing the signature of genes that best discriminate each transcriptome-associated cluster (TAC) derived using the shrunken centroid method. Columns represents 104 asthmatic subjects and rows represent 76 genes. The signatures of genes in the corresponding colours of each TAC (TAC1: 20 genes; TAC2: 39 genes; TAC3: 17 genes) are shown.
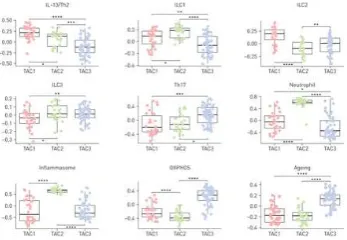
Using GSVA, there was a significant difference in the enrichment of the nine signatures associated with asthma, i.e. the activation of IL-13/Th2, ILC1, ILC2, ILC3, Th17, neutrophil activation, inflammasome, oxidative phosphorylation (OXPHOS) and ageing signatures. TAC1 showed the highest ESs for IL-13/Th2 and ILC2, and low ESs for Th17, neutrophil activation, inflammasome, OXPHOS and ageing signatures, while TAC2 had the highest ESs for ILC1, neutrophil activation and inflammasome signatures. TAC3 showed the highest ESs for ILC3, Th17, OXPHOS and ageing signatures, but low ESs for IL-13/Th2, ILC1, neutrophil activation and inflammasome signatures.
Figure 5: Gene set variation analysis (GSVA). Dot blot expression scores for nine different gene signatures as shown in online supplementary table S4 in the three transcriptome-associated clusters (TAC1, TAC2 and TAC3). IL: interleukin; Th: T-helper cell; ILC: innate lymphoid cell; OXPHOS: oxidative phosphorylation. Data are presented as individual data points, and box-and-whisker plots showing
median and interquartile range. *: p<0.05; **: p<0.01; ***: p<10−3; ****: p<10−5.
4.3 TACs and sputum granulocytic
inflammation
EOS inflammation was present in all three TACs, with 96.7% (29 out of 30) of TAC1 with high levels of sputum eosinophilia, and with 36.4% (eight out of 22) of TAC2 and 40.4% (21 out of 52) of TAC3. The TAC1 subtype was enriched for both IL-13/Th2 and ILC2 signatures (p=10−7 and p=0.01, respectively). Neutrophilic inflammation was found mainly in TAC2 and also in TAC3, and the paucigranulocytic group was mainly TAC3 (figure 6a). In neutrophilic inflammation, the neutrophil and inflammasome signatures were highest for TAC2 compared with TAC3 (p=0.01 and p<0.02, respectively). Mixed inflammation was composed of TAC1 and TAC2, with TAC1 patients in this mixed group showing enrichment for IL-13/Th2, but TAC2 subjects were relatively enriched for neutrophil and inflammasome signatures (p<0.01 and p=0.002, respectively). These findings support the view that the mixed granulocytic phenotype is less biologically distinct, but dependent on the pathobiological drive determined by each TAC.
the TAC2 subtype (n=8) was slightly enriched in the neutrophil (ES difference 0.39, p=0.02) and inflammasome (ES difference 0.35, p=0.004) signatures, but the ILC3 signature was not enriched for the TAC1 subtype. d) Within the neutrophil-predominant phenotype, the TAC2 subtype (n=13) was enriched in the neutrophil (ES difference 0.47, p=0.001) and inflammasome (ES difference 0.37, p=0.011) signatures, with no significant differences for the ILC1 signature. Data in b–d) are presented as individual data points, and box-and-whisker plots showing median and interquartile range.
4.4 Analysis of TAC signatures in the ADEPT cohort
The ES of TAC1 signatures (online supplementary figure S2) was significantly higher in moderate asthma compared with mild asthma (mean difference −0.52, p=0.010) or healthy controls (mean difference −0.48, p=0.030) in the ADEPT cohort. The TAC2 and TAC3 signatures (online supplementary figure S2) among healthy controls, mild-to-moderate and severe asthma were similar. When subjects were classified according to granulocytic inflammatory phenotypes, the ADEPT samples recapitulated the findings from the U-BIOPRED cohort. We confirmed for the eosinophil-predominant phenotype that the mean ES was positive for both TAC1 and TAC3 signatures, but not for TAC2. The mixed granulocytic phenotype was enriched for TAC1 and TAC2 signatures, but not for TAC3. In addition, the neutrophil-predominant phenotype was enriched for the TAC2 signature, but not for TAC1 or TAC3, and the paucigranulocytic phenotype was enriched for the TAC3 signature, but not for TAC1 or TAC2.
Figure 7: Enrichment of transcriptome-associated cluster (TAC) signatures in the ADEPT (Airways Disease Endotyping for Personalized Therapeutics) cohort according to sputum granulocytic inflammation. a) Eosinophil-predominant: ≥1.5%. b) Neutrophil-Eosinophil-predominant: ≥74%. c) Mixed granulocytic: eosinophils ≥1.5% and neutrophils ≥74%. d) Paucigranulocytic: eosinophils <1.5% and neutrophils <74%. Data are presented as individual data points, and box-and-whisker plots showing median and interquartile range. *: p<0.05; **: p<0.01; ***: p<10–3; ****: p<10–5.
4.5 Network of each TAC-related gene and protein
As biological processes are commonly regulated by coexpressed genes, each TAC signature only represents the most characteristic genes as a subset of all the genes involved in each biological process. We therefore attempted to understand the coexpression relationship of all TAC-related genes and proteins potentially functioning in the biological processes associated with asthma. We first filtered the individual genes based on a moderate-to-high positive correlation with the GSVA ES of each TAC gene signature. This produced three sets of TAC-related genes, containing 153 TAC1-related genes, 194 TAC2-related genes and 312 TAC3-TAC2-related genes. A similar filtering scheme for individual proteins led to the identification of three sets of TAC-related proteins, containing 91 TAC1-related proteins, 98 TAC2-related proteins and 42 TAC3-related proteins. Following this, each TAC-related gene– protein network was displayed as a correlation matrix (online supplementary figure S3). We found that the three TAC-related gene–protein networks presented mild-to-moderate mean gene– protein correlations (online supplementary figure S3, blue frame; mean Pearson's correlation: TAC1 r=0.292, TAC2 r=0.416 and TAC3 r=0.403), suggesting a functional coherence of the three sets of TAC-related genes and proteins.
4.6 Gene–protein relationships in TACs
We dissected the mechanistic implication of the gene signatures and the related proteins in sputum using the shrunken centroid algorithm. We defined
10 proteins for TAC1 (including a
for TAC2 (including those related to the proteasome (PSMA1), phospholipase (PLCG1) and TNF-α (TNFAIP6)) and two proteins (cathepsins CTSG and CTSB) for TAC3 (online supplementary table S3). We established three coexpression networks using each TAC signature and showed that the mean gene–protein correlations of the TAC1 (r=0.49, p<0.001) and TAC2 (r=0.46, p<0.005) networks were significantly higher than random gene–protein relationships (online supplementary figure S4), indicating that the genes and proteins of TAC1 and TAC2 are regulated by similar mechanisms. Highly coexpressed IL33R/ARSB (r=0.78,
p=4.2×10⁻¹⁶), IL33R/PAPPA (r=0.73,
p=2.3×10⁻¹³) and CLC/PAPPA (r=0.79,
p=9.7×10⁻¹⁷) featured in TAC1,
and IFITM3/PGLYRP1 (r=0.67,
p=9.0×10⁻¹¹), IFITM1/PGLYRP1 (r=0.63, p=2.3×10⁻⁹) and MEFV/PLCG1 (r=0.67, p=9.0×10⁻¹¹) featured in TAC2. The mean gene– protein correlation of the TAC3 network was similar to random gene–protein relationships (r=0.40, p=0.566; online supplementary figure S4), suggesting that TAC3 signatures were underlain by more diverse mechanisms, particularly post-transcriptional mechanisms.
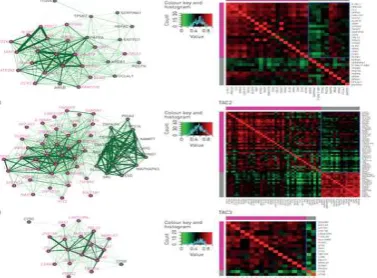
Figure 8 : Coexpression network of each transcriptome-associated cluster (TAC) signature of genes (magenta nodes) and proteins (grey nodes). The linkage between each pair of nodes by an edge (green line) corresponds to the mutual correlation between two nodes as gene–gene, gene–protein or protein–protein relationships. her.
4.7 GC responsiveness in a mouse model of allergic asthma depends on an intact GR dimerization interface
To test whether an intact GR dimerization interface was required for successful GC therapy of allergic asthma, we initially used GRdim mice carrying the point mutation A458T in the DNA-binding domain (16). GRwt and GRdim mice were
sensitized with OVA i.p., followed by intranasal challenge with the same Ag to induce AAI, a major hallmark of allergic asthma (Fig. 1A). Half of the immunized mice also received Dex by i.p. injection as a model of systemic GC therapy, and mice treated only with adjuvant served as controls Immunization with OVA also increased the abundance of CD3+ and CD8+ T cells,
Foxp3+ regulatory T cells,
CD68+monocytes/macrophages, and
Gr-1+ neutrophils in the lung. GC therapy inhibited this cellular influx in GRwt mice, whereas GRdim mice did not respond to Dex treatment and appeared to contain more neutrophils in the lung under these conditions.
Figure 1 : Histological analysis of the lung in GRdim mice
after induction of AAI and GC treatment. (A) Schematic representation of the experimental setup. GRwt and
GRdim mice were sensitized four times against OVA,
followed by two intranasal challenges with the same Ag to induce AAI. Half of the immunized mice were also treated with Dex (O+D), and control mice received only adjuvant (Alum). (B) Histological analysis of alveolar structures in the lung of GRwt and GRdim mice by H&E staining. (C)
Immunohistochemical analysis of bronchial structures in the lung of GRwt and GRdim mice by Muc5B staining. One
Figure 2 : Immunohistochemical analysis of the lung in GRdim mice after induction of AAI and GC treatment.
GRwt and GRdim mice were sensitized against OVA, followed
by intranasal challenge with the same Ag to induce AAI, as illustrated in Fig. 1A.
To confirm our observations, BALF was collected and analyzed by flow cytometry. In line with the histological data, induction of AAI resulted in strongly increased leukocyte numbers in the airways (Fig. 3). The infiltrate in both genotypes was dominated by eosinophils, with minor populations of macrophages, neutrophils, and T cells (Fig. 3). Although GRdim and GRwt mice developed AAI to a
similar degree, GRdim mice were refractory to the repressive
effect of Dex (Fig. 3). In agreement with our previous observation, GC therapy increased neutrophil numbers in BALF of GRdim mice, although statistical significance was
not reached (Fig. 3).
Figure 3 : Flow cytometric analysis of BALF from GRdim mice after induction of AAI and GC treatment.
GRwt and GRdim mice were immunized and challenged with
OVA to induce AAI, as illustrated in Fig. 1A. Half of the immunized mice were also treated with Dex (O+D), and control mice received only adjuvant (Alum). Lungs were flushed in situ, and total cell counts in BALF were determined by microscopic counting using a Neubauer hemocytometer. Eosinophils, macrophages, neutrophils, total T cells, and CD4+ T cells in BALF were identified by flow
cytometry and quantified by multiplying their percentages by the total of all BALF cells counted. All values are depicted as mean ± SEM; n = 14–22 (each group). *p < 0.05, **p < 0.01, ***p < 0.001, one-way ANOVA. n.s., not significant.
4.8 An intact GR dimerization interface is required for efficient GC treatment of AHR
AHR is another hallmark of allergic asthma, which prompted us to study the role of an intact GR dimerization interface for the ability of GCs to resolve airflow limitation after methacholine exposure. To this end, GRwt and GRdim mice were treated with OVA similarly as with the previous experiment, and half of the immunized mice also received Dex (Fig. 1A). AHR was observed in GRwt and GRdim mice, given that increased resistance and elastance of the airways developed with ascending doses of methacholine, whereas compliance concomitantly decreased (Fig. 4). Although Dex administration improved the airflow in GRwt mice after methacholine challenge, the same treatment had no effect in GRdim mice (Fig. 4). These data indicate that the GR point mutation A458T confers resistance to Dex application in AHR therapy, reconfirming a crucial role for an intact GR dimerization interface in the control of allergic asthma by GCs.
Figure 4 : Analysis of airflow limitation in GRdim mice after
induction of AHR and GC treatment. GRwt and GRdim mice
were immunized and challenged with OVA to induce AHR, as illustrated in Fig. 1A, and half of them were also treated with Dex (O+D). One day after the last challenge, mice were exposed to increasing concentrations of methacholine, and airway flexibility was measured based on resistance (Rtr, expressed as cm H2O × s/ml) (A), elastance (Etr, expressed
as cm H2O/ml) (B), and compliance (Ctr, expressed as
ml/cm H2O) (C). All values are depicted as mean ±
4.9 Short-term GC therapy has no impact on Ag-specific B and T cells
In search of the mechanisms by which GCs repress AAI, we first studied the role of Ag-specific B cells. Mice were subjected to the same experimental procedure as described above (Fig. 1A) and analyzed for serum levels of Ag-specific IgE, IgG1, and IgG2a. Production of OVA-specific Abs was strongly increased after AAI induction, whereas Dex did not have an effect on their levels in GRwt nor GRdim mice (Fig. 5A). Second, we tested peripheral T cell function after AAI induction. Following Ag restimulation of splenocytes in vitro, T cell proliferation and IL-2 and IL-4 production were increased in immunized mice, but Dex treatment had no impact on these T cell parameters in either genotype (Fig. 5B). Collectively, our findings suggest that amelioration of AAI after GC therapy can not be explained by modulation of Ag-specific B or T cells.
FIGURE 5 : Characterization of Ag-specific B and T cells in GRdim mice after induction of AAI and GC treatment.
GRwt and GRdim mice were sensitized against OVA, followed
by intranasal challenge with the same Ag to induce AAI, as illustrated in Fig. 1A; half of the immunized mice also were treated with Dex (O+D). Control mice received only adjuvant (Alum). (A) Blood was collected by cardiac puncture, and the serum was analyzed for OVA-specific Ig isotype levels by ELISA using IgE-, IgG1-, and IgG2a-specific Abs. Serum levels are depicted as OD measured by spectrophotometry. n = 17–28 (each group). (B) Splenocytes were incubated or not with OVA for 72 h in vitro.
4.10 Therapeutic effects of GCs in the treatment of AAI do not require GR expression in immune cells
To define the cell types responsible for the beneficial effects of GCs in the treatment of AAI,
we used a panel of cell type–specific GR-knockout mice (20, 24). Initially, we analyzed mice lacking the GR in T cells (GRlck), myeloid cells (GRlysM), or both (GRlcklysM). AAI was induced as in previous experiments (Fig. 1A), and the effect of Dex treatment was compared between mutant mice and GRflox littermate controls. Quantification of inflammatory cells in BALF revealed similar levels upon AAI induction for all mutant mouse strains and a comparable reduction in these numbers when mice were also treated with Dex (Fig. 6A). To test for a role of other immune cells in mediating the therapeutic effects of GCs, we subsequently analyzed GRcd19 mice that carry a deletion of the GR in B cells or GRcd11c mice that
are devoid of the GR in DCs. However, enumeration of leukocytes in BALF after induction of AAI indicated that, in this case too, the GR was dispensable for therapeutic efficacy of Dex (Fig. 6B). Notably, measurement of OVA-specific IgG1 Ab levels confirmed that immunization had been successful in all mouse strains (Supplemental Fig. 2A, 2B). Collectively, the presence of the GR in individual leukocyte subsets is not required for GC therapy of AAI.
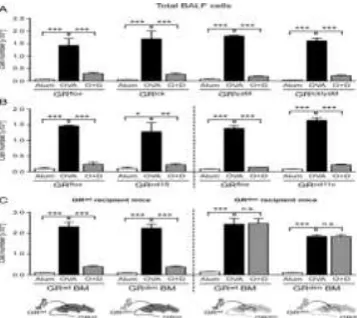
Figure 6 : Flow cytometric analysis of BALF from cell type–specific GR-knockout mice and GRdim BM chimeras
after induction of AAI and GC treatment. (A) Cell type– specific knockout mice lacking the GR in T cells (GRlck),
myeloid cells (GRlysM), or both (GRlcklysM) were compared
with their wild-type littermates (GRflox) (n = 3–6 [each
group]). (B) Cell type–specific knockout mice lacking the GR in B cells (GRcd19) or DCs (GRcd11c) were compared with
their respective wild-type littermates (GRflox) (n = 3–5 [each
GRwt or GRdim BM was transplanted into irradiated GRwt or
GRdim recipient mice, were analyzed
4.12 AT2 cells are crucial targets of GC therapy of AAI
Our unexpected finding that the hematopoietic compartment was dispensable for successful GC treatment of AAI provoked the question about which other cell types might be responsible. Thus, we turned our attention to the lung parenchyma, which mainly consists of epithelial cells, fibroblasts, smooth muscle cells, and endothelial cells. AT2 cells, a subtype of airway epithelial cells in the alveoli, are best known to fulfill immunological functions, such as Ag presentation and cytokine production. Hence, we disrupted the GR in these cells by treating inducible GRspcmice with tamoxifen. Sftpc-CreERT2–knock-in mice that we used to generate this mouse model express a modified Cre recombinase under the control of the surfactant protein C promoter and were shown to mediate gene recombination in 84% of AT2 cells (25). AAI was induced in GRflox and
GRspc mice by immunization and challenge with OVA as previously (Fig. 7A). This procedure resulted in enhanced leukocyte infiltration into the lung, bronchoconstriction, and augmented mucus production in the airways (based on Muc5B staining), regardless of the genotype (Fig. 7B, 7C). In addition, the numbers of CD3+ and
CD8+ T cells, Foxp3+ regulatory T cells, CD68+ monocytes/macrophages, and Gr-1+ neutrophils in the lung were increased (Fig. 8, Supplemental Fig. 3). Flow cytometric analysis of BALF revealed massive eosinophilia and confirmed the influx of macrophages, neutrophils, and T cells into the lung following AAI induction (Fig. 9). Analysis of OVA-specific IgE and IgG1 serum levels affirmed that both mouse strains had been successfully immunized (Supplemental Fig. 4). Most importantly, the repressive effect of Dex on leukocyte infiltration into the lung, which was observed in GRflox mice as expected, was strongly
compromised, although not fully abolished, in GRspc mice (Figs. 7B, 9). In line with these data, GC treatment reduced the influx of eosinophils, macrophages, neutrophils, and major T cell subsets into the lung of GRflox mice but not
GRspc mice (Figs. 8, 9, Supplemental Fig. 3). Furthermore, bronchoconstriction and mucus hyperproduction were resolved in GRflox mice after GC therapy, whereas they largely persisted in GRspc mice (Fig. 7C). Taken together, AT2 cells
play a critical role in the therapeutic effects of Dex in AAI, although other parenchymal cell types, such as endothelial cells or smooth muscle cells, are presumably targets of GC activity as well.
Figure 7 : Histological analysis of the lung in GRspc mice
after induction of AAI and GC treatment. (A) Schematic representation of the experimental setup. GRflox and
GRspc mice repeatedly received tamoxifen by oral gavage,
were sensitized four times against OVA, and were intranasally challenged twice with the same Ag to induce AAI. Half of the immunized mice were also treated with Dex (O+D), and control mice received only adjuvant (Alum). (B) Histological analysis of alveolar structures in the lung of GRflox and GRspc mice by H&E staining. (C)
Immunohistochemical analysis of bronchial structures in the lung of GRflox and GRspc mice by Muc5B staining. One
section, representative of the five mice (H&E) or three mice (Muc5B), is depicted for each condition and genotype.
Figure 8 : Immunohistochemical analysis of the lung in GRspc mice after induction of AAI and GC treatment.
GRflox and GRspc mice were repeatedly treated with
Figure 9 : Flow cytometric analysis of BALF from GRspc mice after induction of AAI and GC treatment.
GRflox and GRspc mice repeatedly received tamoxifen by oral
gavage and were immunized and challenged with OVA to induce AAI, as illustrated in Fig. 7A. Half of the sensitized mice were also treated with Dex (O+D), and control mice received only adjuvant (Alum). Lungs were flushed in situ, and total cell counts in BALF were determined by microscopic counting using a Neubauer hemocytometer. Eosinophils, macrophages, neutrophils, total T cells, and CD4+ T cells in BALF were identified by flow cytometry
and quantified by multiplying their percentages by the total of all BALF cells counted. All values are depicted as mean ± SEM; n = 10–16 (each group). *p < 0.05, **p < 0.01, ***p < 0.001, one-way ANOVA. n.s., not significant.
4.13 An impaired GR dimerization interface and a deletion of the GR in AT2 cells similarly perturb GR-dependent gene regulation in the lung parenchyma
Because GRdim and GRspc mice were similarly found to be unresponsive to Dex therapy for AAI, we speculated that control of gene expression in airway epithelial cells was a critical mechanism of GCs in repressing lung inflammation. To address this issue, AAI was induced in both mouse models and treated with Dex, as in previous experiments (Figs. 1A, 7A). To restrict gene expression analysis to parenchymal cells, RNA was isolated from lungs that were flushed extensively to remove infiltrating leukocytes. Initially, we used quantitative RT-PCR to analyze cytokines and chemokines that are known to be associated with asthma pathogenesis and to be produced by airway epithelial cells. As expected, expression of
IL-5, IL-13, IL-33, and MCP-1 was enhanced after
AAI induction in all strains of mice (Fig. 10). However, repression by Dex was not observed in GRdim or GRspc mice (Fig. 10). Furthermore, there
was a tendency toward decreased expression of the
tight junction proteins occludin and claudin 5 after Dex treatment in the lungs of GRwt and GRflox mice but not in the two mutant mouse strains (Fig. 10). Although statistical significance was not always reached, our data strongly suggest that lack of AAI responsiveness to GCs after disrupting the GR dimerization interface or deleting the GR in AT2 cells was linked to the inability of Dex to regulate gene expression in airway epithelial cells (Fig. 11).
Figure 10 : Analysis of gene expression in the lung parenchyma of GRdim and GRspc mice after induction of AAI
and GC treatment.. (A) GRdim model characterized by a
disrupted dimerization interface: gene expression in the lung was compared between GRwt and GRdim mice. n = 5–12
(each group). (B) GRspc model characterized by a deletion of
the GR in AT2 cells: gene expression in the lung was compared in GRflox and GRspc mice. n = 5–13 (each group).
All values are depicted as mean ± SEM. *p < 0.05, **p < 0.01, ***p < 0.001, one-way ANOVA. n.s., not significant.
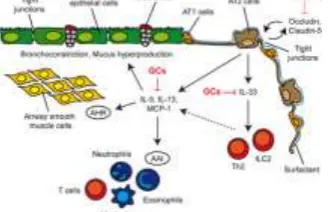
Figure 11 : Model of GC effects on airway epithelial cells in allergic asthma. The conducting airways are lined by ciliated and nonciliated columnar bronchial epithelial cells interspersed with goblet cells. The surface of the alveoli is lined by alveolar type (AT) 1 cells and AT2 cells, which are covered by surfactant. Airway epithelial cells are connected by tight junctions, thus forming a barrier. IL-33 expression by AT2 cells is repressed by GCs, thereby reducing cytokine production by ILC2s and Th2 cells.
We have described three new TACs of severe asthma derived from a semibiased analysis of sputum transcriptomics using hierarchical clustering. TAC1 contains a greater enrichment for IL-13/Th2 and ILC2 signatures, and is associated with blood and sputum eosinophilia, reflecting severe asthma characterised by mast cell and eosinophil activation and upregulation of receptors for TSLP, IL-33, IL-3 and CCL11 (CCR3). TAC2 is inflammasome-dominant with IFN and TNF superfamily upregulation and high expression of DAMPs (damage-associated molecular patterns), and is associated predominantly with neutrophilic inflammation and highest CRP levels and with chronic airflow obstruction of a lesser severity than that found in TAC1. The molecular signature for TAC3 highlighted metabolic, ubiquitination enzymes and mitochondrial energy metabolic genes, with the highest expression scores for mitochondrial oxidative stress (OXPHOS) and ageing gene signatures associated with paucigranulocytic and mild EOS inflammation. TAC3 is characterised by the lowest oral corticosteroid use, mild airflow obstruction and less frequent exacerbations than TAC1. Thus, the molecular phenotyping based on sputum cells yielded three distinct clinical clusters.
The highly
coexpressed IL33R/ARSB, IL33R/PAPPA
and CLC/PAPPA found in TAC1 emphasise the link between IL-33R and eosinophil activation markers, which is in accord with the alarmin IL-33 being able to exacerbate eosinophil-mediated airway inflammation through the release of the Th2-based cytokines IL-5 and IL-3. In the TAC2
phenotype, the highly
coexpressed IFITM3/PGLYRP1, IFITM1/PGLYR P1 and MEFV/PLCG1 reflect innate host defence responses to viruses and bacteria.
To try and understand the biological basis of these inflammatory phenotypes, we examined the distribution of the three TACs in relation to their sputum inflammatory phenotypes. The eosinophil-predominant (TAC1 or TAC3),
neutrophil-dependent (TAC2 or TAC3) and mixed
granulocytic-dominant (TAC1 or TAC2)
phenotypes were split into two main biological
classifications, whereas the paucigranulocytic-dominant (TAC3) phenotype was representative of only one TAC, i.e. TAC3. A major finding of this study was that at least two distinct transcriptional signatures were associated with sputum eosinophilia. The eosinophil-predominant TAC1 had a higher expression of IL-13/Th2 and ILC2 signatures, while the eosinophil-associated TAC3 was higher in the inflammasome signature, indicating a similarity of TAC1 to Th2-mediated allergic asthma and ILC2-mediated EOS asthma. This was also reflected by some of the genes (e.g.
IL33R, TSLPR) involved in the ILC2 mechanism
being in the top ranks of the TAC1 signature. TAC1 The TAC2 phenotype within the mixed granulocytic phenotype had a greater enrichment of neutrophil and inflammasome signatures, while the TAC1 subjects with mixed granulocytic asthma had a trend towards higher expression of the IL-13/Th2 signature. This suggests that TAC2 is dominated by neutrophil-driving mechanisms. In contrast, TAC1 revealed a dominant IL-13/Th2 signature with a high EOS component. However, the mixed granulocytic TAC1 revealed a higher Th2 signature expression, suggesting that its EOS component was relatively dominant over its neutrophilic component, acting biologically in a similar way to the predominantly EOS phenotype. The biological distinction of a mixed granulocytic phenotype has been considered as a transitional phenotype with less stability. Our study supports the view that a mixed granulocytic phenotype is less biologically distinct, but rather dependent on the biology determined by either neutrophils or eosinophils.
(paucigranulocytic inflammation and low serum CRP) is unclear. Further research examining the role of other cell types (e.g. macrophages and epithelial cells) may help determine these mechanisms.
In summary, our approach provides a fresh framework on which to phenotype asthma and a more precise targeting of specific treatments. Future work is required to validate the biology of the non-Th2 pathways demonstrated here. As the stratification of these TACs is not entirely predicted by measuring sputum granulocytic inflammation and not all subjects were able to produce sputum, a point-of-care, preferably blood-based, biomarker of these TACs will be needed 4.15 CONCLUSION:
To our knowledge, allergic asthma is the first example of an inflammatory disease in which GC targeting of nonhematopoietic cells is essential. In all hitherto studied mouse models of autoimmunity (multiple sclerosis, rheumatoid arthritis), atopy (contact dermatitis), transplantation (graft-versus-host disease), and infection-related diseases (sepsis, acute lung injury) GR expression in T cells or myeloid cells was required for responsiveness to endogenous or exogenous GCs. Therefore, it was surprising that nonimmune cells were most critical for the treatment of AAI with Dex. Taken together, we identified GR-dependent gene regulation in AT2 cells as a crucial therapeutic mechanism of GC action in allergic asthma. Our findings suggest that selective targeting of GCs to this subtype of airway epithelial cells, such as by using liposomes or nanoparticles , could open new avenues for improved treatment of asthma with fewer side effects and to overcome GC resistance. Although our findings are limited to the OVA-induced allergic asthma model and need to be validated using a clinically more relevant allergen, as well as human studies, we are confident that our concept will foster new research efforts aimed at improving therapeutic regimens for the treatment of asthma.
Asthma pathogenesis is characterized by two major endotypes, a T2-high featuring increased eosinophilic airway inflammation, and a T2-low
endotype presenting with either neutrophilic or paucigranulocytic airway inflammation and showing greater resistance to steroids. This clearly presents an unmet therapeutic challenge. A precise definition and characterization of the mechanisms that drive this T2-low inflammatory response in each patient phenotype is necessary to help identify novel drug targets and design more effective and targeted treatments.
REFERENCES
[1]. O'Donohue, William T., and Lauren Woodward Tolle. Behavioral Approaches to Chronic Disease in Adolescence. Springer, 2009. [2]. Lemanske Jr, Robert F., and William W. Busse. "6. Asthma." Journal of allergy and clinical immunology 111.2 (2003): S502-S519. [3]. Education, National Asthma, Third Expert Panel on the Diagnosis, and Management of Asthma. "Section 2, Definition, Pathophysiology and Pathogenesis of Asthma, and Natural History of Asthma." (2007).
[4]. Garcia-Marcos, Luis, Kostas N. Priftis, and Carlo Caffarelli, eds. The Parallel March of Asthma and Allergy in Childhood: A Multi-Perspective Approach. Frontiers Media SA, 2018.
[5]. National Asthma Education, et al. Expert panel report 2: guidelines for the diagnosis and management of asthma. No. 98. DIANE Publishing, 1998.
[6]. Wenzel, Sally E. "Asthma phenotypes: the evolution from clinical to molecular approaches." Nature medicine 18.5 (2012): 716. [7]. Holgate, Stephen T., et al. "Epithelial-mesenchymal interactions in the pathogenesis of asthma." Journal of Allergy and Clinical Immunology 105.2 (2000): 193-204.
[8]. Peters, Michael C., et al. "A transcriptomic method to determine airway immune dysfunction in T2-high and T2-low asthma." American journal of respiratory and critical care medicine 199.4 (2019): 465-477. [9]. Olin, J. Tod, and Michael E. Wechsler. "Asthma: pathogenesis and novel drugs for treatment." Bmj 349 (2014): g5517.
implications for precision medicine." Clinical Science 131.14 (2017): 1723-1735.
[11]. Chung, Kian Fan. "Defining phenotypes in asthma: a step towards personalized medicine." Drugs 74.7 (2014): 719-728.
[12]. Taube, Christian, and Sebastian Reuter. "Transcriptome Analysis of Sputum Cells. The Modern Art of Assessing Inflammation." (2019): 402-404.
[13]. Fujita, Yu, et al. "Intercellular communication by extracellular vesicles and their microRNAs in asthma." Clinical Therapeutics 36.6 (2014): 873-881.
[14]. Wesolowska-Andersen, Agata, and Max A. Seibold. "Airway molecular endotypes of asthma: dissecting the heterogeneity." Current opinion in allergy and clinical immunology 15.2 (2015): 163.
[15]. Olson, Nels, et al. "Activation of hypoxia-inducible factor-1 protects airway epithelium against oxidant-induced barrier dysfunction." American Journal of Physiology-Heart and Circulatory Physiology (2011).
[16]. Barnes, Peter J. "Cellular and molecular mechanisms of asthma and COPD." Clinical Science 131.13 (2017): 1541-1558.
[17]. Braun, Armin, et al. "Brain‐derived neurotrophic factor (BDNF) contributes to neuronal dysfunction in a model of allergic airway inflammation." British journal of pharmacology 141.3 (2004): 431-440.
[18]. Ehrlich, Katherine B., Gregory E. Miller, and Edith Chen. "Family functioning, eosinophil activity, and symptoms in children with asthma." Journal of pediatric psychology 40.8 (2015): 781-789.
[19]. Schleimer, Robert P. "Innate Immune Responses and Chronic Obstructive Pulmonary Disease: “Terminator” or “Terminator 2”?." Proceedings of the American Thoracic Society 2.4 (2005): 342-346.
[20]. Schleimer, Robert P. "Innate Immune Responses and Chronic Obstructive Pulmonary Disease: “Terminator” or “Terminator 2”?." Proceedings of the American Thoracic Society 2.4 (2005): 342-346.
[21]. Benjamini, Yoav, and Yosef Hochberg. "Controlling the false discovery rate: a practical and powerful approach to multiple testing." Journal of the Royal statistical society: series B (Methodological) 57.1 (1995): 289-300.
[22]. Kosmas, Epaminondas N., et al. "Decreased C4 complement component serum levels correlate with the degree of emphysema in patients with chronic bronchitis." Chest 112.2 (1997): 341-347.
[23]. Benjamini, Yoav, and Marina
Bogomolov. "Selective inference on multiple families of hypotheses." Journal of the Royal Statistical Society: Series B (Statistical Methodology) 76.1 (2014): 297-318.
[24]. Dudbridge, F., and A. Gusnanto. "P-value less than say 5× 10− 8 can be regarded as convincingly significant." Genetic Epidemiology 32 (2008): 227234.