© 2016, IJCSMC All Rights Reserved 282 Available Online atwww.ijcsmc.com
International Journal of Computer Science and Mobile Computing
A Monthly Journal of Computer Science and Information TechnologyISSN 2320–088X
IMPACT FACTOR: 5.258
IJCSMC, Vol. 5, Issue. 8, August 2016, pg.282 – 295
EVALUATION OF SHAPE FEATURES FOR
EFFICIENT CLASSIFICATION BASED ON
ROTATIONAL INVARIANT USING TEXTON MODEL
Dr. P Chandra Sekhar Reddy Professor, CSE Dept.
Gokaraju Rangaraju Institute of Engineering and Technology, Hyderabad
Abstract: The present paper derived shape features on textons and texture orientation for rotation invariant stone texture classification of 2D images. To overcome the sensitive problems and to derive rotational invariant features on textons the present research represented textons on texture orientation matrix by reducing grey level range using a fuzzy logic. The proposed Texture orientation matrix (TOM) is formed by bitwise OR operator on Sobel and Canny edge detectors with an orientation of ten degrees at each step. The shape features are derived on the proposed “Texture Orientation Fuzzy Texton Binary Matrix (TOFTBM)”.The proposed TOFTBM with TSF is computationally attractive as it computes different features with limited number of selected pixels. The proposed method is compared with various methods and the result indicates the efficacy of the proposed method over the other methods.
Keywords: Sobel operator, canny operator, Texture orientation, fuzzy, reduction of grey level range.
1. INTRODUCTION
as the most useful when dealing with regular patterns within image data. It has been used to filter out speckle in radar data [10] and to remove the effects of regular agricultural patterns in image data [10]. Study of regular patterns based on fundamentals of local variance was carried out recently [11,12]. Hence, the study of patterns still plays a significant area of research in classification, recognition and characterization of textures [13].
More recently, the local-binary-pattern (LBP) operator [14,15,16] is used for texture classification. LBP operator is a statistical texture descriptor of the characteristics of the local structure. LBP provides a unified description including both statistical and structural characteristics of a texture patch, so that it is more powerful for texture analysis. The concept of LBP is also extend in applications such as face recognition and age classification [17,18,19],industrial visual inspection [20,21], segmentation of remote-sensing images [22], and classification of real outdoor images [23].Most of these algorithms make an implicit assumption that all images are captured under the same orientation. In any practical applications this assumption is not valid. Moreover, as images of the same underlying texture can vary significantly, textural features must be invariant to (large) image variations, and at the same time sensitive to intrinsic spatial structures that define textures. Therefore rotation and scale invariant texture classification becomes necessary in such applications. That is the reason the present paper carried out rotational invariant texture classification using TOM.
Many rotation invariant texture classification methods [24,25,26,27] are proposed in the literature. However, such features may fail to classify the images. Spatial structures vary with rotation while contrast does not. Ojala et al. [27] proposed using the joint histogram of the two complementary features, namely LBP/VAR, for rotation invariant texture classification. The drawback of this approach is that the value of VAR is continuous so that a quantization step is needed to calculate the histogram. The main contributions in this paper is finding rotation invariant texture shape features for texture classification and evaluating performance of the method.
This paper is organized as follows. In Section 2 methodology shape features are proposed for classification. Section3 contains experimental results and discussions. Conclusions are given in Section 4.
2. METHODOLOGY
© 2016, IJCSMC All Rights Reserved 284
Color Quantiza tion Bitwise OR operation on x and y directions Texture Orientation Matrix (TOM) Extraction of texture shape features (TSF on TOFTBM) Texton Image Classification Sobel Edge Detector Canny Edge Detector Origina l color/ gray level image Fuzzy logic on TOM Fig.1: Rotational invariant texture classification based on TSF derived from TOFTBM. 2.1 RGB to HSV Color Model Conversion During the course of feature extraction, the original images are quantized into 128 colors of RGB color space and the color gradient is computed from the RGB color space. In color image processing, there are various color models in use today. The RGB color space is not sensitive to human visual perception or statistical analysis especially in classification problems related to natural textures like Stones etc.. Moreover, a color is not simply formed by these three primary colors. HSV color space is a non-linear transform from RGB color space that can describe perceptual color relationship more accurately than RGB color space. In order to extract gray level features from color information, the proposed TOFTBM with TSF utilized HSV color space. HSV is formed by hue (H), saturation (S) and value (V). Hue denotes the property of color such as blue, green, red, and so on. Saturation denotes the perceived intensity of a specific color. Value denotes brightness perception of a specific color. Thus it can be seen that HSV color space is different from RGB color space in color variations. When a color pixel-value in RGB color space is adjusted, intensities of red channel, green channel, and blue channel of this color pixel are modified. That means color, intensity, and saturation of a pixel is involved in color variations. It is difficult to observe the color variation in complex color environment or content. However, HSV color space separates the color into hue, saturation, and value which means observation of color variation can be individually discriminated. Based on the above the proposed method adopted HSV descriptor for color space because it describes colour intensity and brightness‟s in a significant manner. In order to transform RGB color space to HSV color space, the transformation is described as follows: The transformation equations from RGB to HSV color model conversion is given below ( ) (1)
( ) (2)
(3)
(5)
Where R, G, B are Red, Green and Blue normalized in value [0, 1]. In order to quantize the range of the H plane is normalized with value
[0, 255] for extracting features specifically.
2.2 Texture Orientation Detection
One of the powerful visual cues about the contents of an image is the orientation. Strong orientation usually indicates a definite pattern. The natural images show various contents which may have some common fundamental elements. Texture orientation analysis plays an important role in computer vision and pattern recognition. For instance, orientation is used in pre-attentive vision to characterize textons. Texture orientation can also be used to estimate the shape of the textured images. The orientation map in an image represents the object boundaries and texture structures, and provides most of the semantic information of the image.
Various low-level visual features (e.g. color, texture, shape, edges) can be extracted as a preprocessing step from the images. Out of all these image edges give good information about the image content because they allow the identification of the object structures. Edge detection is a fundamental tool used in most of the image processing applications to obtain information from the images as a precursor step to feature extraction. The image edge has a close relationship with contour and texture pattern. It can provide abundance of texture information and shape information. The edges contain the following features of the image.
1. Edge aims at identifying points in a digital image at which the image brightness changes sharply or more formally and has discontinuities.
2. Edge detection process detects and outlines the boundaries between objects and the background in the image.
3. Edge features are useful to overcome the attacks generated by noise, edge strips and acuity.
4. Edges form boundaries between the different textures.
5. Edge reveals the discontinuities in image intensity from one pixel to another.
© 2016, IJCSMC All Rights Reserved 286
| ( )| √ ( ⁄ ) There are two masks associated with the Sobel and canny filters: one mask corresponds to the gradients in the X-direction and the other to the gradients in the Y-direction. The response function for the Sobel and canny filter are given equations (7) & (8): |( | )| (7)
|( | )| (8)
where Rsx, Rsy, Rcx and Rcy are given in equations (9) to (12): (9)
(10)
(11)
(12)
Where , corresponds to the first and second mask of sobel operator and
are canny operators.
The texture orientation is computed based on the above equations. Then texture orientation of each pixel is quantized into 18 orientations with 100 as the step length. From this TOM is formed. This makes the proposed TOM as rotationally invariant. The proposed TOM further can detect the saltation of color, color edge stripe and acuity problems of an image which is not possible by earlier methods like Texton co-occurrence matrix (TCM).
2.3 Formation OF Fuzzy Grey level Matrix
In natural images, due to the presence of noise, different illumination levels and various conversion factors between neighboring pixels of a window represent as equal, though they rarely have exactly the same intensity value. To avoid this imprecision and be able to represent the vagueness within the processes, the proposed study made use of fuzzy logic on the obtained grey level images of TOM. In Textons even two adjacent pixels differ with a value by one, they may not form a texton shape pattern. This leads to difficulty in analyzing homogeneity issues of varying illumination, noise based issues, scale changes and variability in measuring small surface shapes especially in natural images. To address this fuzzy logic is introduced on the proposed TOM. The proposed method labels eight neighbors of a 3×3 neighborhood using five possible fuzzy patterns or values {0, 1, 2, 3 and 4} derived from the fuzzy code as depicted in equation (13) and the fuzzy membership function is represented as shown in Fig.2. From Fig.2, the element Vi represent the intensity values of the eight
neighboring pixels on a 3×3 neighborhood, V0 represents the intensity value of central pixel,
x and y are the user specified lag values.
{
}
( )
Fig.3: Representation of (a) a 3×3 TOM neighborhood (b) fuzzy values (c) Fuzzy based TOM.
2.4 Texton Detection
Various algorithms are proposed by many researchers to extract color, texture and shape features. Color is the most distinguishing important and dominant visual feature. That‟s why color histogram techniques remain popular in the literature. The main drawback of this is, it lacks spatial information. To address this problem, texture patterns are introduced in the literature. The Textons [26]which represent various Patterns provide significant and abundance of texture and shape information. Textons have more powerful description ability than the pixels themselves.
© 2016, IJCSMC All Rights Reserved 288
151 143 143 143 152 153 3 2 2 1 2 3
151 143 143 143 152 153 3 2 2 1 2 3
155 142 142 138 147 153 3 0 0 0 1 3
157 143 143 135 142 151 3 1 1 0 2 3
157 143 143 135 142 151 3 1 1 0 2 3
154 146 146 140 143 148 3 2 2 1 4 4
(a) (b)
0 2 2 1 2 0 0 1 1 1 1 0
0 2 2 1 2 0 0 1 1 1 1 0
0 0 0 0 1 0 0 1 1 1 1 0
0 1 1 0 2 0 0 1 1 1 1 0
0 1 1 0 2 0 0 1 1 1 1 0
0 0 0 1 0 0 0 0 0 1 0 0
(c ) (d)
Fig.4: Illustration of the Binary TOFTBM Matrix (a) TOM image (b) Detection of fuzzy values (c) Fuzzy texton mapping process on a 3×3 neighborhood d) Texture orientation Fuzzy Texton binary image.
2.5 Evaluation Of Texture Shape Features On TOFTBM
The present paper evaluated Texture Shape Features (TSF) on TOFTBM. The considered TSF on TOFTBM are Diamond, non connected Diagonal pixels (NCDP), Vertical Mid-Line, Horizontal Mid-Line and Blob which are donated as TSF1,TSF2,TSF3,TSF4 and TSF5 respectively as shown in Fig.5.
0 1 0 1 0 1 0 1 0 0 0 0 1 1 1
1 0 1 0 0 0 0 1 0 1 1 1 1 0 1
0 1 0 1 0 1 0 1 0 0 0 0 1 1 1
(a) (b) (c) (d) (e)
3. RESULTS AND DISCUSSIONS
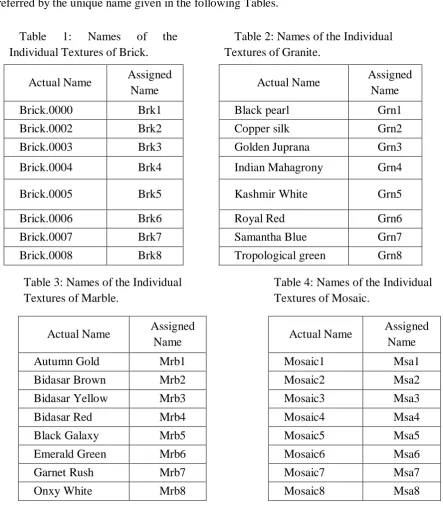
The proposed rotationally invariant classification method “TOFTBM using TSF” carried out the experiments on various Brick, Granite, Marble and Mosaic textures. These textures are collected from Broadtz,Vistex album, Akarmarble album , Ashishimpex album and Tradekey album databases. It becomes laborious to provide results for a large set of textures at each stage of discussion, because of which the present paper has considered eight textures from each group of stones with a resolution of 256256. The four classes of stone textures are displayed in Fig.6. with a resolution of 128128 to restrict the size of the paper. The names of the individual textures are given in the Tables 1, 2, 3 and 4 for Brick, Granite, Marble and Mosaic Textures respectively. For each individual texture a name is assigned with three characters followed by a digit. Now onwards the individual textures will be referred by the unique name given in the following Tables.
Table 1: Names of the Individual Textures of Brick.
Table 2: Names of the Individual Textures of Granite.
Actual Name Assigned
Name Actual Name
Assigned Name
Brick.0000 Brk1 Black pearl Grn1
Brick.0002 Brk2 Copper silk Grn2
Brick.0003 Brk3 Golden Juprana Grn3
Brick.0004 Brk4 Indian Mahagrony Grn4
Brick.0005 Brk5 Kashmir White Grn5
Brick.0006 Brk6 Royal Red Grn6
Brick.0007 Brk7 Samantha Blue Grn7
Brick.0008 Brk8 Tropological green Grn8
Table 3: Names of the Individual Textures of Marble.
Table 4: Names of the Individual Textures of Mosaic.
Actual Name Assigned
Name Actual Name
Assigned Name
Autumn Gold Mrb1 Mosaic1 Msa1
Bidasar Brown Mrb2 Mosaic2 Msa2
Bidasar Yellow Mrb3 Mosaic3 Msa3
Bidasar Red Mrb4 Mosaic4 Msa4
Black Galaxy Mrb5 Mosaic5 Msa5
Emerald Green Mrb6 Mosaic6 Msa6
Garnet Rush Mrb7 Mosaic7 Msa7
© 2016, IJCSMC All Rights Reserved 290
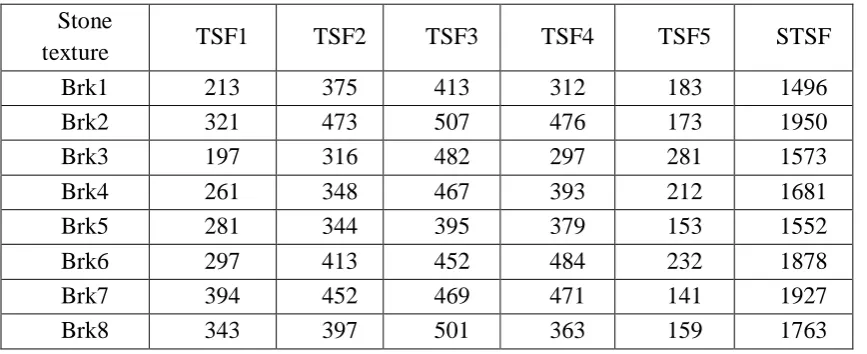
To evaluate a good classification based on the TSF on the proposed TOFTBM, the present paper initially computed the frequency occurrences of each TSF. The frequency occurrences of TSF on TOFTBM on Brick, Granite, Mosaic and Marble textures are furnished in Tables 5, 6, 7 and 8 respectively. In the following tables STSF indicates sum of all TSF‟s considered.
Table 5: Frequency occurrences of TSF on brick using TOFTBM. Stone
texture TSF1 TSF2 TSF3 TSF4 TSF5 STSF
Brk1 213 375 413 312 183 1496
Brk2 321 473 507 476 173 1950
Brk3 197 316 482 297 281 1573
Brk4 261 348 467 393 212 1681
Brk5 281 344 395 379 153 1552
Brk6 297 413 452 484 232 1878
Brk7 394 452 469 471 141 1927
Brk8 343 397 501 363 159 1763
Table 6: Frequency occurrences of TSF on granite using TOFTBM. Stone
texture TSF1 TSF2 TSF3 TSF4 TSF5 STSF
Grn1 263 328 321 213 148 1273
Grn2 272 356 294 337 106 1365
Grn3 185 243 283 265 93 1069
Grn4 197 241 317 293 123 1171
Grn5 133 184 216 205 153 891
Grn6 137 207 275 183 115 917
Grn7 180 187 192 153 185 897
Grn8 135 198 278 192 142 945
Table 7: Frequency occurrences of TSF on mosaic using TOFTBM. Stone
texture TSF1 TSF2 TSF3 TSF4 TSF5 STSF
Msa1 643 637 821 753 266 3120
Msa2 543 690 723 715 292 2963
Msa3 417 412 626 425 195 2075
Msa4 650 546 665 697 313 2871
Msa5 497 573 541 688 379 2678
Msa6 463 497 585 484 327 2356
Msa7 624 613 613 704 317 2871
© 2016, IJCSMC All Rights Reserved 292
Table 8: Frequency occurrences of TSF on marble using TOFTBM. Stone
texture TSF1 TSF2 TSF3 TSF4 TSF5 STSF
Mrb1 37 106 113 85 74 415
Mrb2 93 115 123 136 46 513
Mrb3 95 117 237 273 152 874
Mrb4 79 158 127 165 57 586
Mrb5 67 81 99 77 67 391
Mrb6 63 107 121 88 83 462
Mrb7 84 292 203 113 92 784
Mrb8 105 185 263 129 131 813
Algorithm one: ALGORITHM FOR TEXTURE CLASSIFICATION USING SUM OF TSF’S (STSF)
Begin
if (STSF > 400 )&&(STSF < 875)
print “THE TEXTURE IS MARBLE” else if (STSF >=875 )&& (STSF <1400)
print “THE TEXTURE IS GRANITE” else if (STSF >= 1400 )&& (STSF < 2000)
print “THE TEXTURE IS BRICK” else if (STSF >= 2000) && (STSF <= 3500)
print “THE TEXTURE IS MOSAIC” End
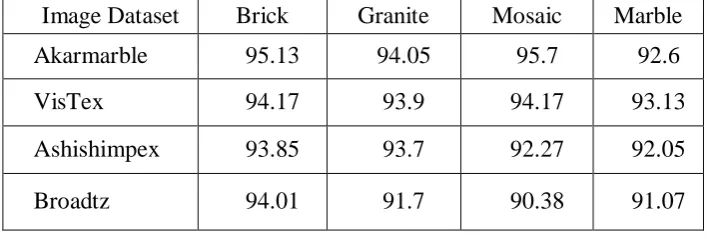
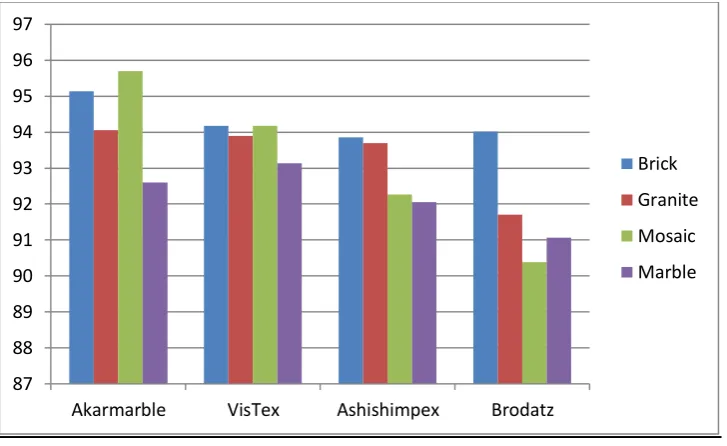
Based on the above algorithm, the present paper carried out percentage of classification rate using STSF on the proposed TOFTBM for different group of stone databases and listed in Table 9 and also graphical representation is shown in Fig.7.
Table 9: Mean % classification rate of the proposed method.
Image Dataset Brick Granite Mosaic Marble
Akarmarble 95.13 94.05 95.7 92.6
VisTex 94.17 93.9 94.17 93.13
Ashishimpex 93.85 93.7 92.27 92.05
Fig.7: Mean % classification rate graph of proposed method.
3.1 Comparison with the other methods
The proposed TOFTBM method is compared with Syntactic Pattern on 3D method [27] Primitive Pattern Unit approach [28] and texton feature evolution method [29]. The above two methods [27,28] classified stone textures into two groups only. This indicates that the existing methods [27,28] failed in classifying all stone textures. The percentage of classification rates of the proposed method and other existing methods [27,28,29] are listed in Table 10. The Table 10 clearly indicates that the proposed TOFTBM method outperforms the two existing methods [27,28]. However it shows little bit low classification rate when compared to texton feature evolution method [29]. This is due to the rotational invariant property of the proposed method.
Table 10: Mean % classification rate of the proposed and existing methods.
87 88 89 90 91 92 93 94 95 96 97
Akarmarble VisTex Ashishimpex Brodatz
Brick
Granite
Mosaic
Marble
Image Dataset
Syntactic Pattern on 3D
method
Primitive Pattern Unit approach
Texton Feature Detection
Proposed TOFTB method
Akarmarble 93.29 92.19 95.56 94.37
VisTex 92.53 92.56 94.15 93.84
Ashishimpex 93.30 91.29 95.27 92.96
© 2016, IJCSMC All Rights Reserved 294
4. CONCLUSION
The proposed TOFTBM with TSF can capture the spatial distribution of edges, and it is an efficient texture descriptor for images with heavy textural presence. The present paper created a new direction for classification of textures based on texture features derived from shape components on a 3×3 neighborhood. The proposed TOFTBM investigated texture classification using different Texture Shape Features TSF1, TSF2, TSF3, TSF4, TSF5 and STSF. The proposed method is computationally effective. Experimental results and comparison with other methods clearly indicates that proposed TOFTBM with STSF shows superior performance than existing methods.
REFERENCES
[1] Richards, J. A. and Xiuping, J. (1999). Remote Sensing Digital Analysis: An Introduction.
Germany: Springer- Verlag, vol.3, pp.363-363.
[2] Moody, A. and Johnson, D. M. (2001). Land-surface phenologies from AVHRR using the discrete fourier transform. Remote Sens. Environ., vol. 75, pp. 305-323.
[3] Zhang, M., Carder, K. and Muller, karger. (1999). Noise reduction and atmospheric correction for coastal applications of landsat thematic-mapper imagery. Remote Sens. Environ., vol. 70, pp. 167-180
[4] Burrough, P. A. (1983). Multiscale sources of spatial variation in soil, the application of fractal concepts to nested levels of soil variation. Journal of Soil Sci., vol. 34, pp. 577-597. [5] Atkinson, P. M. and Lewis, P. (2000). Geostatistical classification for remote sensing: An introduction. Comput. Geo. sci., Vol. 26, pp. 361-371.
[6] Curran, P. J. (1988). The Semivariogram in Remote Sensing: An Introduction. Remote Sens. Environ., vol. 24, pp. 493-507.
[7] Treitz, P. (2001). Variogram analysis of high spatial resolution remote sensing data: An examination of boreal forest ecosystems. Int. J. Remote Sens., vol. 22, pp. 3895-3900.
[8] Woodcock, C. E., Strahler, A. H. and Jupp, D. L. (1988). The use of variograms in remote sensing II: Real digital images. Remote Sens. Environ., vol. 25, pp. 349-379.
[9] Moody, A. and Johnson, D. M. (2001). Land-surface phenologies from AVHRR using the discrete fourier transform. Remote Sens. Environ., vol. 75, pp. 305-323.
[10] McCloy, K.R. (2002). Analysis and removal of the effects of crop management practices in remotely sensed images of agricultural fields. Int. J. Remote Sens., vol. 23, pp. 403-416. [11] Peder, Klith Bocher. and Keith, R. McCloy. (2006). The Fundamentals of Average Local Variance: Detecting Regular Patterns. IEEE Trans. on Image Processing, vol. 15, pp. 300- 310.
[12]. Ojala T., M. Pietikäinen, T. Mäenpää, Multiresolution gray-scale and rotation invariant texture classification with local binary patterns, IEEE Transactions on Pattern Analysis and Machine Intelligence 24 (7) (2002) 971–987.
[14]. Ahonen T., A. Hadid, M. Pietikäinen, Face description with local binary patterns: application to face recognition, IEEE Transactions on Pattern Analysis and Machine Intelligence 28 (12) (2006) 2037–2041.
[15]. Chandra Mohan M., Vijaya Kumar V., Sujatha B.,"Classification of child and adult based on geometric features of face using linear wavelets,"IJSIP, vol.1, Iss.3, pp: 211-220, 2010.
[16]. Chandra Mohan, VijayaKumar V., Damodaram A.,"Adulthood classification based on geometrical facial features," ICGST, 2009.
[17]. Chandra Mohan, VijayaKumar V., Venkata Krishna V., "Novel method of adult age classification using linear wavelet transforms," IJCSNS, pp: 1-8, 2010.
[18]. Marzabal A., C. Torrens, A. Grau, Textured-based characterization of defects in automobile engine valves, in: Proceedings of the Ninth Symposium on Pattern Recognition and Image Processing, Ed. Univ. Jaume I, 2001, pp. 267–272.
[19]. Paclik P., R. Duin, G. van Kempen, R. Kohlus, Supervised segmentation of textures in backscatter images, in: Proceedings of the 16th International Conference on Pattern Recognition, Quebec City, 2002, pp. 490–493.
[20]. Lucieer A., A. Stein, P. Fisher, Multivariate texturebased segmentation of remotely sensed imagery for extraction of objects and their uncertainty, International Journal of Remote Sensing 26 (14) (2005) 2917–2936.
[21]. Eswara Reddy B., A. Nagaraja Rao, A. Suresh, V.Vijaya Kumar “Texture Classification by Simple Patterns on Edge Direction Movements”, IJCSNS International Journal of Computer Science and Network Security, VOL.7 No.11, November 2007,pages: 221-225.
[22] R.L. Kashyap, A. Khotanzed, A model-based method for rotation invariant texture classification, IEEE Transactions on Pattern Analysis and Machine Intelligence 8 (4) (1986) 472–481.
[23] J. Mao, A.K. Jain, Texture classification and segmentation using multi- resolution simultaneous autoregressive models, Pattern Recognition 25 (2) (1992) 173–188 .
[24] M. Varma, A. Zisserman, A statistical approach to texture classification from single images, International Journal of Computer Vision 62 (1–2) (2005) 61–81.
[25] T. Ojala, M. Pietik¨ainen, T.T. M¨aenp¨a¨ a, Multiresolution gray-scale and rotation invariant texture classification with local binary pattern, IEEE Transactions on Pattern Analysis and Machine Intelligence 24 (7) (2002) 971–987.
[26] Julesz, B. and J.R. Bergen. 1983. Textons, the fundamental elements inpreattentive vision and perception of textures, Bell System Tech. J. 62, 1619-1646 .
[27] Suresh A and Vijaya Kumar V. et al., “Pattern Based Classification of Stone Textures on a Cubical Mask,” International Journal of Universal Computer Sciences (Vol.1-2010/Iss.1) pp. 4-9
[28] Suresh A. , Raju U S N, and Vijaya Kumar, V. et al. (2010) An Innovative Technique of Stone Texture Classification Based on Primitive Pattern Units, Journal of Signal and Image Processing (Vol.1-2010/Iss.1 pp. 40-45